- SPY Challenges Short-term Resistance.
- Small-caps Continue to Act Well.
- Retail Comes Alive.
- Kohls, Nordstrom and Michael Kors.
- Cyber Security, Networking and Software Show Leadership.
- Copper Miners ETF Breaks Out within Consolidation.
 SPY Challenges Resistance...
The S&P 500 is flirting with the 200-day simple moving average as it consolidates over the last twelve days. The chart below shows the S&P 500 SPDR (SPY) plunging below 260 on March 23rd and then stalling with a choppy range.
This choppy trading range reflects a battle, and a stalemate, between bulls and bears over the last twelve days. SPY established resistance in the 266-267 area with at least two highs and a break above 267 is needed to reverse the short-term downtrend. This could be significant because it would signal a successful test of the February low.
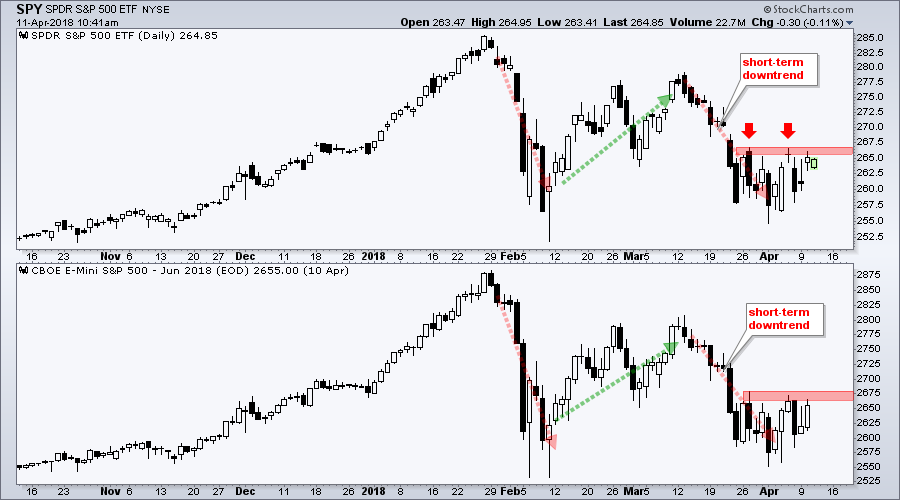
Note that a breakout in SPY would also be significant because it represents the leading market benchmark (the S&P 500). Most stocks and ETFs go the way of this key benchmark so we should watch it carefully. A breakout failure would weigh on most stocks, while a successful breakout would lift more boats.
Also note that the late March and early April highs mark benchmark highs that chartists can use for comparison. Stocks and ETFs trading above their late March and/or early April highs show relative chart strength because SPY has yet to break above these highs. The leaders during the consolidation could continue to lead if SPY breaks out.
Small-caps Continue to Act Well
The S&P SmallCap iShares (IJR) held up better than SPY since early February and looks poised for another short-term breakout. The chart shows IJR holding well above the February low in March. SPY, in contrast, tested this low. IJR also held above the early March low in early April and again showed relative "chart" strength. SPY, in contrast, moved well below its early March low.
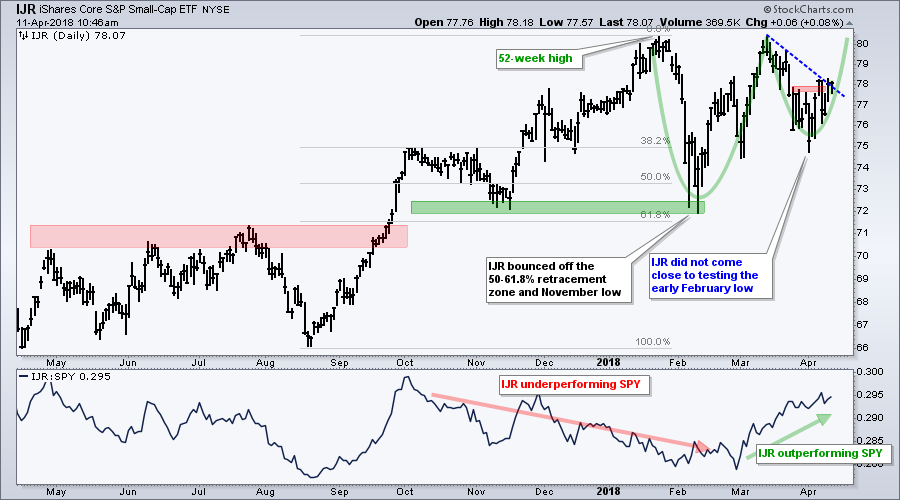
IJR fell from 80 in mid March to 75 in early April and appeared to break short-term resistance with the move above 78 last week. The ETF fell back below 77 on Friday, but recovered this week and another breakout is in the making.
I do not like to draw incomplete patterns, but a short-term breakout would argue for a challenge to the January-March highs and a move to these highs would form a cup-with-handle, which is a bullish continuation pattern (green lines).
Retail Comes Alive
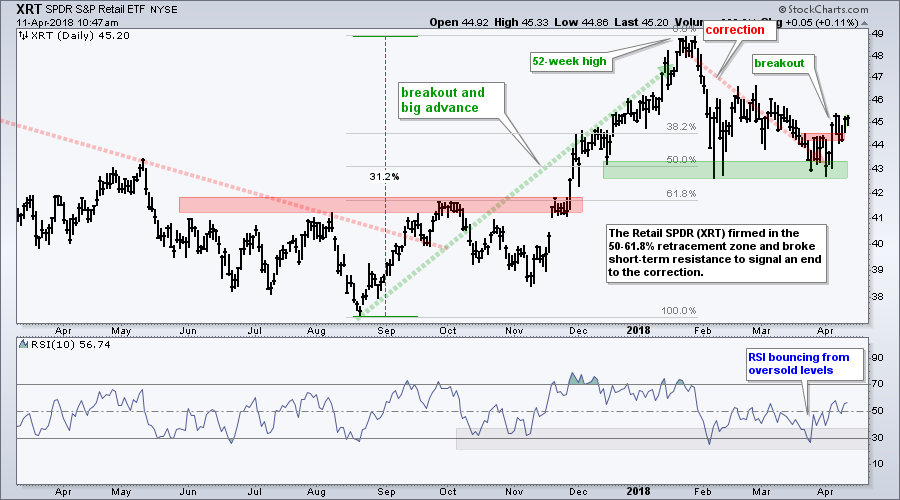
The Retail SPDR (XRT) is taking the lead in April with a break above the late March high last week. Overall, I view the 31% advance from August to January as part of the primary trend (up) because the ETF recorded a 52-week high. The decline from January to March is the secondary trend (correction). This means the breakout signals a continuation of the primary uptrend and this is bullish for retail.
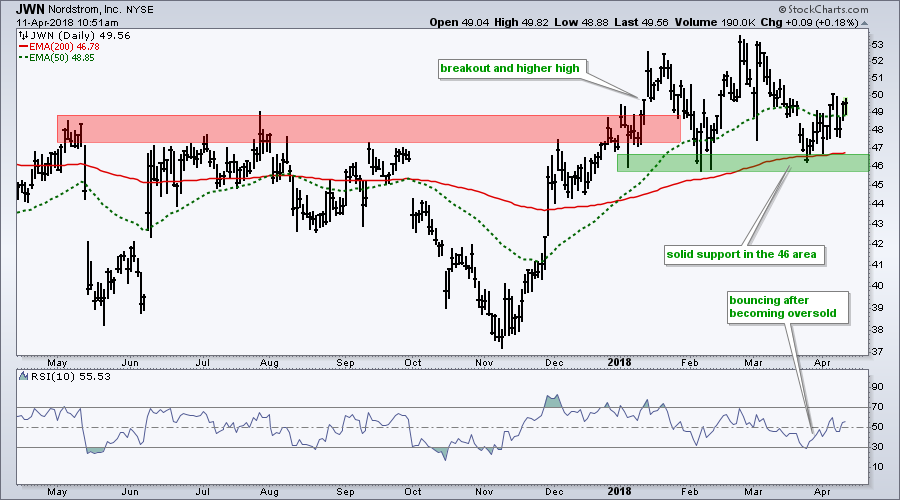
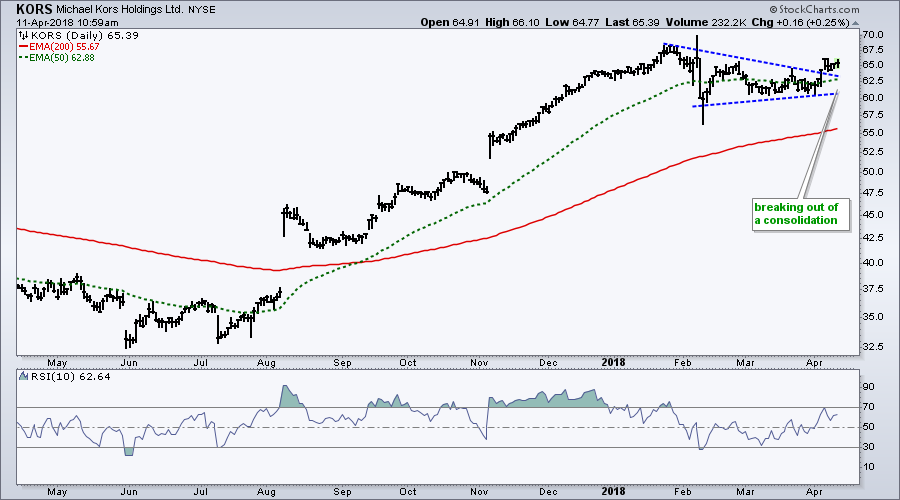
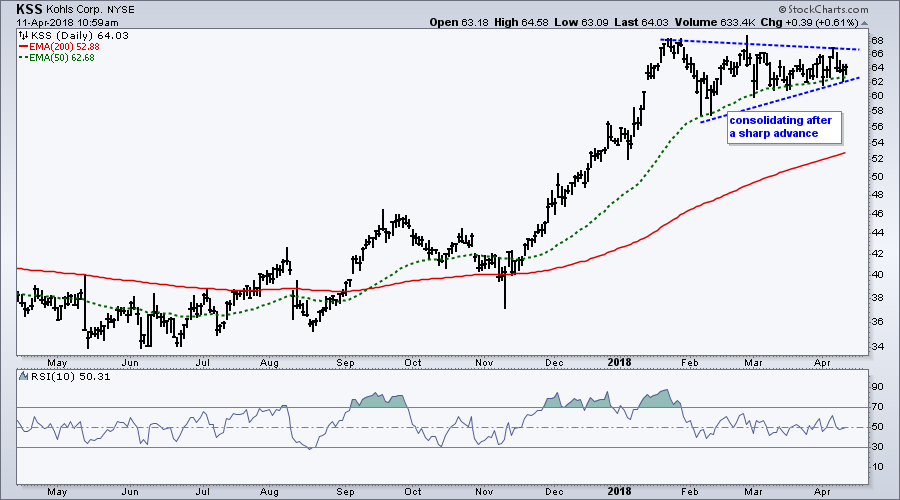
Kohls, Nordstrom and Michael Kors
Retail stocks are quite mixed overall, but we are seeing some notable new highs recently. AEO, ANF, FIVE, GES, M, TJX, URBN and ZUMZ recorded new highs over the last five days. Here are three more stocks with bullish charts.
Cyber Security, Networking and Software Show Leadership
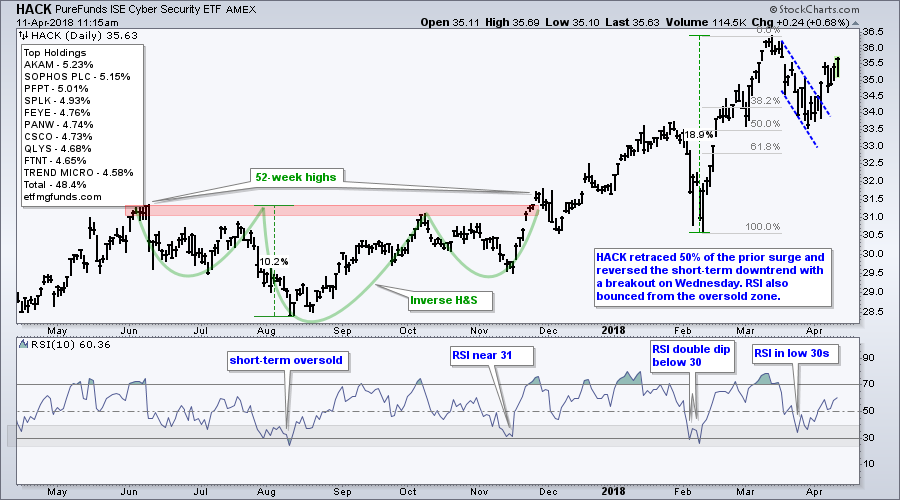
The Cyber Security ETF (HACK) continues to act well with a flag breakout on April 4th and a strong recovery after Friday's decline below 35. The overall trend is clearly up, the flag looks like a correction and the breakout opens the doors to new highs. Check out the chart for FEYE.
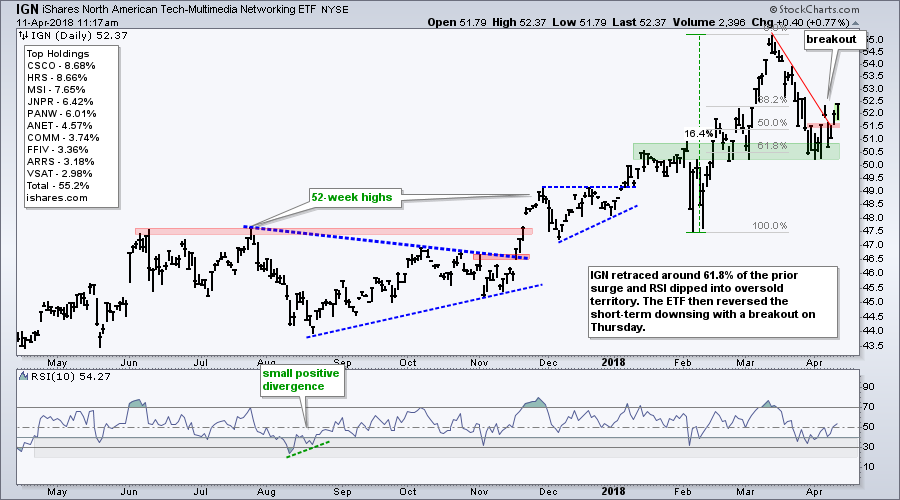
The next chart shows the Networking iShares (IGN) finding support near the 61.8% retracement and broken resistance in the 50.5 area. It looks like the ETF reversed its downswing with a second breakout over the last two days. Check out the CSCO chart.
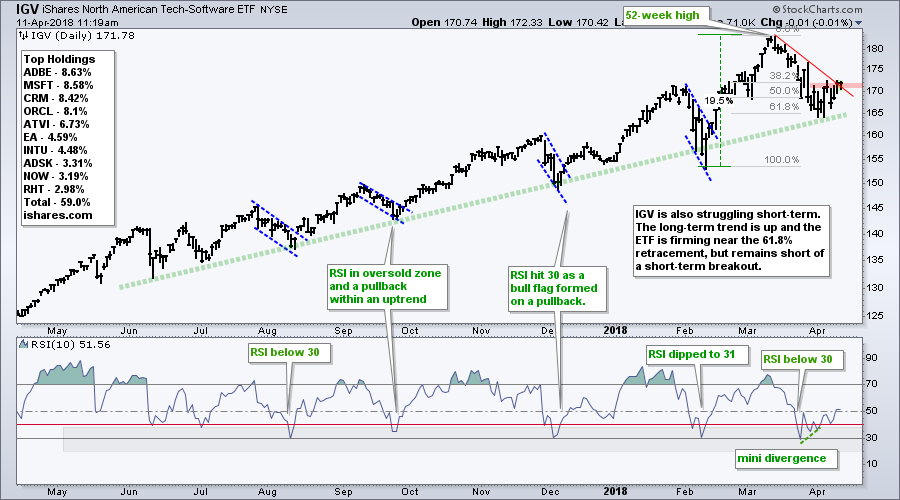
The Software iShares (IGV) is also trying to turn up and break short-term resistance. First and foremost, notice that the overall trend is up with higher highs and higher lows over the past year. The ETF hit a 52-week high in March and retraced around 61.8% of the Feb-Mar advance with the recent pullback. It looks like another higher low is forming as the ETF turns up again. Check out the Autodesk chart.
Copper Miners ETF Breaks Out within Consolidation
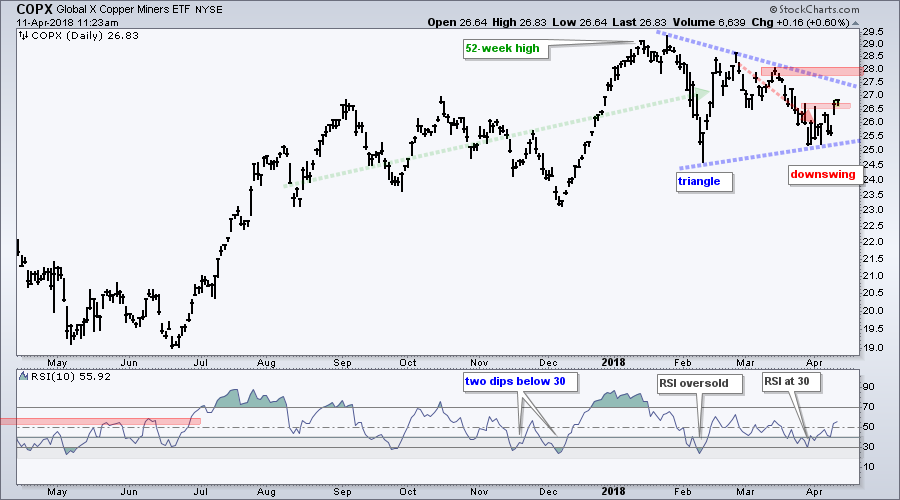
The Copper Miners ETF (COPX) shows a technique to trade the breakout within a bigger bullish pattern. First, the long-term trend is up with the 52-week high in January. Second, the triangle looks like a consolidation within an uptrend and this is a bullish continuation pattern. Third, the March decline marks the downswing within this triangle. It looks like COPX reversed this downswing with a breakout today and triangle resistance is the next challenge.
Plan Your Trade and Trade Your Plan.
- Arthur Hill, CMT
Senior Technical Analyst, StockCharts.com
Book: Define the Trend and Trade the Trend
Twitter: Follow @ArthurHill


