- IJR Moves above Chandelier Exit.
- Finance Sector Underperforms.
- Regional Bank SPDR Forms Bear Flag.
- 10-yr Yield Breaks out of Flag.
- Yield Curve Sinks to Multi-year Lows.
- Bond Bounce May be Ending.
- Commodities are on the Move.
- Copper Bounces off Support (plus COPX).
- Gold Forms Bullish Cup-with-Handle.
 The S&P SmallCap iShares (IJR) is leading the market with a surge above the Chandelier Exit and challenge to the January-March highs. I noted the breakout in IJR last week and the bullish cup-with-handle pattern. Today I will refer back to the mean-reversion strategy that uses RSI for entries and the Chandelier Exit for exits.
First and foremost, note that the mean-reversion strategy uses technical indicators, but I would not really call it "technical analysis", at least not classical technical analysis. One needs to throw out chart patterns, candlestick formations, support and resistance when looking at this strategy. It is simply a different animal.
Having clarified that, the system generates a buy signal when RSI crosses above 30 and a sell signal when price closes below the Chandelier Exit. See this article for complete details and backtesting. I also added the PPO to confirm sell signals by requiring it to cross below its signal line. However, I am not sure how much value the PPO really adds. Sometimes the PPO catches a longer trend and sometimes it leads to a late exit. Study a few dozen signals before making judgement!
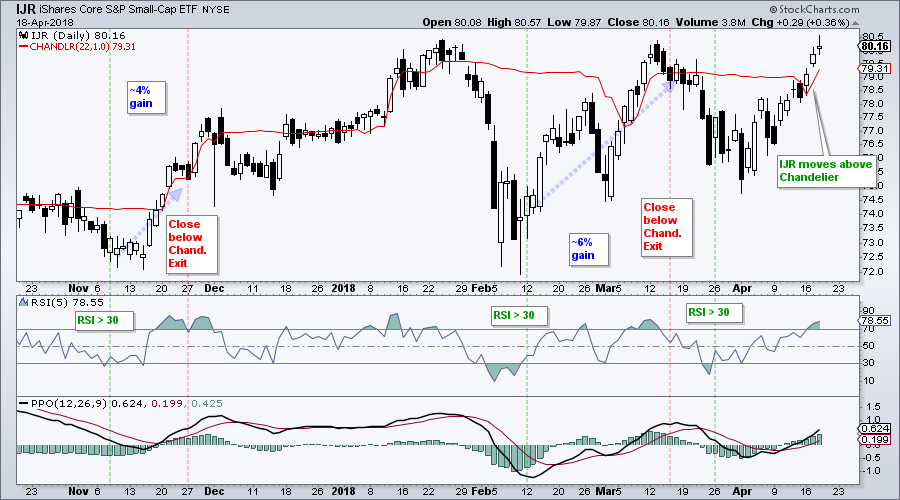
The chart above shows IJR with two completed trades and an active long trade. The ETF moved above the Chandelier Exit three days ago and this becomes the trailing stop. A close below 79.31 would trigger an exit (next open). Chartists looking to ride the trend a little longer can consider waiting for the PPO to cross below its signal line.
Finance Sector Underperforms
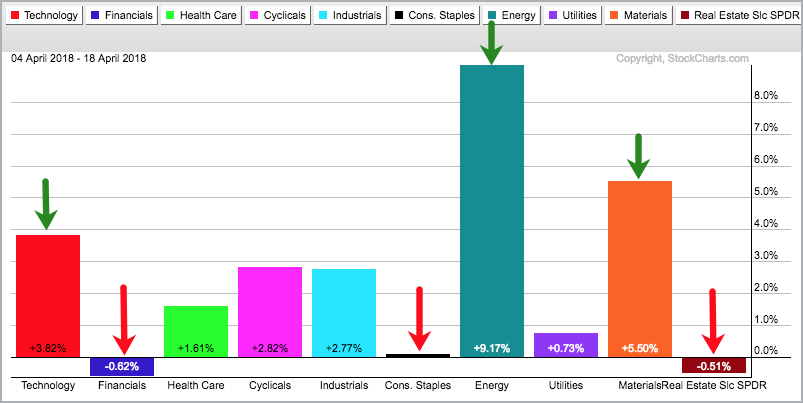
The Financials SPDR (XLF) is struggling over the last two weeks with a .62% loss. The PerfChart below shows performance for the ten sector SPDRs since April 4th. XLF and XLRE are the only two with losses. XLU and XLP are struggling with the smallest gains. XLE, XLB and XLK are leading with the biggest gains.
The price chart shows XLF forming a lower high from January to March, breaking wedge support with a gap down on March 22nd and holding this break down. A small rising flag/wedge could be taking shape now and a break below the green support zone would signal a continuation lower.
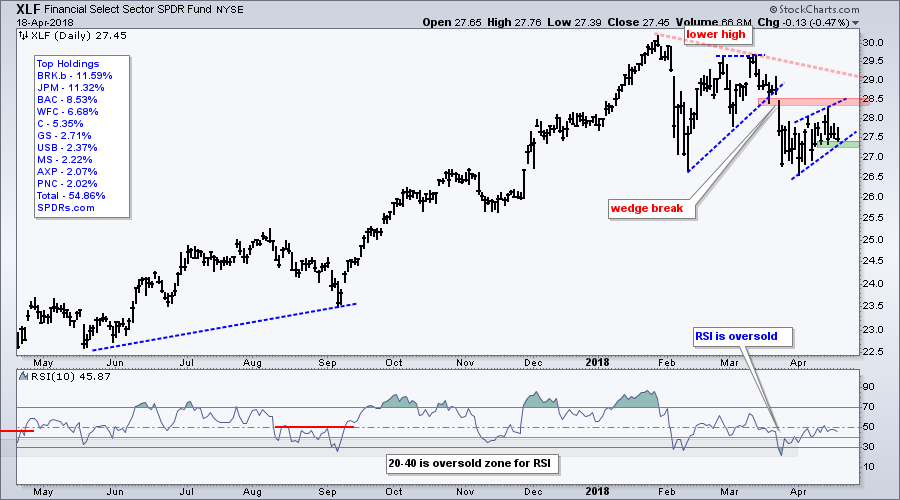
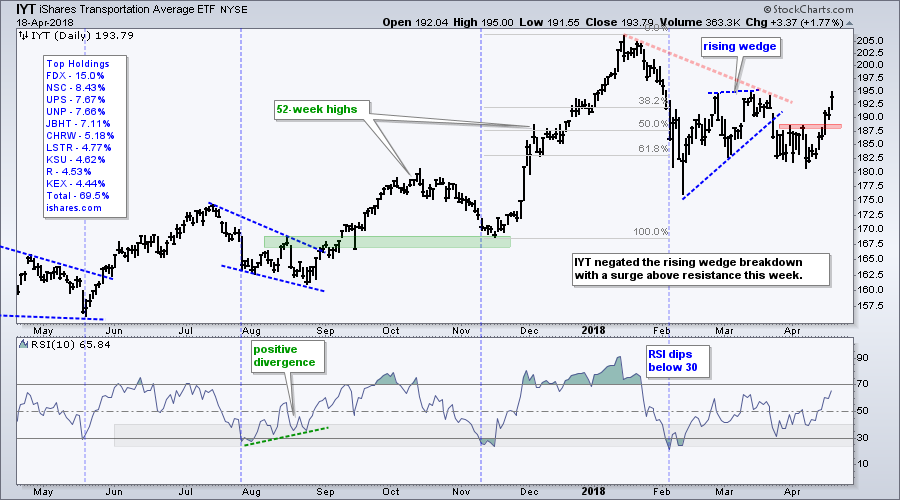
The wedge break and mid-April high mark the first resistance zone to watch. A break above 28.5 would be bullish for XLF. Note that the Transport iShares (IYT) had a similar pattern at work (wedge break) and then surged above the wedge break this week. Right now, the wedge break and resistance are the dominant chart features for XLF and we have yet to see the bulls prove the bears otherwise.
Regional Bank SPDR Forms Bear Flag
SPY is up seven of the last ten days, but the Regional Bank SPDR (KRE) is down six of the last ten days and underperforming. I still think the long-term trend is up for KRE because the ETF hit a 52-week high last month and the PPO(5,200,0) is positive.

I thought KRE was poised to break to the upside last week, but the breakout attempt failed with the decline over the last four days. It is possible that a bear flag is taking shape and a break below 59 would confirm this pattern.
10-yr Yield Breaks out of Flag
Before getting too bearish on banks and the finance sector, note that the 10-yr T-Yield ($UST10Y) broke out of a falling flag this week. This move signals a continuation of the prior surge (December to February) and opens the door to 3%. This is bearish for bonds.
Longer-term, note that a massive inverse head-and-shoulders pattern formed from September 2014 to January 2018. The 10-yr broke out earlier this year and this means the multi-decade decline in bond yields has ended. We are now in a rising rate environment.
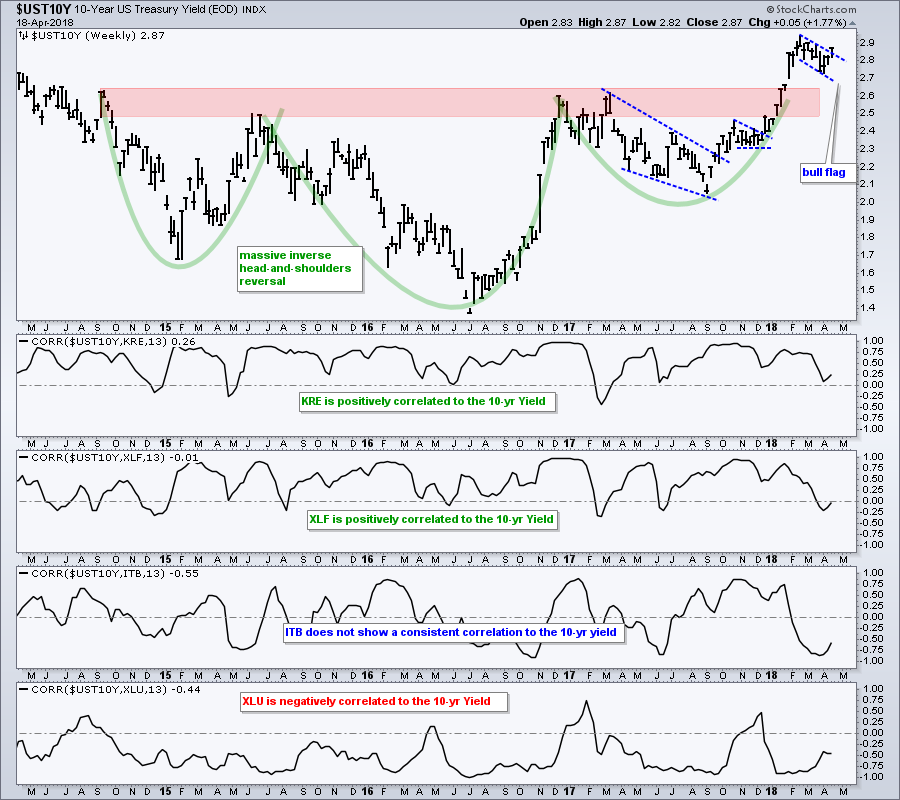
The indicator windows show the Correlation Coefficients for KRE, XLF, ITB and XLU. Note that both KRE and XLF show a strong positive correlation to the 10-yr yield. This means they tend to move in the same direction.
The Home Construction iShares (ITB) shows a mixed correlation - sometimes positive and sometimes negative. The Utilities SPDR (XLU) has a mostly negative correlation. This means further gains in the 10-yr yield could be negative for utes. I would put REITs in the same category.
Yield Curve Sinks to Multi-year Lows
The next chart shows the 30-year, 10-year, 5-year and 2-year yield in the top window and the yield curve (10yr less 2-yr) in the lower window. First, note that the 5-yr T-Yield ($UST5Y) and 2-yr T-Yield ($UST2Y) hit new highs this month. Short-term rates are clearly in a long-term uptrend.
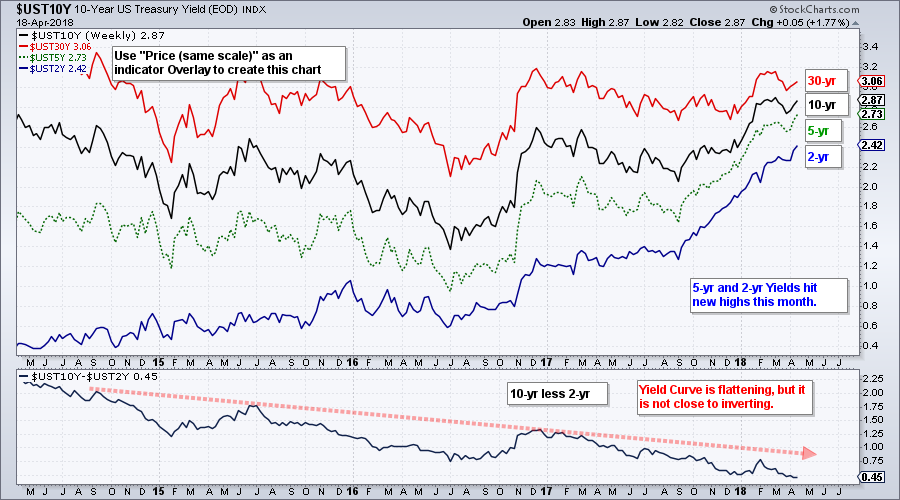
The indicator window shows the yield curve moving to its lowest level in years, but it is still far from becoming inverted, which would require the 2-year yield to exceed the 10-year yield. A The trouble does not start until we see the yield curve invert and the 10-2 spread turn negative.
Bond Bounce May be Ending
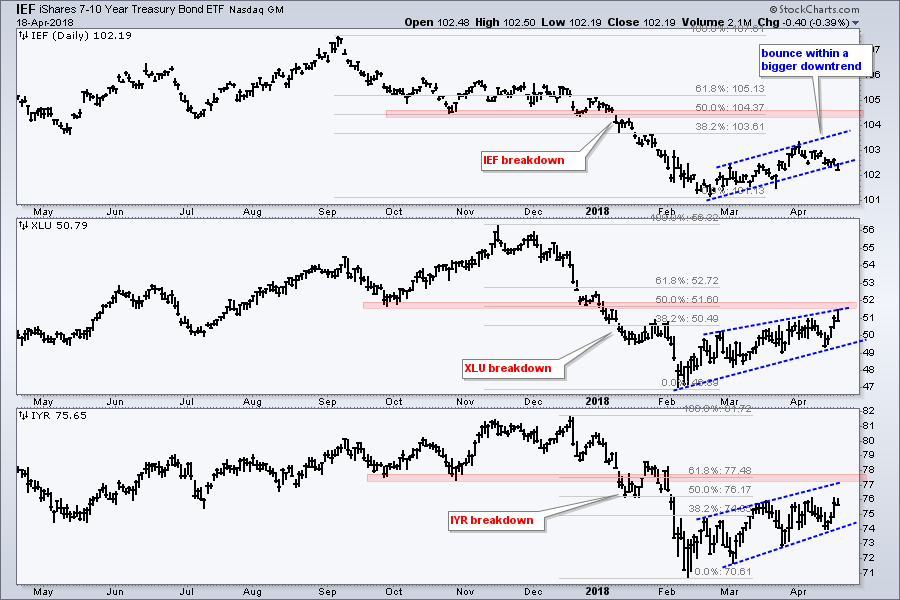
The next chart shows the 7-10 YR T-Bond ETF (IEF), Utilities SPDR (XLU) and REIT iShares (IYR) with long-term downtrends and bear market bounces. All three broke down in January and then bounced from February to April. The retracements and patterns vary, but these are still considered bear market rallies. IEF is already starting to break down and XLU is near resistance from broken support.
Commodities are on the Move
Commodities are on the rise over the last two weeks. The PerfChart below shows the two week percentage change for ten commodities. Palladium is up around 15% and oil is up almost 8%, while silver and wheat are up over 5%. The charts and trends differ for each, but it is quite unique to see such a diverse group moving higher.

Note that the Light Crude ($WTIC), Brent Crude ($BRENT), Cocoa ($COCOA) and Lumber ($LUMBER) hit new highs this week. Palladium ($PALL) broke out of a falling wedge. Corn ($CORN) has been basing for over three years. Cotton ($COTTON) is in a long-term uptrend and near a 52-week high. Soybeans ($SOYB) are coming out of a rounded bottom that formed from August 2016 to now. These symbols are all for continuous futures contracts.
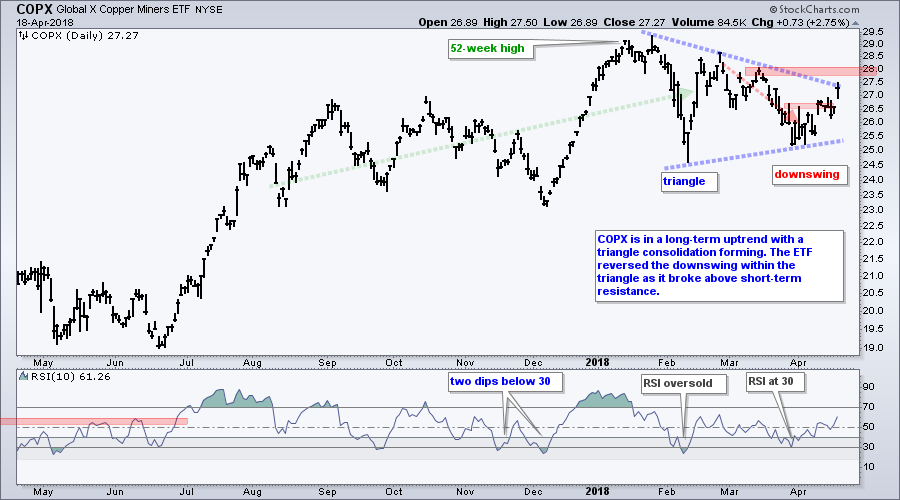
Copper Bounces off Support (plus COPX)
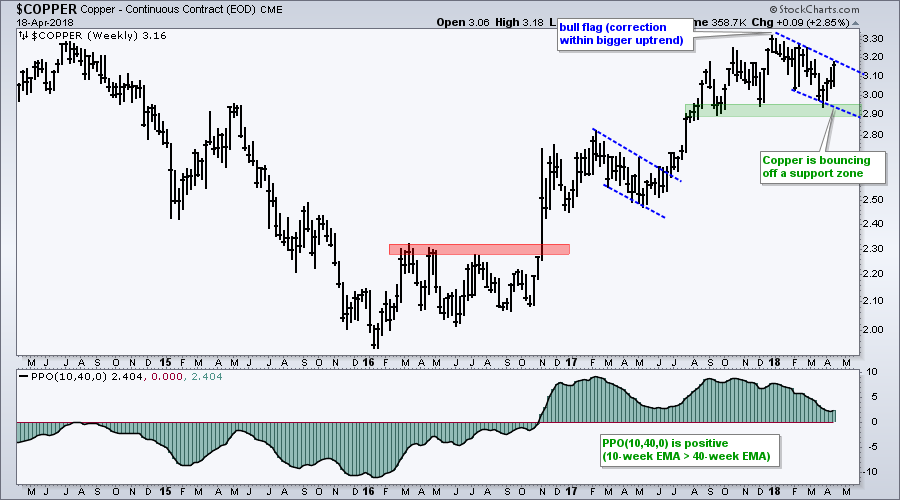
The chart below shows the Copper Continuous Contract ($COPPER) bouncing off support and challenging the flag trend line.
The next chart shows the Copper Miners ETF (COPX) forming a triangle within a bigger uptrend. This consolidation viewed as a bullish continuation pattern so an upside resolution is expected. Short-term, the downswing within this triangle reversed as the ETF surged above short-term resistance.
Gold Forms Bullish Cup-with-Handle
The Gold SPDR (GLD) has been trending higher for over a year now and recently formed a cup-with-handle. This is a bullish continuation pattern and a break above rim resistance would signal a continuation higher. Even though the cup-with-handle is bullish, a breakout would simply confirm what is already underway (an uptrend).
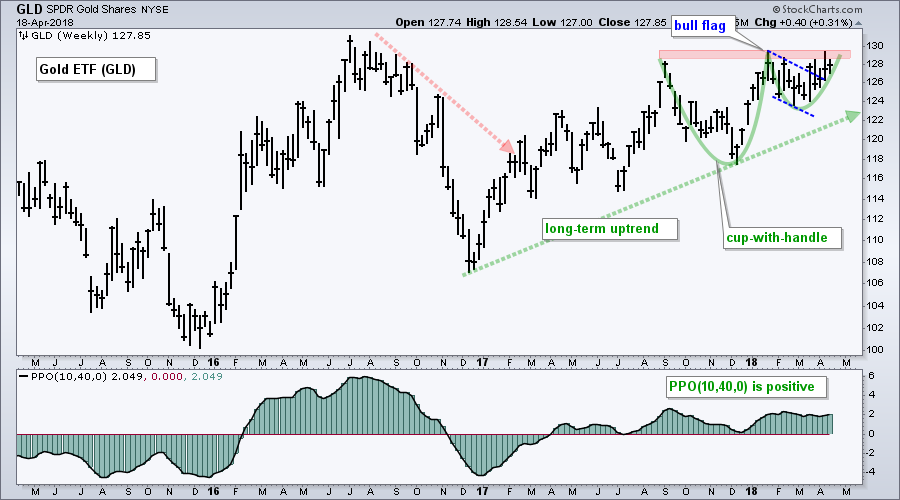
The handle shows a falling flag forming from January to March and a breakout over the last few weeks. Admittedly, the breakout has been a choppy affair, but I will err on the side of the bigger trend, which is up. In other words, bullish resolutions are more likely when the bigger trend is up.
Plan Your Trade and Trade Your Plan.
- Arthur Hill, CMT
Senior Technical Analyst, StockCharts.com
Book: Define the Trend and Trade the Trend
Twitter: Follow @ArthurHill


