- A Narrowing Range for the S&P 500.
- Monitoring the Upswing in SPY.
- Raff Regression Channel Explained.
- QQQ Weathers Semiconductor Weakness.
- IJR Challenges Rim Resistance.
- Big Wedge and Little Wedge in XLF.
- XLY, XLK and XLI Lead the Big Sectors.
- SOXX Fails to Hold Breakout.
- Notes from the Art's Charts ChartList.
 A Narrowing Range for the S&P 500...
The S&P 500 sums up the broad market environment for 2018 quite well: choppy. The index surged to new highs in late January, plunged 10% into early February, bounced, fell and bounced again. With a lower high in March and higher low in April, a narrowing trading range is taking shape.
The chart below shows a triangle after a 52-week high and the 50-day SMA is also above the 200-day SMA. Triangles are typically continuation patterns. Assuming the long-term trend is up, this makes the triangle a bullish continuation pattern and an upside breakout is expected.
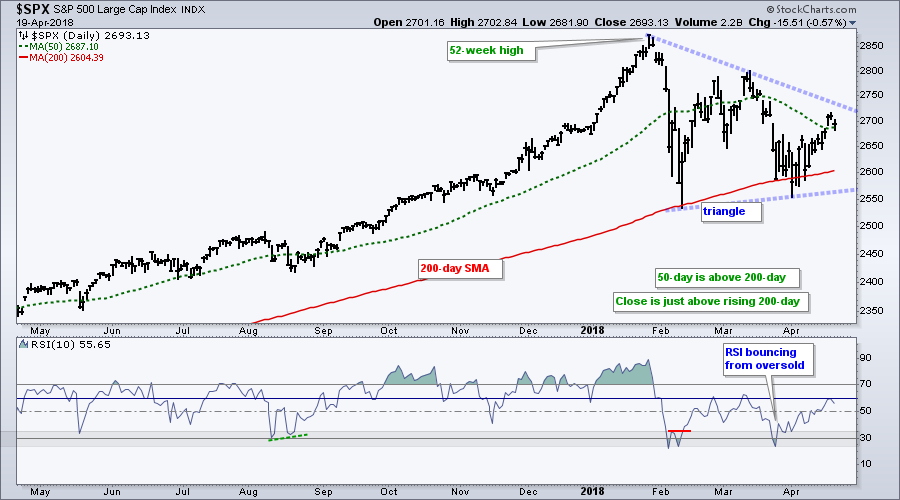
This is the stock market, however, and expectations do not always go as expected, surprise surprise. Even though this may seem too short-term, I am watching the swings within the triangle to get a jump on the next break. There are currently four swings. Down into early February, up into mid March, down into early April and up since early April.
Monitoring the Upswing in SPY
The S&P 500 SPDR (SPY) and E-mini are the tradable instruments I use to measure the swings. The red and green arrow lines show four weeks since late January. The SPY chart shows a Raff Regression Channel defining the current upswing. Combined with the lows on April 10th and 11, I would mark upswing support for SPY at 263. A close below this level would reverse the upswing and put me back on the defensive.
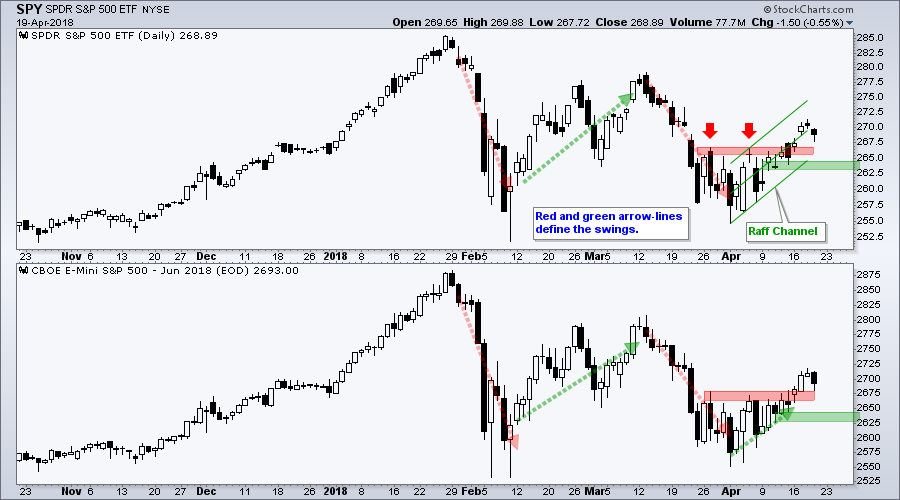
Note that many ETFs and stocks were short-term oversold in late March and we were see some "green shoots" appearing. These green shoots gave way to breakouts and short-term uptrends. It is now time to monitor the bounce.
Raff Regression Channel Explained
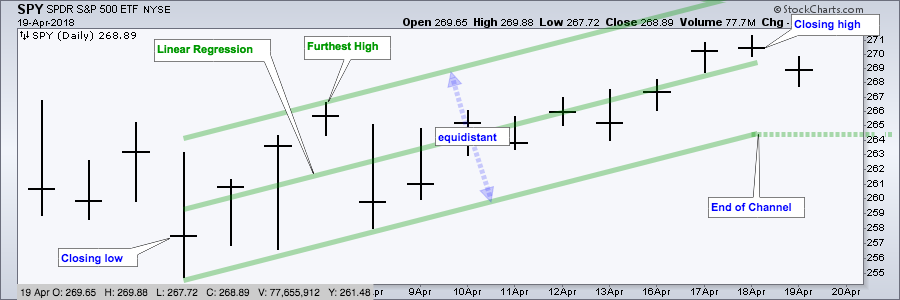
The Raff Regression Channel consists of three lines. The middle line is a linear regression, which is the line of best fit for a data set. The upper and lower lines are equidistant and set based on the furthest high or low from the linear regression. This makes them a volatility-based channel of sorts. The channel starts from the closing low of the move and extends to the closing high. The end of the lower line can be used to define the upswing and a break below this level would argue for a trend reversal.
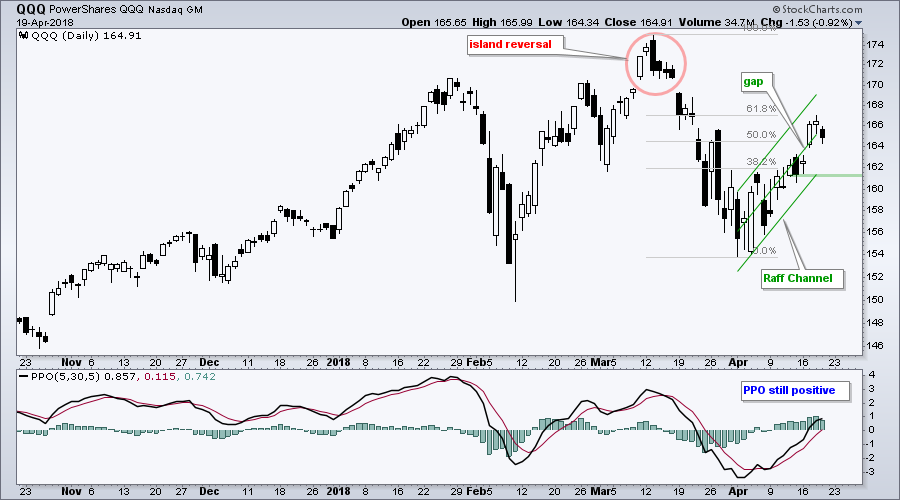
QQQ Weathers Semiconductor Weakness
The Nasdaq 100 ETF (QQQ) held up pretty good considering the strong selling pressure in semiconductors on Thursday. Like SPY, QQQ remains in a clear upswing defined by the Raff Regression Channel and April 13th close. A close below 161 would reverse this upswing and argue for a continuation of the March decline. Chartists can also watch the PPO (5,30,5) to confirm with a move below its signal line.
IJR Challenges Rim Resistance
The S&P SmallCap iShares (IJR) surged to rim resistance of a cup-with-handle and fell back on Thursday with a modest decline. IJR is clearly leading because it is the only major index ETF to hit a new high this month (intraday on Wednesday).
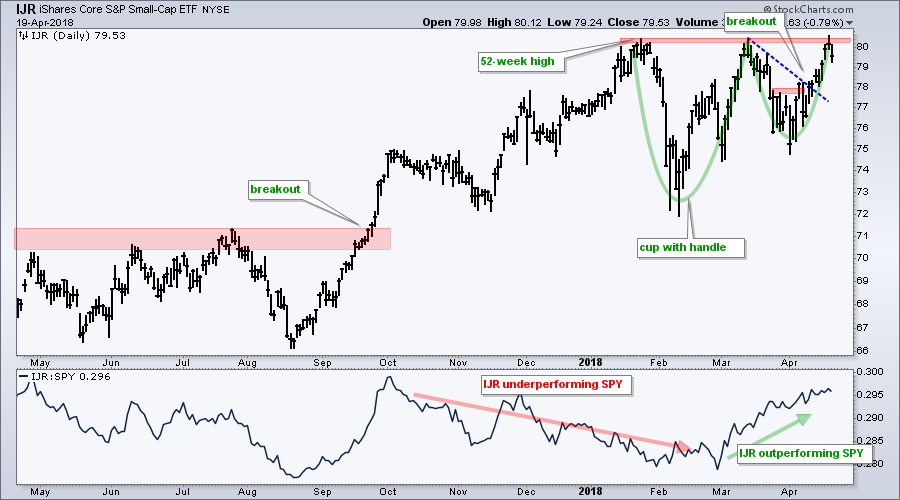
Despite upside leadership, small-caps will follow large-caps so we should maintain focus on the S&P 500 for broad market signals. The cup-with-handle is a bullish continuation pattern, but I would re-evaluate if SPY breaks short-term support and reverses its upswing.
Big Wedge and Little Wedge in XLF
The Financials SPDR (XLF) bounced on Thursday as the 20+ YR T-Bond ETF (TLT) fell and the 10-yr T-Yield ($TNX) rose. Keep this relationship in mind: XLF is negatively correlated to TLT and positively correlated to $TNX.
The red lines on the chart mark a large falling wedge or channel that looks like a big flag. Notice that XLF surged 28% prior to this correction. A big surge deserves a big correction. In other words, this could be just a big bullish continuation pattern and a breakout at 29.5 would confirm the pattern.
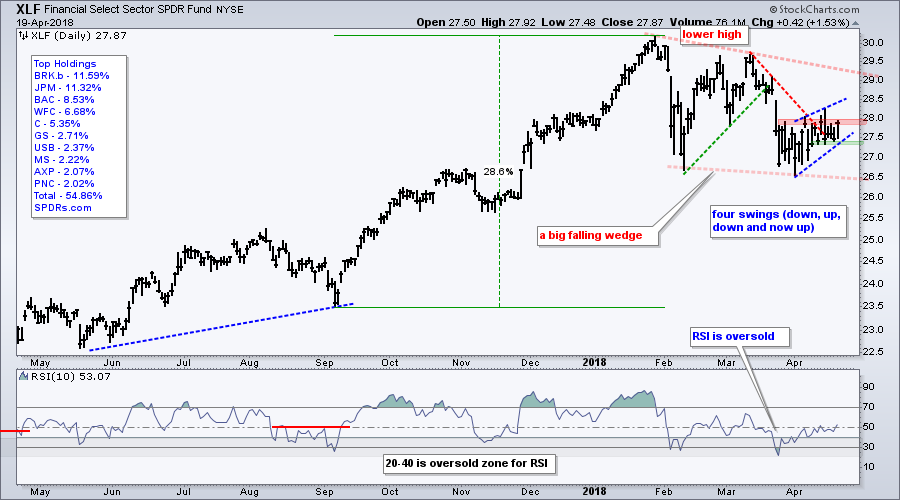
As with SPY, I am watching the swings within the pattern for the early jump. It looks like the downswing reversed with the bounce over the last two weeks. There is a chance, however, that this bounce is a rising flag or wedg, which is a bearish continuation pattern. The short-term trend is up as long as the wedge rises. A break below wedge support would reverse the upswing.
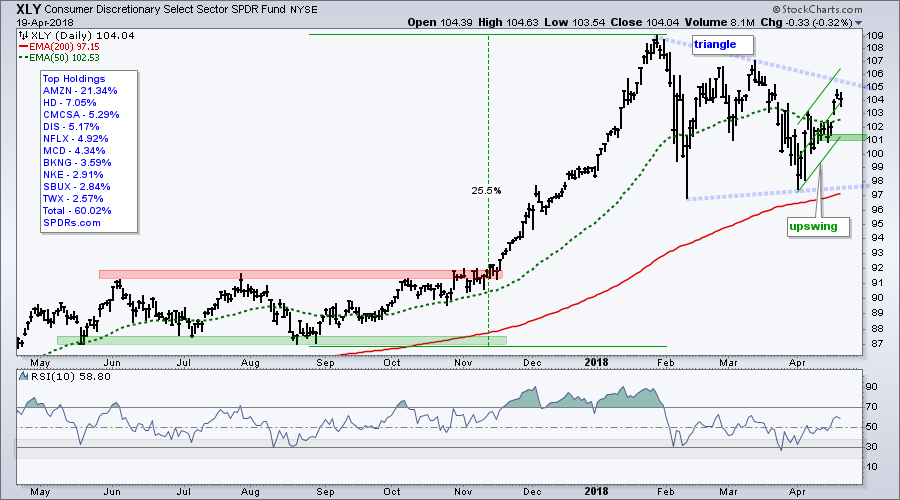
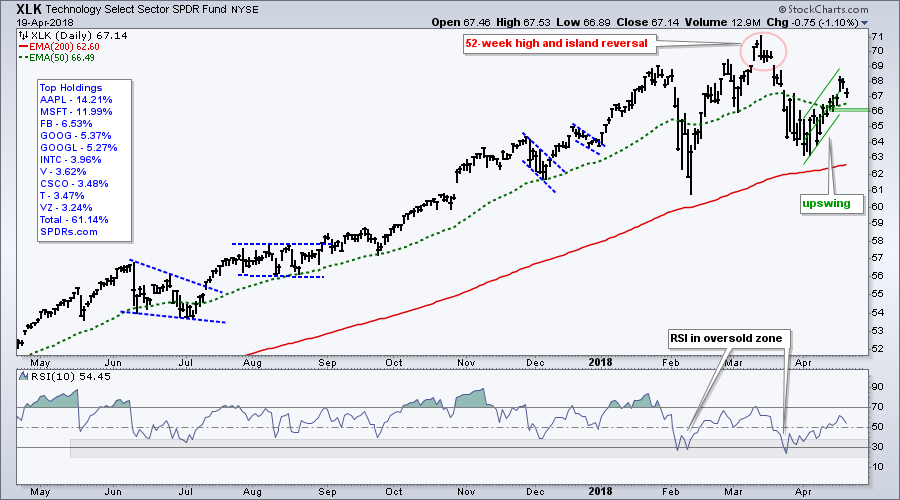
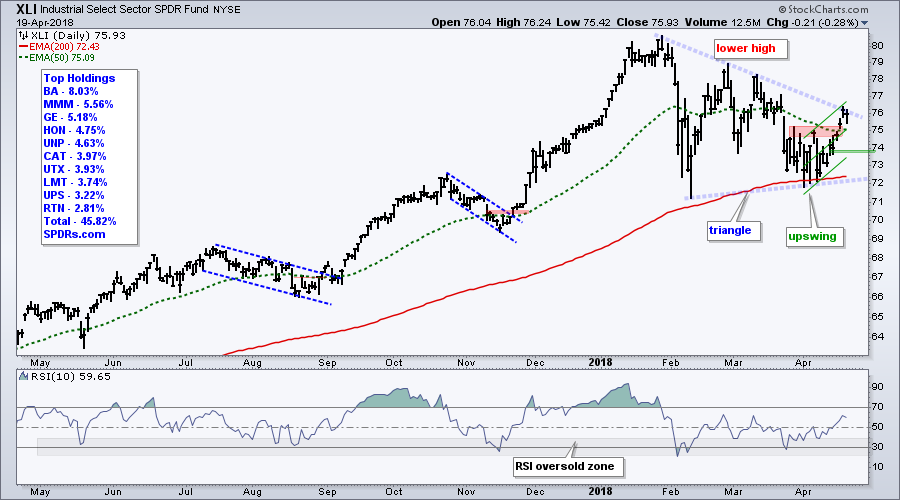
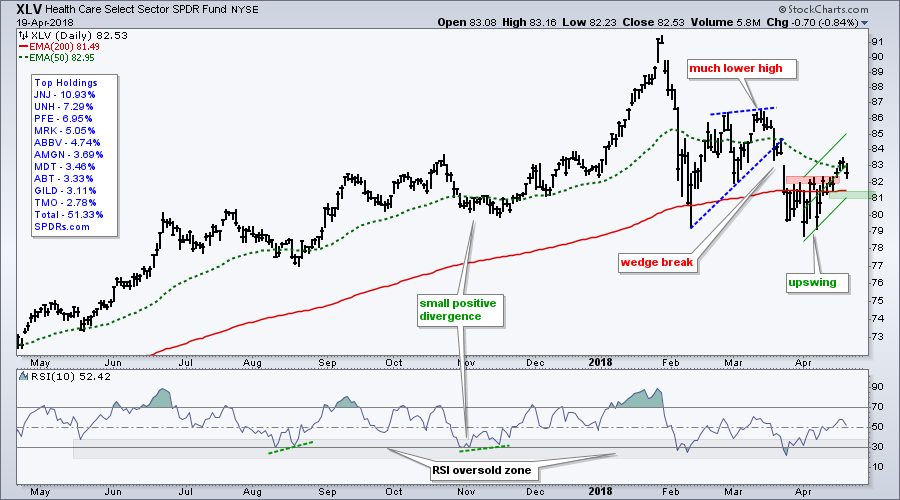
XLY, XLK and XLI Lead the Big Sectors
The next four charts show the other big sector SPDRs. Together with the Financials SPDR, these five account for around 75% of the SPY. These charts are shown with the 50-day EMAs and 200-day EMAs, but I do not use moving averages to mark support or resistance. Instead, I use these moving averages to compare performance.
XLY, XLK and XLI are above their 50-day EMAs and leading. XLF and XLV are below their 50-day EMAs and lagging. XLV was the only one to close below the 200-day EMA in late March and early April, and it is the weakest of the five. Note that the 50-day EMA is above the 200-day EMA for all five and all five recorded new highs in January. XLK also recorded a new high in March and this makes it the leader overall.
As with SPY and XLF, my focus is on the current upswing that began in early April. The Raff Regression Channels and the green zones define these upswings. The broader market is in good shape as long as at least three of the five hold their upswings. Breakdowns by three of the five would be bearish for the broader market.
SOXX Fails to Hold Breakout
The Semiconductor iShares (SOXX) took a hard hit on Thursday with a gap down and 4+ percent decline. This is enough to derail last week's breakout and reverse the short-term uptrend, but the long-term trend remains up.
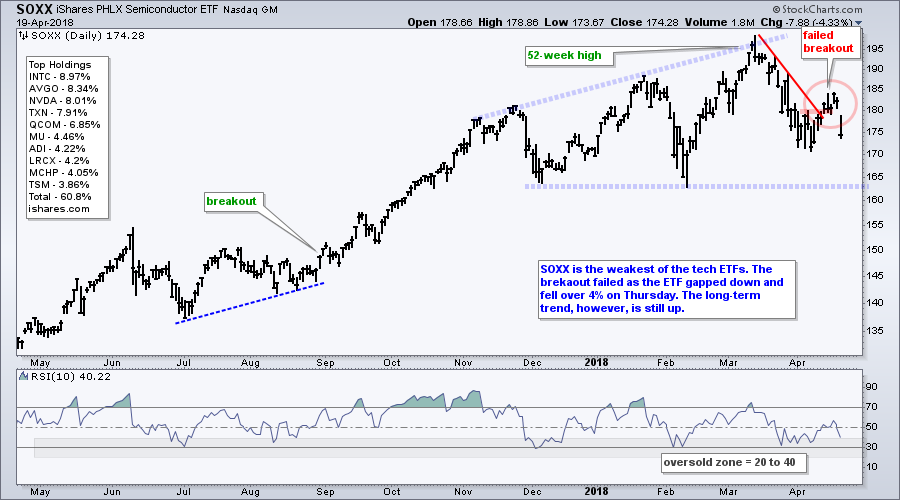
The blue lines show a rather strange pattern taking shape with higher highs and equal lows since December. The higher highs reflect a long-term uptrend, but the equal lows show strong selling pressure after each high. Thursday's gap-decline suggests that SOXX could test the December-February lows again.
As you can see in the Art's Charts ChartList, the other tech-related ETFs are holding their breakouts and remain in short-term uptrends. The ChartList shows SKYY, FDN, IGN and IGV with upswings defined by the Raff Regression Channel. HACK is leading because it hit a new high this week.
The failed breakout in SOXX is negative for tech, but the other tech-related ETFs are holding up and this means the tech sector is still net bullish.
Notes from the Art's Charts ChartList
Note that I covered the Financials SPDR (XLF), Regional Bank SPDR (KRE), the 10-yr T-Yield ($UST10Y), the yield curve, the 7-10 YR T-Bond ETF (IEF), copper and gold in Thursday's commentary. I covered the Retail SPDR (XRT), iShares Aerospace & Defense ETF (ITA), Medical Devices ETF (IHI) and HealthCare Providers ETF (IHF) in Tuesday's commentary.
- The Retail SPDR (XRT) stalled out this week and could be forming a lower high (and a possible descending triangle).
- The Semiconductor iShares (SOXX) is lagging with a failed breakout, gap and sharp decline.
- The Cyber Security ETF (HACK) is leading the tech sector with a new high this week.
- The Broker-Dealer iShares (IAI) continues to edge higher and make good on the short-term breakout. The long-term trend is also up.
- The Regional Bank SPDR (KRE) remains in a long-term uptrend and the ETF bounced on Thursday to keep the rising flag rising. â¨The iShares Aerospace & Defense ETF (ITA) is leading with a new high this week. â¨The Copper Miners ETF (COPX) got a big bounce on Tuesday and is on the verge of breaking a triangle line.
- The Gold Miners ETF (GDX) moved to the middle of a 15 month trading range.
- The Metals & Mining SPDR (XME) led the market this week and broke out of a large falling wedge.
- The Steel ETF bounced off the rising 200-day and broken resistance with a short-term breakout in early April.
- Click here to see 30 annotated charts with comments.
Plan Your Trade and Trade Your Plan.
- Arthur Hill, CMT
Senior Technical Analyst, StockCharts.com
Book: Define the Trend and Trade the Trend
Twitter: Follow @ArthurHill


