- Small-caps Rise as Large-caps Grind.
- Cup-with-handle Evolves in IJR.
- Three Leading Small-Cap Sectors.
- XRT Holds Breakout.
- Providers and Devices Lead Healthcare.
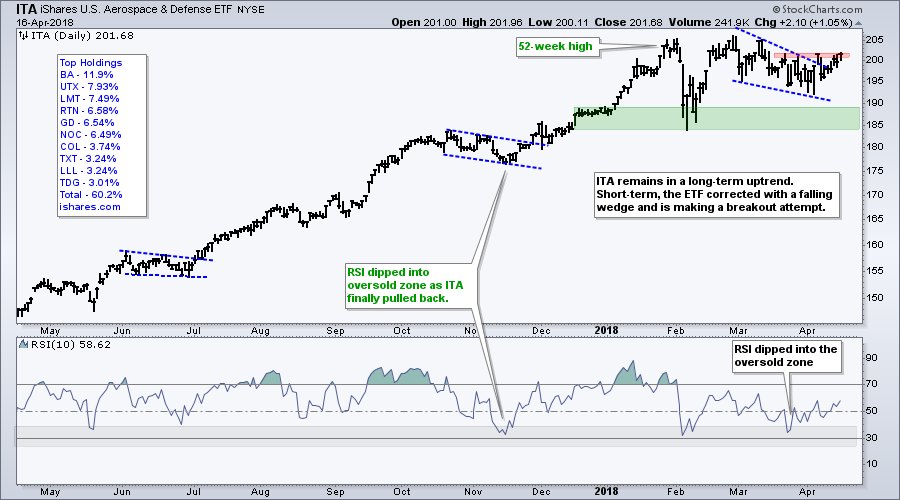
- ITA Edges Above Short-term Resistance.
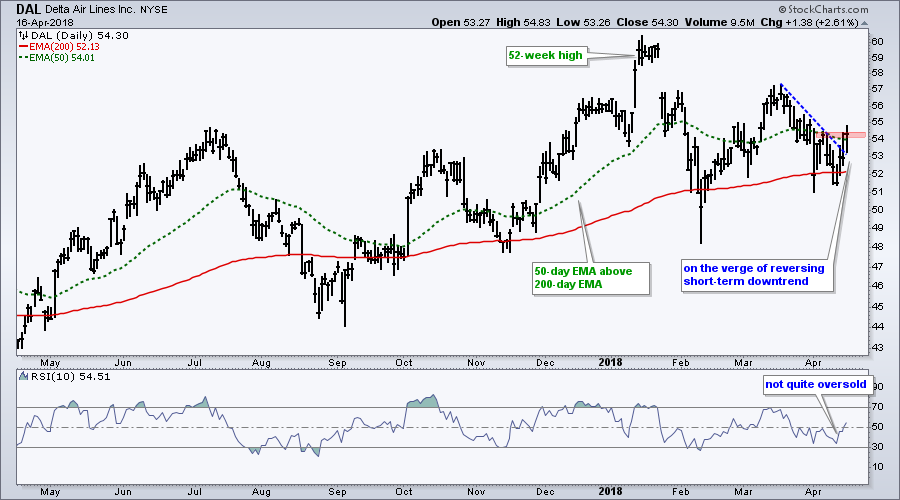
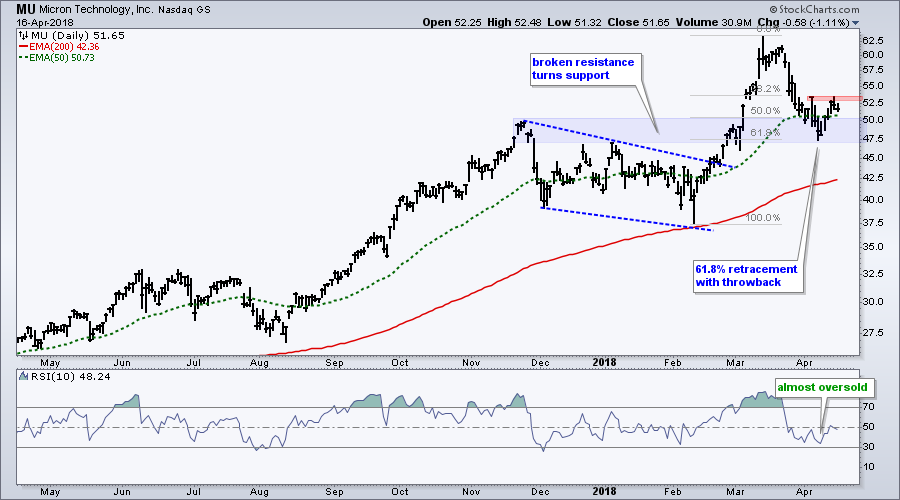
- Delta and Micron Correct within Uptrends.
 Small-caps Rise as Large-caps Grind...
After a fairly dismal March, stocks moved higher this month with small-caps leading the way. The S&P 500 SPDR (SPY) is up around 1.6% this month, while the S&P SmallCap iShares (IJR) is up 2.74% and easily outperforming.
The Financials SPDR (XLF) and the Industrials SPDR (XLI) are weighing on large-caps, while the SmallCap Consumer Discretionary ETF (PSCD), SmallCap HealthCare ETF (PSCH) and SmallCap Industrials ETF (PSCI) are leading small-caps. More on these three a little later.
Let's first look at the swings in SPY. The chart below shows SPY and the E-mini with three swings since the January high (down, up, down). Actually, it looks like a new upswing started the last two weeks as SPY troughed on April 2nd. In addition, the ETF closed above short-term resistance on Monday, as did the E-mini.
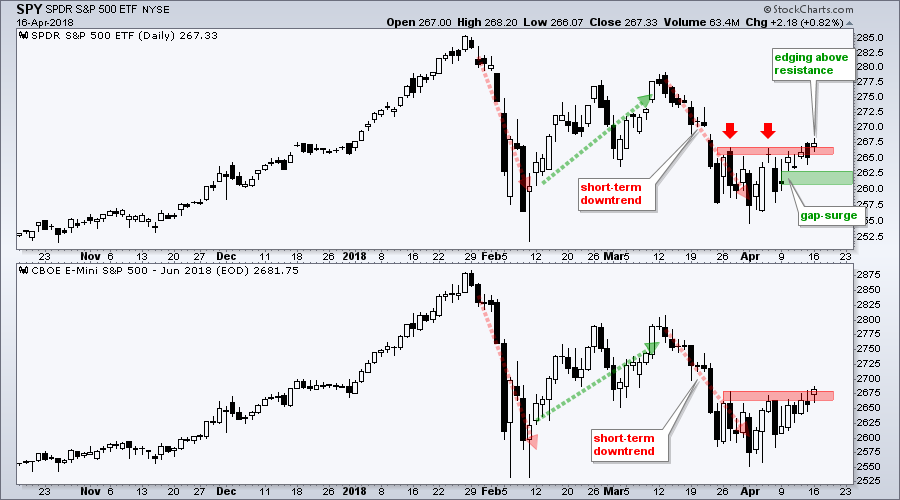
The bulls have the short-term edge and I am watching last week's gap-surge to define this advance. The green zone marks the gap-surge on April 10th. A close below 261 would negate the breakout, fill the gap and reverse the short-term upswing.
Cup-with-handle Evolves in IJR
The next chart shows the S&P SmallCap iShares (IJR) with a cup-with-handle brewing (green lines). This is a bullish continuation pattern that was popularized by William O'Neil of IBD. O'Neil, by the way, received the Annual Service award from the CMT Association last week.
IJR reversed the downswing from 80 to 75 with a breakout last week and this argues for a continuation of the February-March surge. The handle of the cup-with-handle pattern would complete if IJR reaches 80 and the pattern would be confirmed with a breakout to new highs.
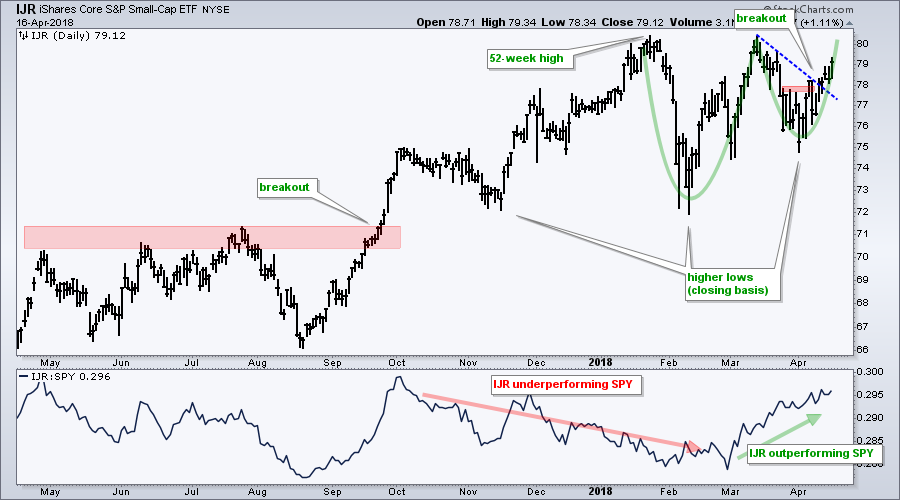
Frankly speaking, this cup-with-handle is not that important at this point. The trend is already up and there is already a short-term breakout. A new high, therefore, is expected because a trend in motion stays in motion.
IJR is leading because it challenged its January high in mid March and held well above the February low in late March. SPY, in contrast, did not challenge its January high and fell all the way back to its February low. Also notice that the IJR:SPY ratio (lower window) has been rising since late February.
Three Leading Small-Cap Sectors
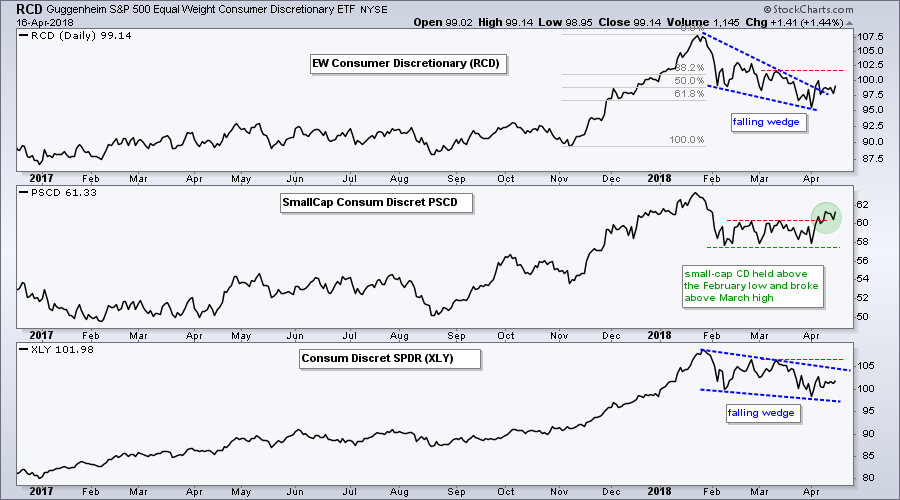
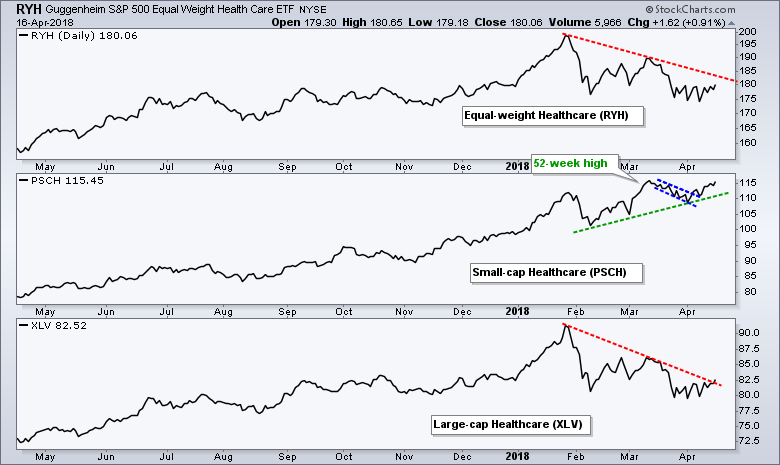
The next charts show one sector with three styles: equal-weight, small-cap and large-cap (SPDR). We can use these to compare performance and identify the leaders.
The first chart shows the consumer discretionary sectors. The equal-weight sector (RCD) is attempting to reverse near the 61.8% retracement and break the wedge formation. The small-cap sector (PSCD) held the February low and broke above the March high (red line). This is the leader. The large-cap sector (XLY) remains within a falling wedge and below the March high (red line).
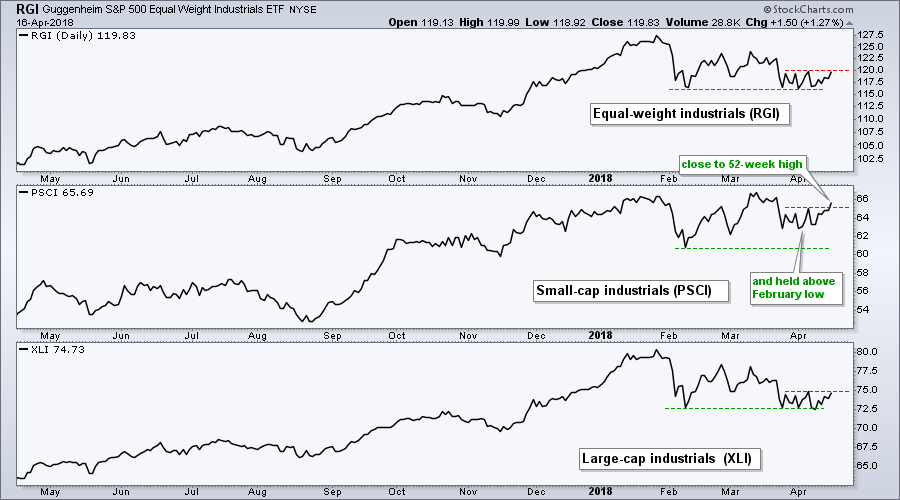
The second chart shows the industrial sectors. The equal-weight (RGI) and large-cap (XLY) sectors have yet to break short-term resistance (red lines). Meanwhile the small-cap sector (PSCI) broke above the early April high and is near a 52-week high. PSCI also formed a higher low from February to April and is leading.
The third chart shows the healthcare sectors. The equal-weight (RYH) and large-cap (XLV) sectors formed lower highs from January to March (red lines). The small-cap sector (PSCH) formed a higher high and hit a 52-week high. PSCH also broke out of a falling flag last week and small-cap healthcare is leading.
XRT Holds Breakout
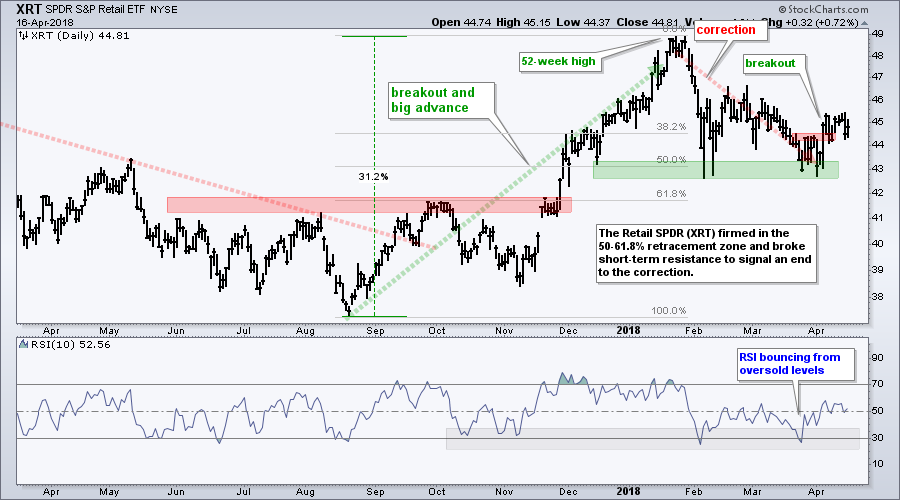
The Retail SPDR (XRT) is an important part of the consumer discretionary sector and I suspect that many of its components are small-caps. The chart below shows XRT surging to a new high in January and then correcting with a 50-61.8% retracement. The ETF tested the 43 area twice and broke above short-term resistance in early April. I think this signals an end to the correction and a resumption of the bigger uptrend.
Providers and Devices Lead Healthcare
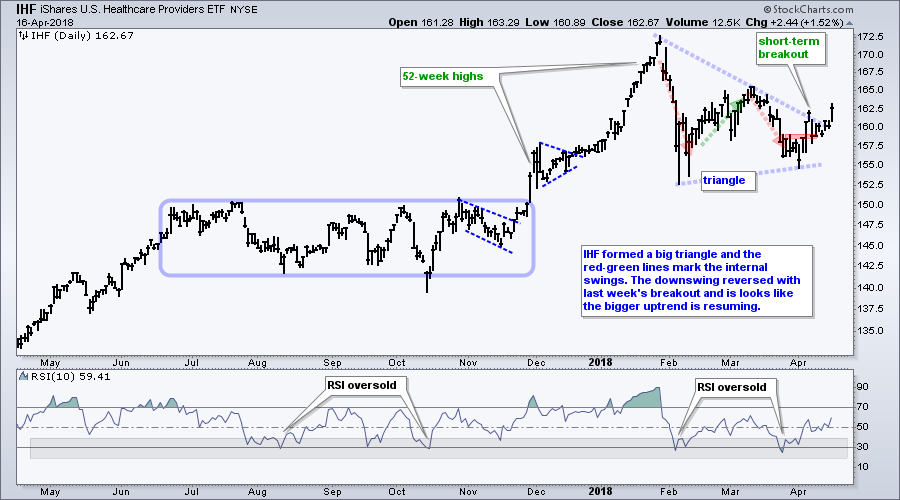
The HealthCare Providers ETF (IHF) and Medical Devices ETF (IHI) are showing strength with short-term breakouts. The first chart shows IHF surging to a new high in January and then moving into a consolidation (triangle). The red and green arrow-lines mark the downswings and upswings. It looks like the downswing reversed with the early April breakout and the ETF is trading above the triangle line. This suggests that the consolidation is ending and the bigger uptrend is resuming.
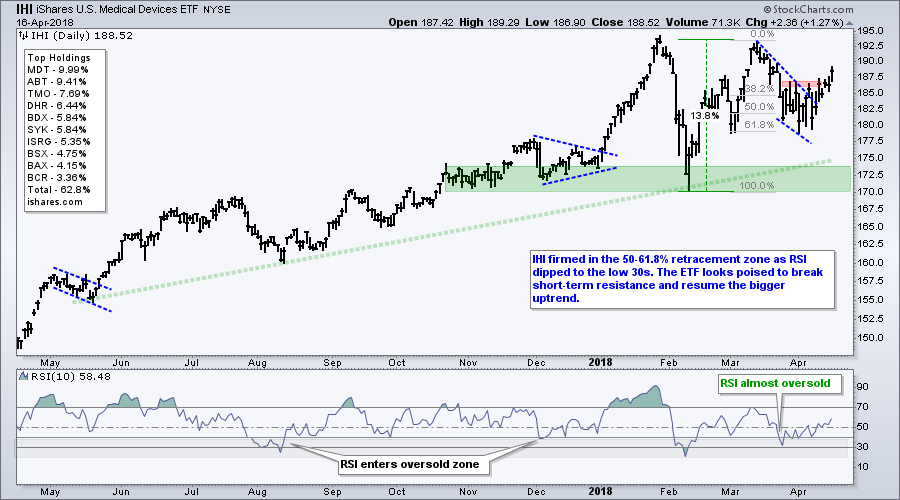
The second chart shows IHI challenging its January high with a surge into March and then falling back. A falling wedge formed and this wedge retraced around 61.8% of the prior advance. Both the pattern (wedge) and retracement (~61.8%) are normal for corrections. The ETF broke short-term resistance on Monday and looks poised to challenge the prior highs.
ITA Edges Above Short-term Resistance
The iShares Aerospace & Defense ETF (ITA) remains one of the stronger groups overall. The ETF hit a new high in January, challenged this high in late February and held well above the February low. A falling wedge formed as ITA backed off the recent high and the ETF is challenging the red resistance zone. Given the bigger uptrend and relative chart strength, I would expect a new high in the coming days and weeks.
Delta and Micron Correct within Uptrends
Delta Airlines (DAL) is in a long-term uptrend and poised to reverse its short-term downtrend. The stock hit a 52-week high in January and the 50-day EMA is above the 200-day EMA (long-term uptrend). DAL fell back to the rising 200-day EMA and found support in the 51-52 area over the last 2-3 weeks. With a three day surge, the stock looks poised to break short-term resistance.
Micron Technology (MU) bounces off reversal zone. The next chart shows MU hitting a 52-week high in March and then falling back to broken resistance, which turns into support. This throwback also retraced 61.8% of the prior advance. The blue shading marks an reversal area and a break above the early April high would be bullish.
These stocks have bullish looking charts, but report earnings in the next week or two. CL, CHD, CSX, DHR, KLAC, UHS, V and WDC
Plan Your Trade and Trade Your Plan.
- Arthur Hill, CMT
Senior Technical Analyst, StockCharts.com
Book: Define the Trend and Trade the Trend
Twitter: Follow @ArthurHill


