- SPY Pulls Back within Channel.
- Monitoring Upswings in the Big Sectors.
- Regional Bank ETF Extends Short-term Bounce.
- Smelly SOXX.
- Google Holds the Gap.
- Nike Forms Flag within Triangle.
 SPY Pulls Back within Channel...
There are three stages to a trend reversal. First, there is the bottom picking stage when momentum oscillators become oversold and/or prices start to firm. Second, there is the breakout stage when prices exceed some sort of resistance level and turn up. Third, there is the monitoring stage when prices are moving higher and we are monitoring the upswing.
I think we are in the monitoring stage of a short-term upswing that started in early April. Some of these short-term uptrends are part of a bigger uptrend(XLK) and some represent an upswing within a bigger pattern, such as a triangle (SPY) or falling channel/wedge (GOOGL). These upswings are the first start to ending this year’s correction and I am monitoring them quite closely.
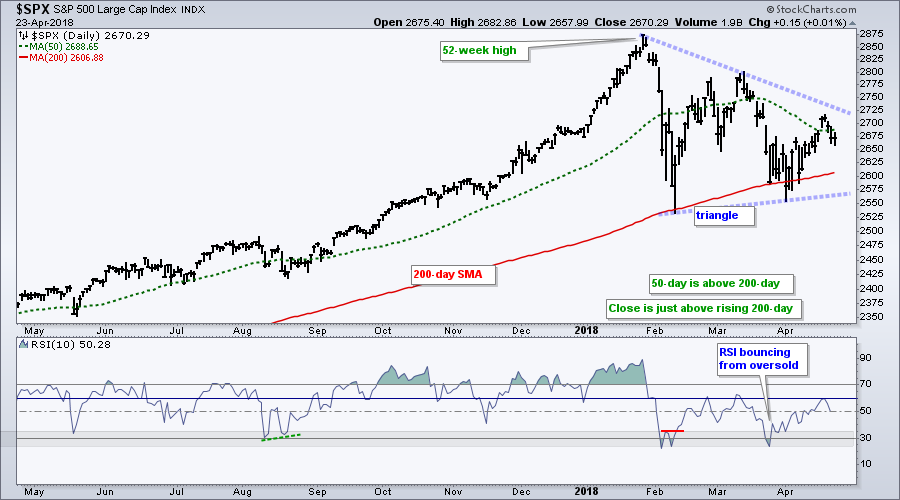
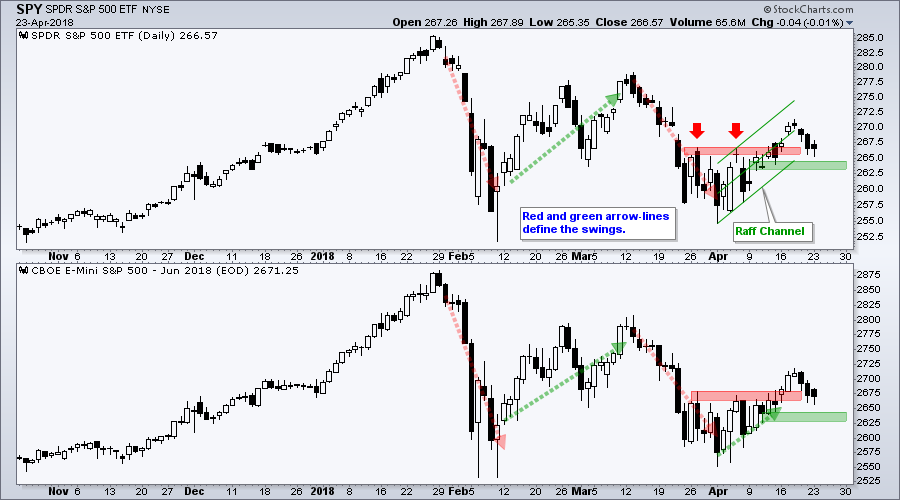
The chart below shows the S&P 500 SPDR (SPY) and the E-mini with upswings the last three weeks. Both are trading within a bigger triangle formation and these upswings open the door to a bigger resistance challenge should they extend. The Raff Regression Channel and lows on April 10/11 mark upswing support in the 263-265 area. A close below 263 would reverse this upswing and I would turn short-term bearish on stocks.
The S&P 500 and SPY are very important because they set the tone for the broader market. SPY pulled back over the last three days and this is normal price action after 4% advance (9 to 18 April). In fact, this three day pullback could be an opportunity because it represents a dip within the upswing.
Monitoring Upswings in the Big Sectors
I also remain focused on the upswings in the five big sector SPDRs: XLK, XLF, XLY, XLI and XLV. Together, these five sector SPDRs account for around 75% of the stock market.
The Technology SPDR (XLK) was hit hard with weakness in semiconductors, Apple and Apple suppliers over the last few days. Nevertheless, the big trend is up with a 52-week high in mid March and the short-term trend is up since early April.
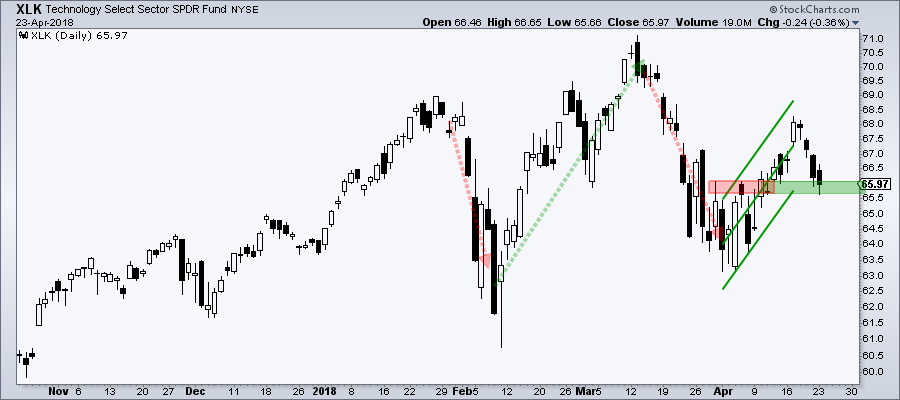
With the decline over the last four days, the ETF is short-term oversold and near support in the 65.5-66 area, which could give way to a bounce. I am using the lower line of the Raff Regression Channel and broken resistance to mark support here. A close below 65.5 would reverse this upswing.
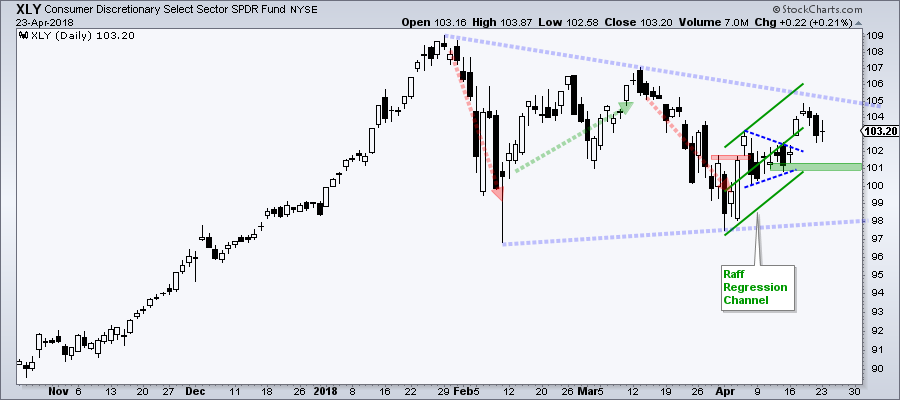
The next chart shows the Consumer Discretionary SPDR (XLY) with four swings within a big triangle. The current swing is up with the mid April lows and Raff Regression Channel marking support in the 101 area.
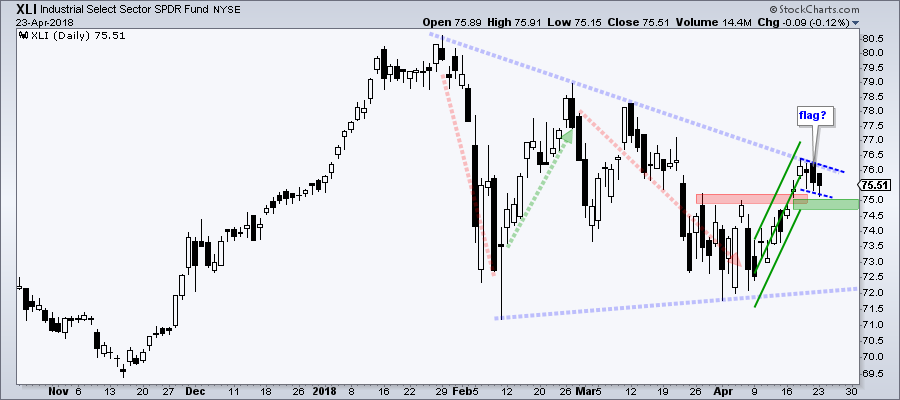
The next chart shows the Industrials SPDR (XLI) also with a large triangle and an upswing since early April. Keep in mind that this triangle is forming after a 52-week high and represents a big bullish continuation pattern. XLI pulled back the last three days with a small flag of sorts and a breakout could signal a continuation of the mid April advance.
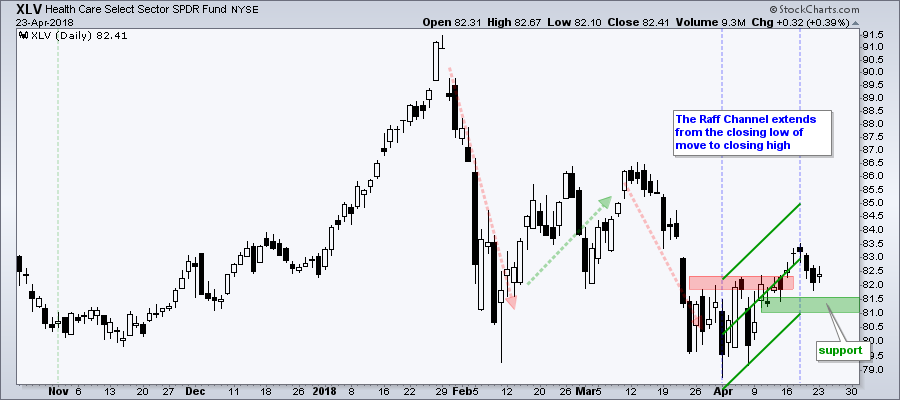
The next chart shows the Health Care SPDR (XLV) with a choppy base from March 26th to April 11th and a breakout last week. The ETF pulled back to the breakout zone on Friday and firmed on Monday with an inside day. Overall, the breakout is still holding and I am marking upswing support in the 81-81.5 area.
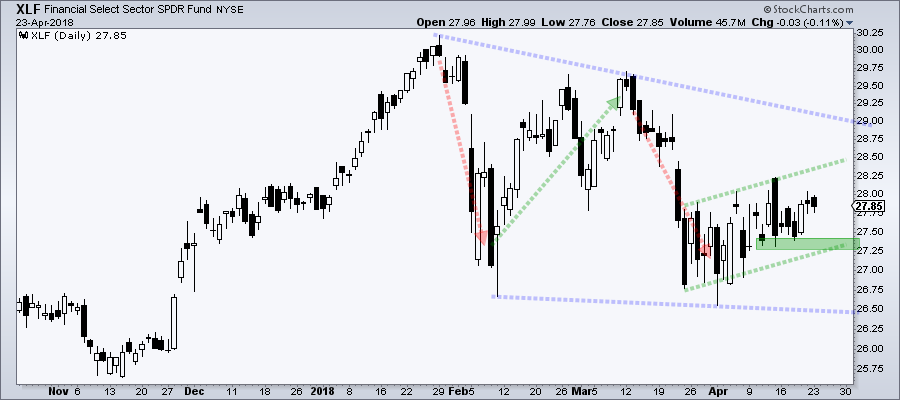
The next chart shows the Financials SPDR (XLF) turning up over the last few weeks, but struggling. A Raff Regression Channel does not fit well, and it is hard to draw a lower trend line without cutting through prices. There is, however, a clear upward drift since late March and clear support in the 27.25-27.50 area. The short-term trend is clearly up as long as XLF holds 27.25 on a closing basis.
The sum is only as strong as the sum of the parts. SPY represents the sum and the five sectors represent the parts. All five are in short-term uptrends and this supports the upswing in SPY. Overall, SPY is in good shape as long as three of the five hold their short-term uptrends.
Regional Bank ETF Extends Short-term Bounce
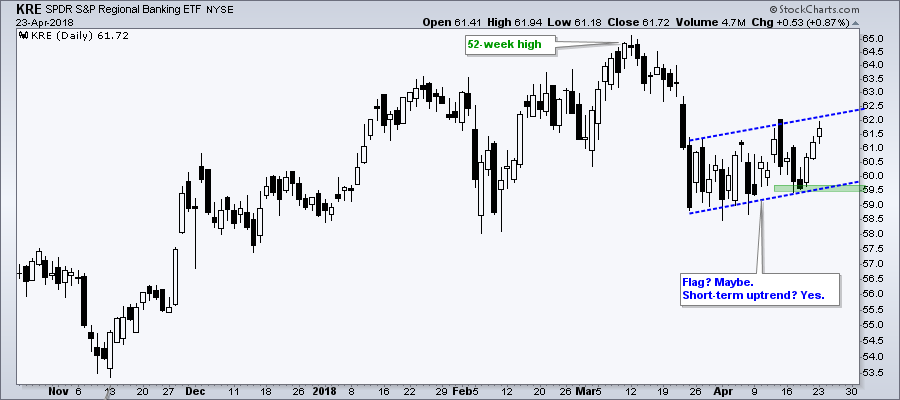
The next chart shows the Regional Bank SPDR (KRE) hitting a 52-week high in March and holding above its February low in early April. The big trend is up. Short-term, the ETF has been working its way higher with a rising channel. It could turn into a bearish flag, but the flag is currently rising and the short-term trend is up. Given the bigger uptrend, I would expect a challenge to the March high. The mid April low and flag line mark support in the 59.5 area.
Smelly SOXX
The Technology SPDR fell back over the last four days because the Semiconductor iShares (SOXX) fell 7.63%. SOXX is also down 5.62% in April, but the other five tech-related ETFs are up in April. Thus, weakness in technology has been largely confined to semiconductors.

The PerfChart above shows the Cloud Computing ETF (SKYY), Internet ETF (FDN), Software iShares (IGV), Networking iShares (IGN) and Cyber Security ETF (HACK) with gains this month. The chart below was first shown on April 13th as all six tech-related ETFs broke out in unison. SOXX is the only one not holding its breakout so I would still consider the tech sector net bullish.
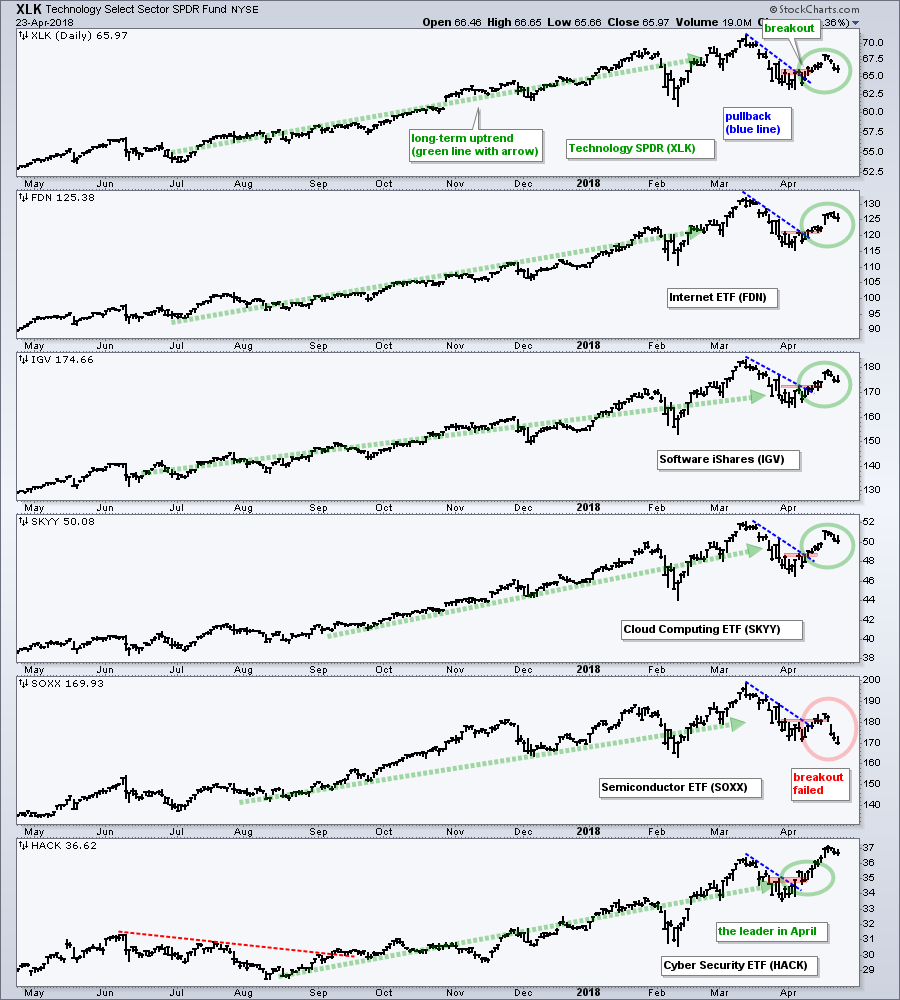
Note that you can see individual charts for these ETFs in the Art's Charts ChartList. These charts use the Raff Regression Channel to define the short-term upswings and mark first support.
Google Holds the Gap
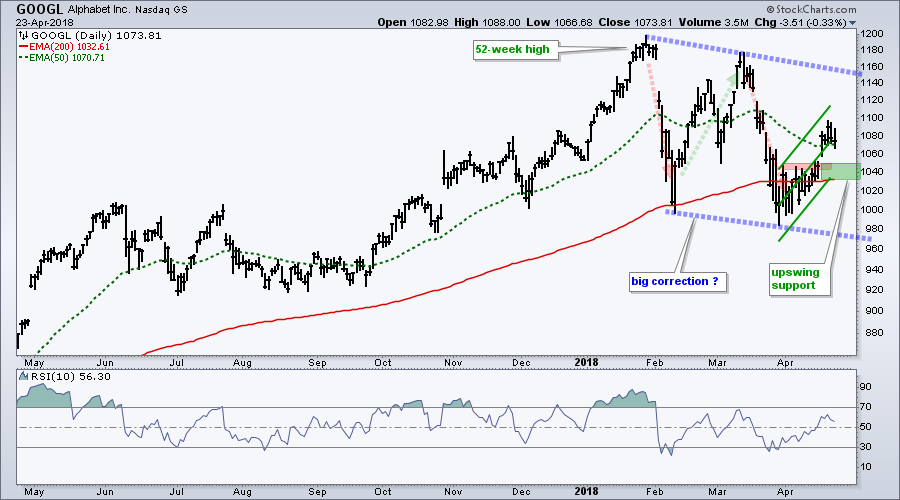
The chart for Google shows a long-term uptrend, a big correction and a short-term upswing. First, the long-term trend is up because the stock hit a 52-week high in January and the 50-day EMA is above the 200-day EMA. The decline from late January to early April formed a large falling channel and this could be just a massive correction (like a falling flag). Within this channel, GOOGL reversed the short-term downswing with a gap and breakout last week. The gap zone and Raff Regression Channel mark upswing support in the 1030-1050 area.
Nike Forms Flag within Triangle
The Nike chart shows another example of a pattern within a pattern. The big pattern is a symmetrical triangle after a breakout and a 52-week high. The bigger uptrend means this is a bullish continuation pattern and an upside breakout is expected.
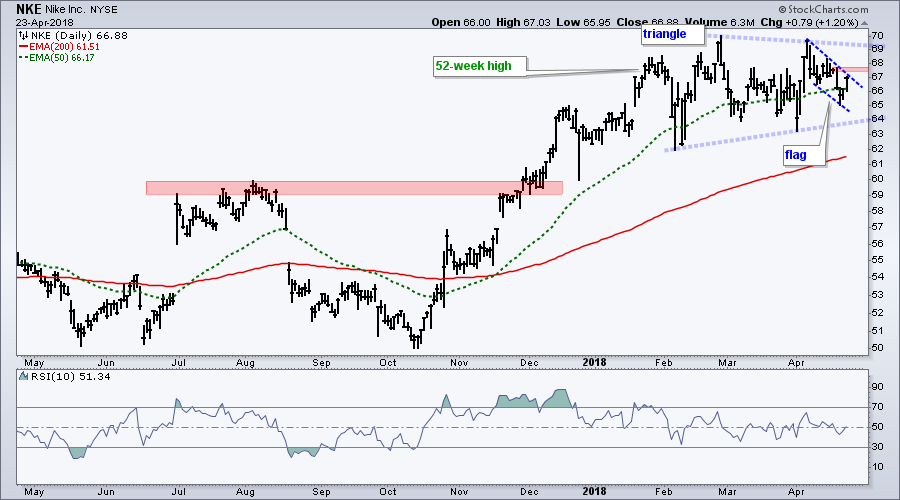
The smaller pattern is a falling flag after the early April surge. Chartists interested in getting a jump on the bigger pattern can play the swings within the triangle. The flag is currently falling and a breakout at 67.8 would reverse this fall.
Plan Your Trade and Trade Your Plan.
- Arthur Hill, CMT
Senior Technical Analyst, StockCharts.com
Book: Define the Trend and Trade the Trend
Twitter: Follow @ArthurHill


