- Three Strikes and your Out - But Not Yet.
- SPY Attempts to Reverse Downswing.
- IJR Leading in April.
- QQQ Springs to Life.
- High-Low Lines Turn Up.
- Tech-Related ETFs Break Out in Unison.
- XBI, SLX and the Problem with Reversal Patterns.
- Bear Market Bounce for Bonds, Utes and REITs.
- Gold Stays Stuck in Channel.
- Notes from the Art's Charts ChartList.
 Three Strikes and your Out - But Not Yet ...
Another week is passing and the S&P 500 remains stuck in a three week consolidation and just above the 200-day moving average. I posted a System Trader article on Thursday with a 25-year test of the 200-day SMA. I also showed that smoothing the trigger can reduce whipsaws and improve returns.
This testing used simple moving averages, but today I am going to show a chart with three exponential moving average pairs. Note that the backtest results were similar when testing EMAs and SMAs. Both have their advantages and disadvantages. I am using EMAs on this chart because the Percentage Price Oscillator (PPO) uses EMAs and I like the histogram view of the PPO.
The chart below shows the S&P 500 with the 50-day SMA and 200-day SMA in the main window for reference. The indicator windows show the PPO(5,200,0), the PPO(25,200,0) and the PPO(50,200,0). Note that the PPO is positive when the shorter EMA is above the longer EMA. I am using the 200-day EMA as the long-term EMA and then three different shorter EMAs as the triggers.
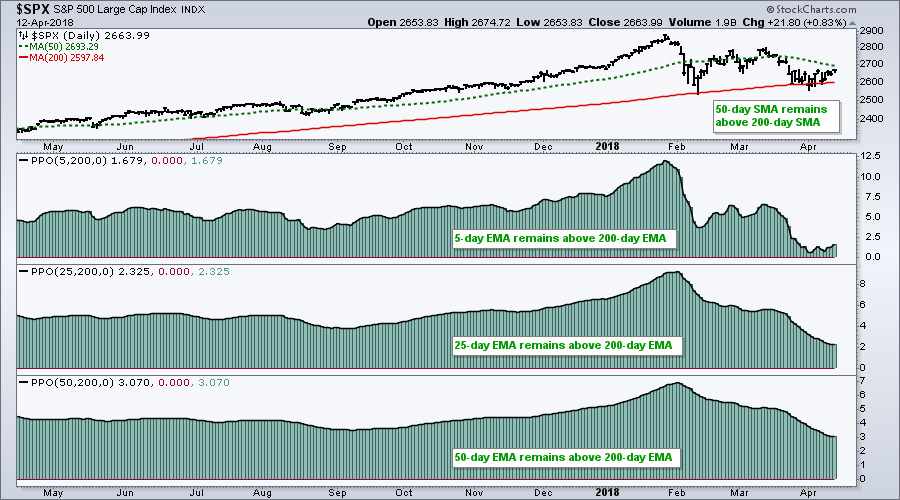
As you can see from the chart, all shorter EMAs are above the longer EMA. Using a baseball metaphor, the (bad news) bears have yet get a strike on the bulls. The first strike would be if the PPO(5,200,0) turns negative and three strikes would mean all three turned negative. Three strikes and the bulls are out.
Until the bears throw a strike or two or three, the S&P 500 remains in a long-term uptrend. This suggests that the February decline and test of the February low are part of a correction within that uptrend.
SPY Attempts to Reverse Downswing
The next chart shows the S&P 500 SPDR (SPY) and the E-mini with three swings in the last three months. The current swing is down, but SPY managed to trough on April 2nd and edge higher the last eight days.
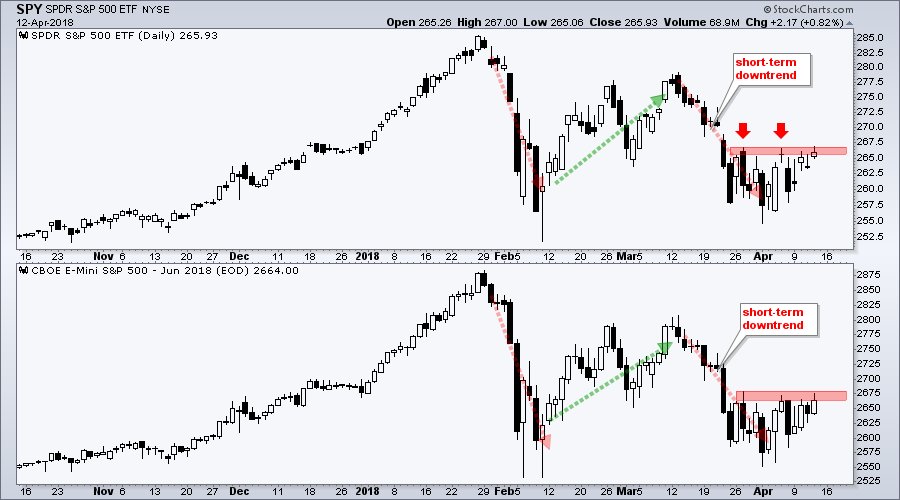
Head-and-shoulders fanatics will likely see a bottoming pattern from March 23rd to now with the red zone marking neckline resistance. Regardless of the pattern, resistance in the 266-267 area is clear and a breakout is needed to reverse the downswing that began in mid-March.
IJR Leading in April
The next chart shows the S&P SmallCap iShares (IJR) breaking above short-term resistance around 78 and reversing the downswing from mid March to early April. With this breakout, it looks like IJR is poised to test the January-March highs. The green parabolas mark a possible cup-with-handle and this is bullish continuation pattern further reinforces the chart.

QQQ Springs to Life
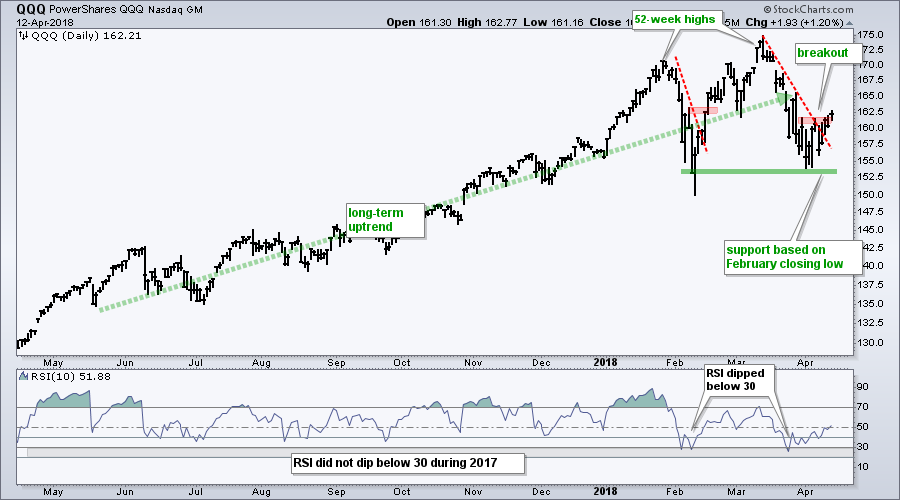
The Nasdaq 100 ETF (QQQ) regained its leadership role with a breakout on Thursday. Notice that QQQ closed above the highs from late March and early April. SPY, on the other hand, did not. This upturn means QQQ reversed the downswing from mid March to early April. Also notice that RSI bounced from oversold territory (<30) the last two weeks.
High-Low Lines Turn Up
The next chart shows the High-Low Lines for the S&P 500, S&P Mid-Cap 400, S&P Small-Cap 600 and Nasdaq 100. The High-Low Lines are in black and the 10-day EMA is in magenta. A move above the 10-day EMA means the High-Low Line turned up.
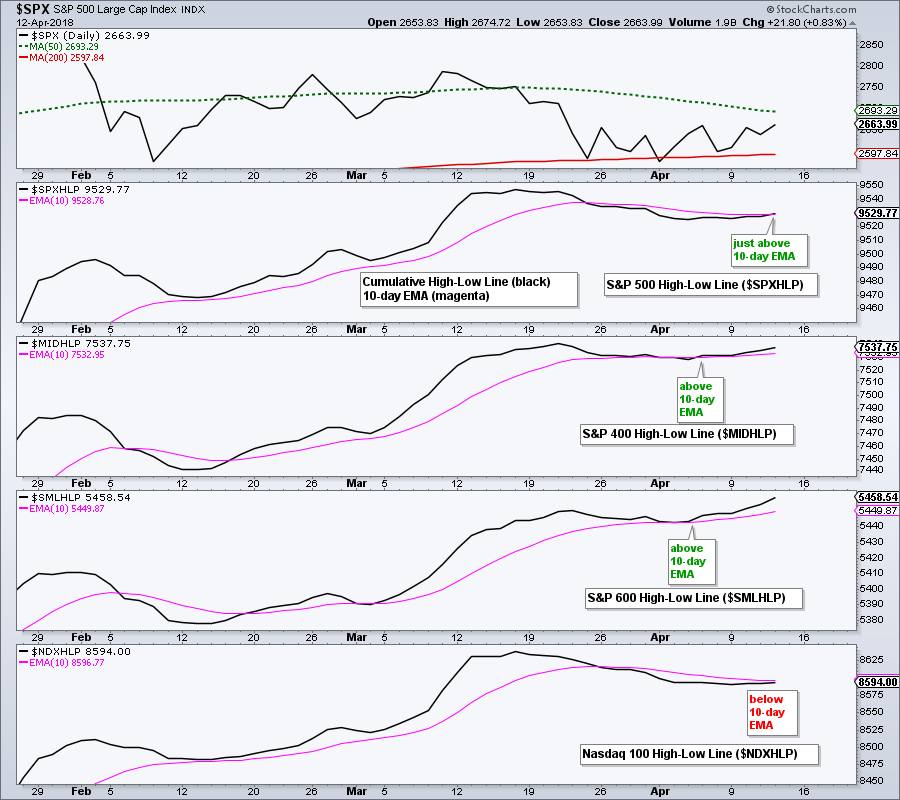
Notice that the High-Low Lines for the S&P Small-Cap 600 and S&P Mid-Cap 400 crossed above their 10-day EMAs on April 4th and 5th, respectively. The S&P 500 High-Low Line crossed above is 10-day EMA on Thursday and this means new highs are starting to expand again for large-caps. The Nasdaq High-Low Line remains the laggard because it has yet to turn up.
Tech-Related ETFs Break Out in Unison
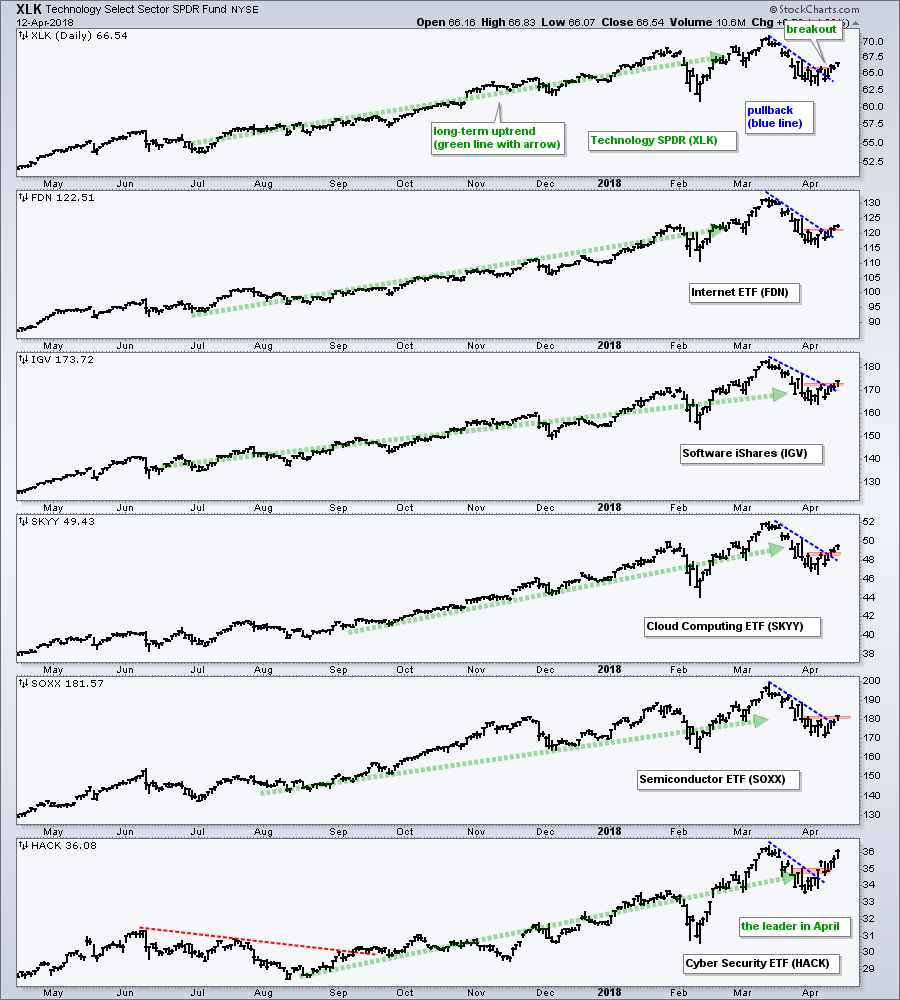
The next chart shows the Technology SPDR (XLK) with five tech-related ETFs. The annotations on XLK apply to the other five ETFs. The fat green line with the arrow denotes the long-term trend, which is up. The blue line from mid March to early April marks the pullback. The red zone marks resistance from the late March and early April highs.
XLK and the other five broke short-term resistance and reversed their short-term downtrends. Note that these downtrends are deemed corrections within a long-term uptrend so its looks like the bigger uptrend is resuming with the breakouts. With XLK accounting for some 25% of the S&P 500, this should be positive for the broader market.
XBI, SLX and the Problem with Reversal Patterns
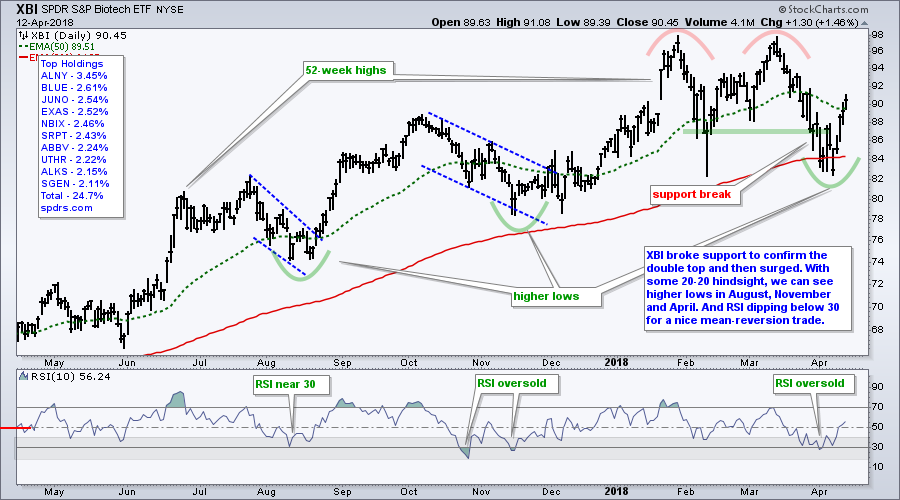
And now for a rant on chart patterns and visual assessments. The Biotech SPDR (XBI) and the Steel ETF (SLX) shows examples of double tops that were confirmed with a break below the intermittent low. These breaks, however, did not last long as both bounced back the last week or so.
A double top is a bearish reversal pattern that forms in an uptrend. It has to form in an uptrend because a bearish reversal pattern needs an uptrend to reverse. The two highs mark resistance, the intermittent low marks support and the pattern is confirmed with a break below support.
I ventured to the dark side a few years ago and started using a systematic approach to chart analysis. This means trends quantified and patterns are not part of that process. XBI clearly formed a double top, but we can also see a series of higher highs and higher lows over the past year. We can also see that the 50-day EMA is well above the 200-day EMA. Thus, there is still evidence for an uptrend.
When it comes to short-term signals, I prefer mean-reversion to breakouts. Breakouts certainly "look" good on the chart, but they are hard to quantify and put in a trading system.
A mean-reversion approach relies on an oversold reading, such as RSI(10) below 30. A subsequent move above 30 signals an end to oversold conditions and a possible upturn. This is easy to quantify and put into a system.
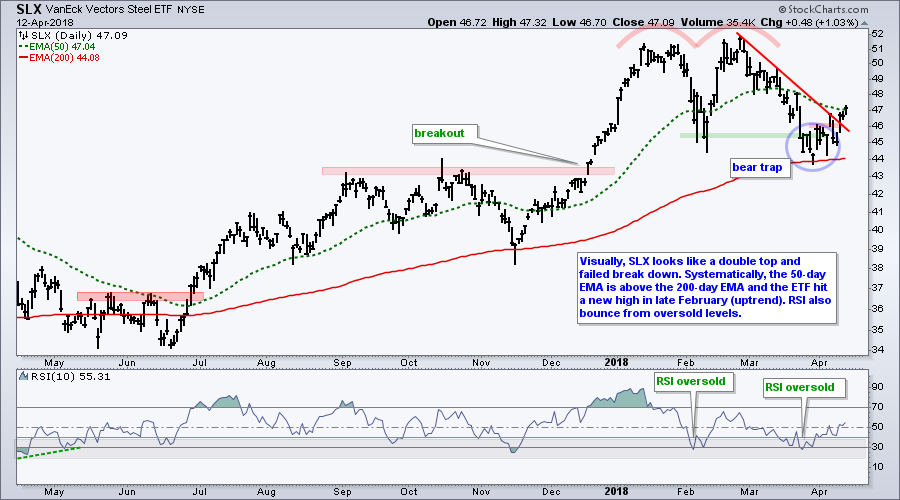
The charts for XBI and SLX show RSI dipping below 30 when the 50-day EMA is above the 200-day EMA. This is a classic oversold reading in a long-term uptrend - and it is fully quantifiable. This is certainly not a foolproof setup, but it would have worked better than selling or selling short on the double top break.
It is very important to be picky when it comes to chart patterns. Be very wary of reversal patterns because trends continue more often than they reverse. This is why I prefer to focus more on continuation patterns, such as flags, wedges and triangles.
Bear Market Bounce for Bonds, Utes and REITs
The 7-10 YR T-Bond ETF (IEF), Utilities SPDR (XLU) and REIT iShares (IYR) bounced from February to April, but I think these are bear market bounces. In other words, I think the bigger trend is down and the advance was a correction after a sharp decline.
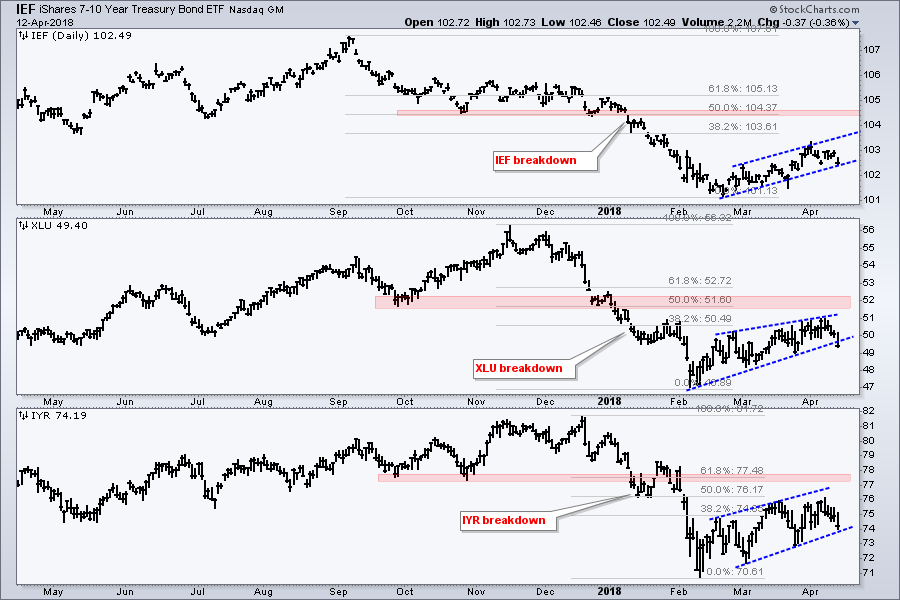
All three broke down in early January and hit new lows in February. The red zones mark resistance from broken support, but they might not make it this high. The blue lines define the current bounce: flag/channel for IEF, wedges for XLU and wedge for IYR. IEF is close to a break, XLU broke and IYR is close.
Gold Stays Stuck in Channel
Gold remains quite volatile so I am moving to a close only chart. The chart shows the Gold SPDR (GLD) in a long-term uptrend because it recorded a 52-week high in January, the chart sports higher highs and higher lows, and the PPO(50,200,0) is positive, which means the 50-day EMA is above the 200-day EMA.
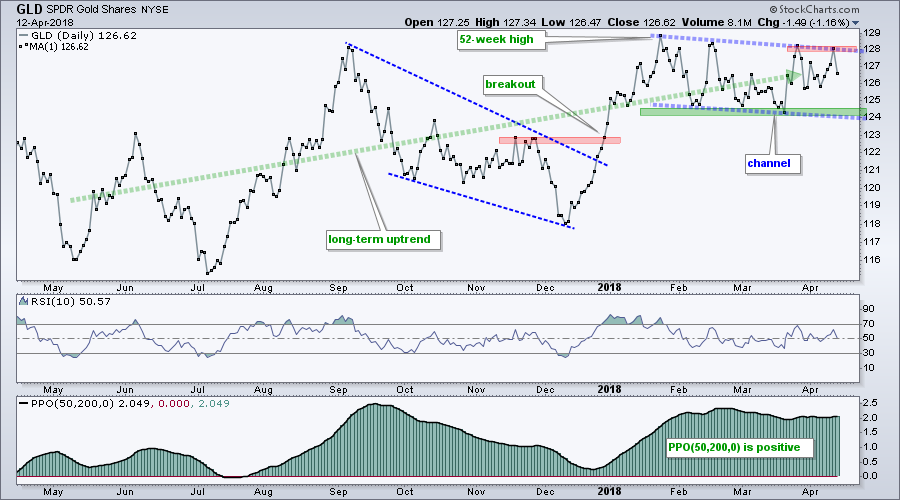
On the price chart, GLD corrected with a falling channel the last three months and challenged resistance in the 128-129 area four times. Even though we have yet to see a breakout, I consider this a corrective pattern within a bigger uptrend and I expect a breakout. Support is marked at 124 and a close below this level would be bearish.
Notes from the Art's Charts ChartList
- The Cloud Computing ETF (SKYY) came alive this week with a break above short-term resistance. The long-term trend was always up and it looks like a higher low formed in the 47 area.
- The Cyber Security ETF (HACK) is one of the leaders in tech and the market. The ETF reversed near the 50% retracement and broke flag resistance on 5-April. A new high is in sight.
- The Semiconductor iShares (SOXX) and Networking iShares (IGN) also formed higher lows and broke their short-term downtrends with breakouts this week.
- The Regional Bank SPDR (KRE) held just above the early February low with a consolidation in the 59 area. The ETF looks poised to break above consolidation resistance and it looks like the short-term trend is turning up again.
- The HealthCare Providers ETF (IHF) reversed its downswing within a bigger triangle and this is the first sign that the bigger uptrend is resuming.
- The Oil & Gas Equip & Services SPDR (XES) finally got the breakout to end the deep correction and signal a resumption of the August-December advance.
- The Coal ETF (KOL) held the 61.8% retracement and the flattening 200-day EMA. The ETF broke out with a surge this week and it looks like the correction is ending.
- The Agribusiness ETF (MOO) reversed its downswing within a bigger triangle and this is the first sign that the bigger uptrend is resuming (COPX is doing something similar).
- The Metals & Mining SPDR (XME) is bouncing off support from broken resistance with a short-term breakout. SLX recovered its support break with a short-term breakout.
Plan Your Trade and Trade Your Plan.
- Arthur Hill, CMT
Senior Technical Analyst, StockCharts.com
Book: Define the Trend and Trade the Trend
Twitter: Follow @ArthurHill


