- One-Day Breadth Thrust.
- SOXX Surges off Support.
- Four Semiconductor Stocks to Watch.
- A Bollinger Band Squeeze for Akamai.
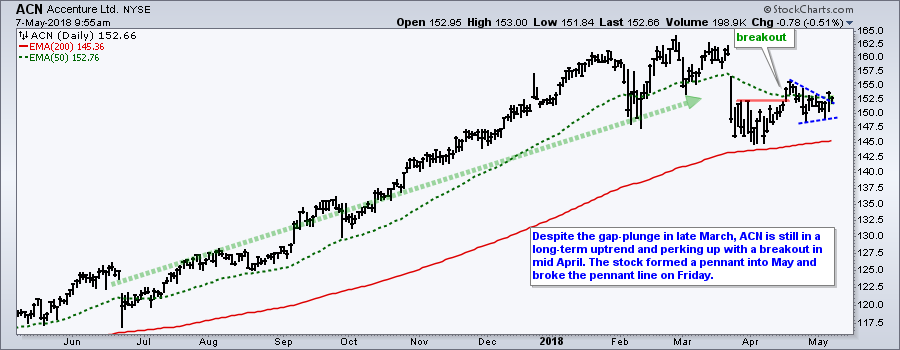
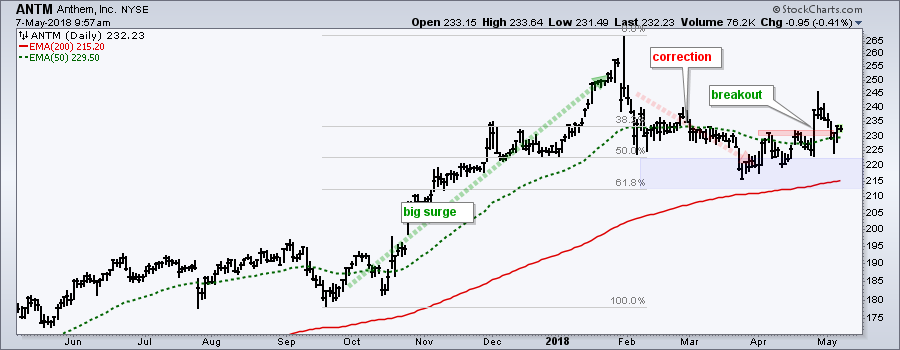
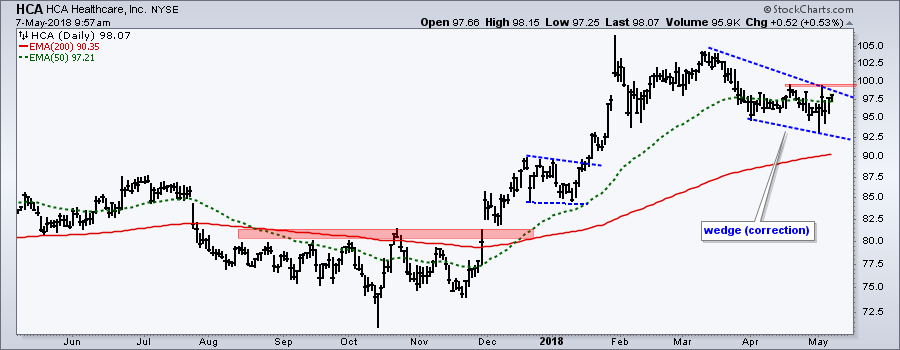
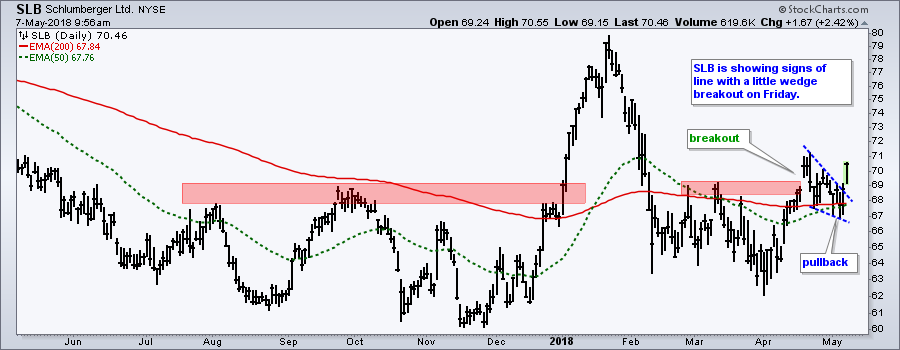
- Five Stocks to Watch: ABT, ACN, ANTM, HCA, SLB.
 One-Day Breadth Thrust...
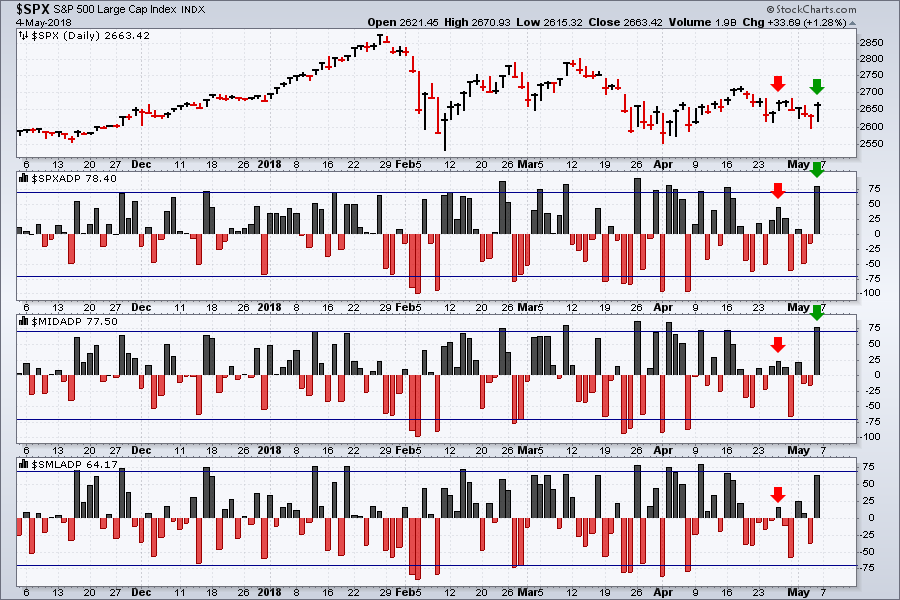
As noted last Thursday, I was not impressed with the breadth indicators because they showed narrow upside participation. This changed on Friday with one-day breadth thrusts in the S&P 500 and S&P Mid-Cap 400.
The chart below shows AD Percent for the S&P 500, S&P Mid-Cap 400 and S&P Small-Cap 600. The horizontal lines are set at +70% and -70% to identify meaningful levels. Note that Thursday's commentary includes a video explaining the three breadth indicators I use for broad market analysis.
The chart shows S&P 500 AD Percent ($SPXADP) and S&P MidCap AD Percent ($MIDADP) surging above +70% for the first time since April 16th (green arrows). This is a bullish breadth thrust that shows the most upside participation in 14 trading days. Even though participation was uninspiring from April 16th to May 3rd (red arrows), notice that these indicators did not plunge below -70%. Downside participation was broader than upside participation, but not broad enough to exceed -70%. In other words, selling was not that widespread.
SOXX Surges off Support
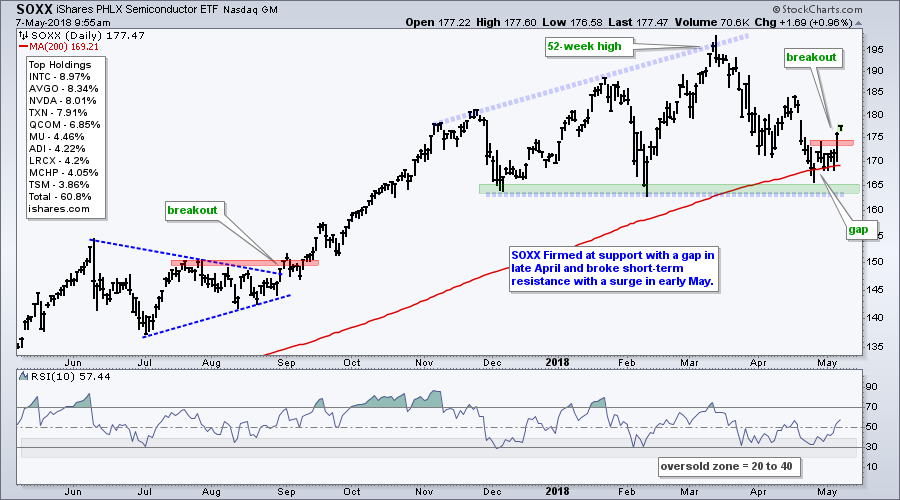
The Semiconductor iShares (SOXX) led the market with a 2.35% surge on Friday and break above last week's high. It is just a short-term breakout, but keep in mind that the long-term trend remains up for this ETF (52-week high, rising 200-day SMA and 50-day SMA above 200-day).
The chart shows SOXX hitting a 52-week high in March and then falling all the way back to its December-February lows (green zone). It is a deep fall, but the ETF managed to hold just above this support zone and turn up with Friday's breakout. Also notice that RSI moved out the oversold zone.
Four Semiconductor Stocks to Watch
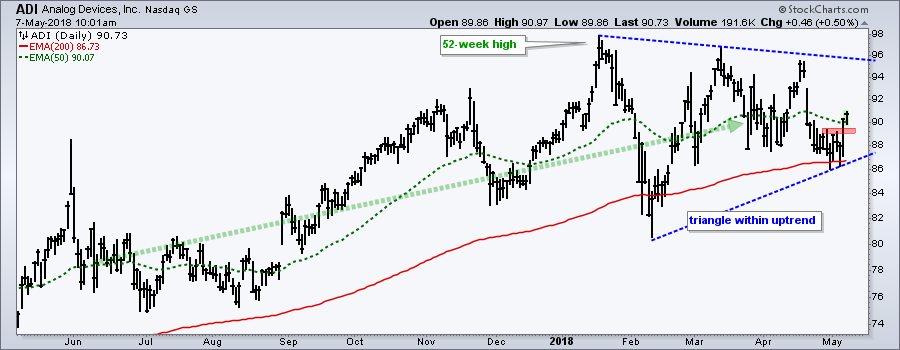
The first chart shows Analog Devices (ADI) with a long-term uptrend and a triangle forming the last three months. Keep in mind that triangles are typically bullish continuation patterns and this favors an upside breakout. The swing within the triangle turned up with Friday's breakout.
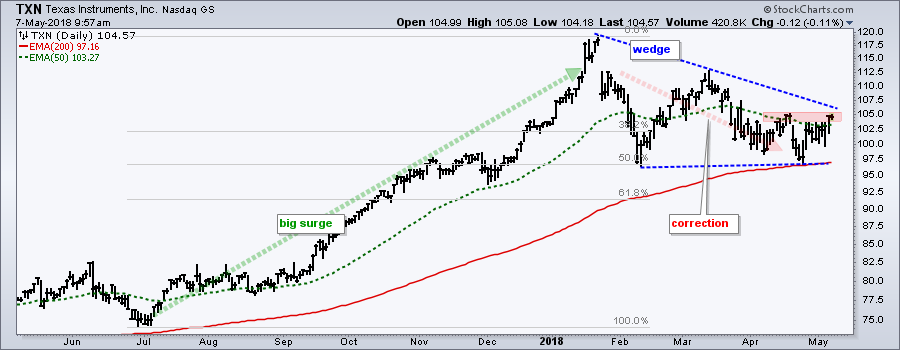
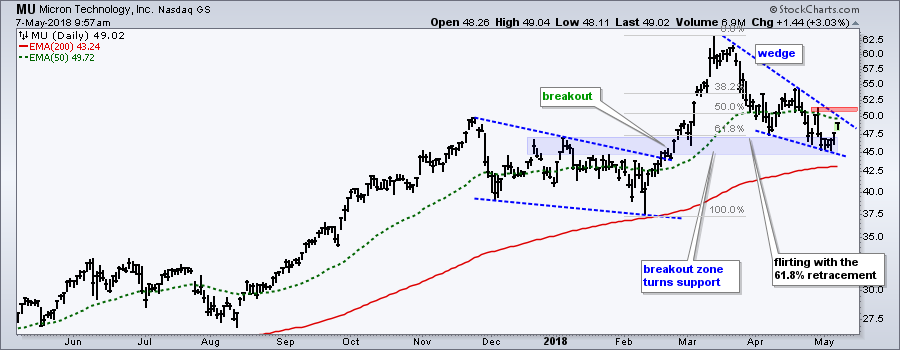
The next three charts show stocks with 52-week highs and falling wedge patterns that retraced 50-61.8% of the prior advance. The wedges differ in size, but the premise is the same. A falling wedge after a 52-week high represents a correction within a bigger uptrend. A wedge breakout signals an end to this correction and a resumption of the bigger uptrend.

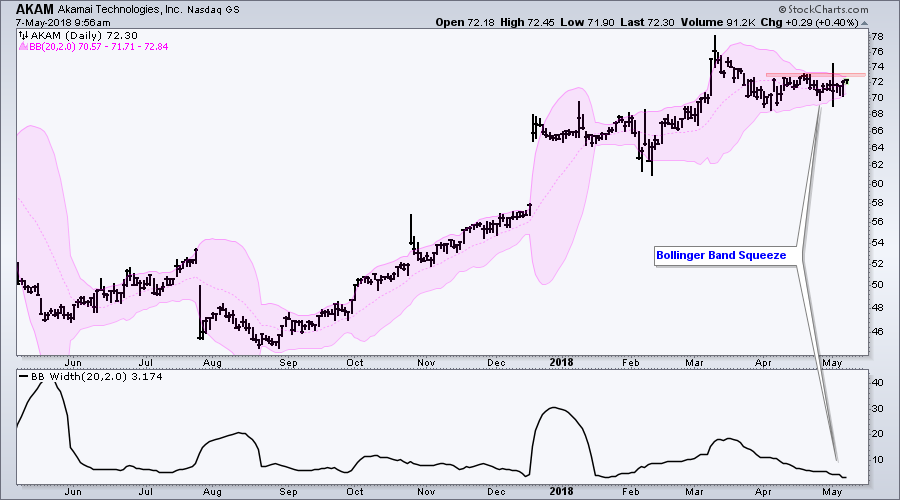
A Bollinger Band Squeeze for Akamai
The next chart shows Akamai (AKAM) with a classic Bollinger Band squeeze. The stock surged in February-March and hit a new high (long-term uptrend). AKAM then fell back into early April and stalled with a tight trading range. Notice that the Bollinger Bands narrowed and BandWidth fell to the low end of its range. A break above the upper band and red resistance zone would be bullish.
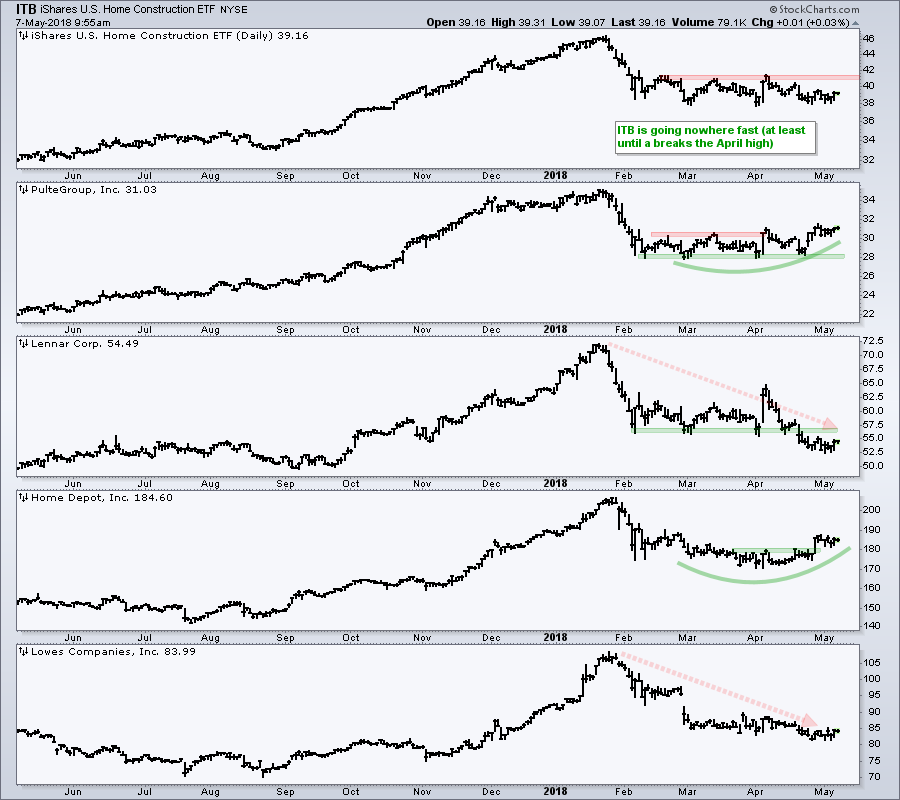
Home Construction is All Mixed Up
The Home Construction iShares (ITB) is trading near support, but showing relative weakness below it is near the March-April lows. Looking through the individual components, most show established downtrends and relative weakness. There are some bright spots, but not enough to lift the ETF. Home Depot (HD) firmed and broke out in late April, but Lows (LOW) moved below its March low in April. Pulte (PHM) shows strength with a late April surge, but Lennar (LEN) fell below its March lows in April. It is a very mixed group.
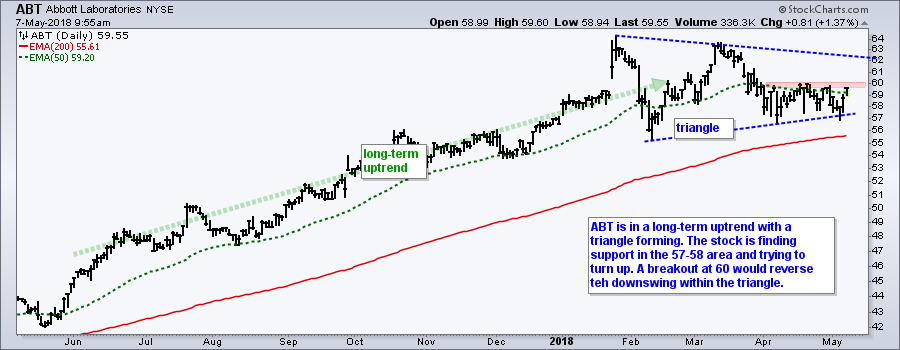
Five Stocks to Watch: ABT, ACN, ANTM, HCA, SLB
Plan Your Trade and Trade Your Plan.
- Arthur Hill, CMT
Senior Technical Analyst, StockCharts.com
Book: Define the Trend and Trade the Trend
Twitter: Follow @ArthurHill


