- S&P 500 Caught in the Crossfire.
- SPY Reverses Upswing.
- Large-cap Tech Holds up Well.
- A Bull Flag in the S&P SmallCap iShares.
- Finance and Industrials Weigh.
- Healthcare Breakdown Tilts the Balance.
- Mind the Gap in Tech-Related ETFs.
- Oil Forms Bull Flag.
- Gold Forges Lower Low and Dollar Breaks Out.
 After a big year in 2017, the broader market has gone nowhere in 2018. The S&P 500 SPDR (SPY) and EW S&P 500 ETF (RSP) are down 1-2 percent this year. Year-to-date, SPY was up some 7% at its peak in late January and down around 5% at its low in early February.
The bulls and bears have been slugging it out for control since the big swoon from late January to early February. As noted last Friday and this past Thursday, the breadth indicators reflect this stalemate.
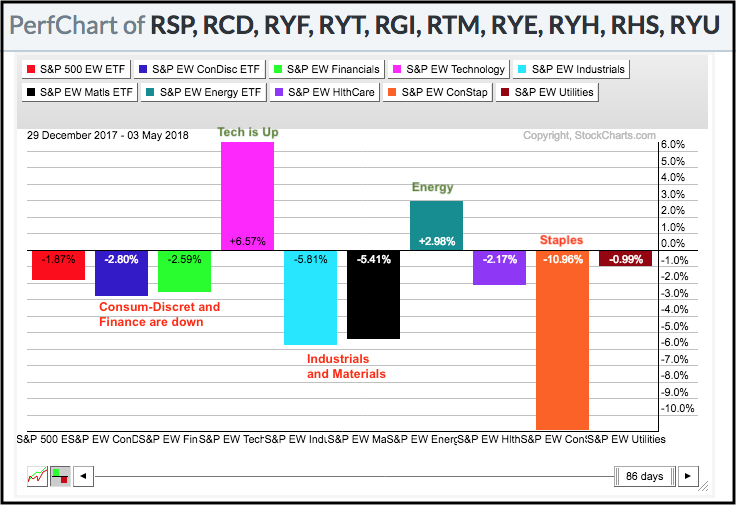
As the PerfChart below shows, seven of the nine equal-weight sector ETFs are down year-to-date with industrials, materials and staples leading the way. Technology is holding up the broader market with a 6.57% gain this year. Energy, which accounts for 7% of the equal-weight S&P 500, is the other leader.
The bulls lacked the participation needed to trigger a bullish breadth thrust on the last two bounces, while the bears have not been strong enough to trigger signals in the longer-term indicators.
The divided market is preventing a bullish breadth thrust, but keeping the bears contained at the moment. In the absence of bearish signals from the long-term breadth indicators, I remain in the bull market camp and will focus on the swings within the triangle on the S&P 500.
S&P 500 Caught in the Crossfire
The swings are growing smaller as the range narrows for the S&P 500. The index looked like it was breaking out with the move above 2700 on April 17th, but promptly peaked and moved back to its rising 200-day SMA the last two weeks.
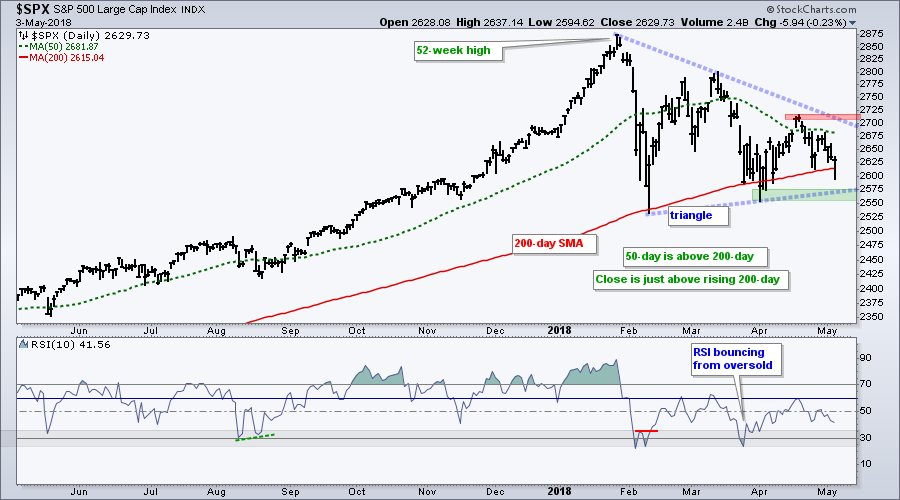
Trading within this range has been quite treacherous with the relatively short price swings over the last four weeks. Triangles are normally continuation patterns, but big triangles can resolve either way (up or down). The red zone marks resistance and the green zone marks support. Watch these levels for the resolution of this triangle.
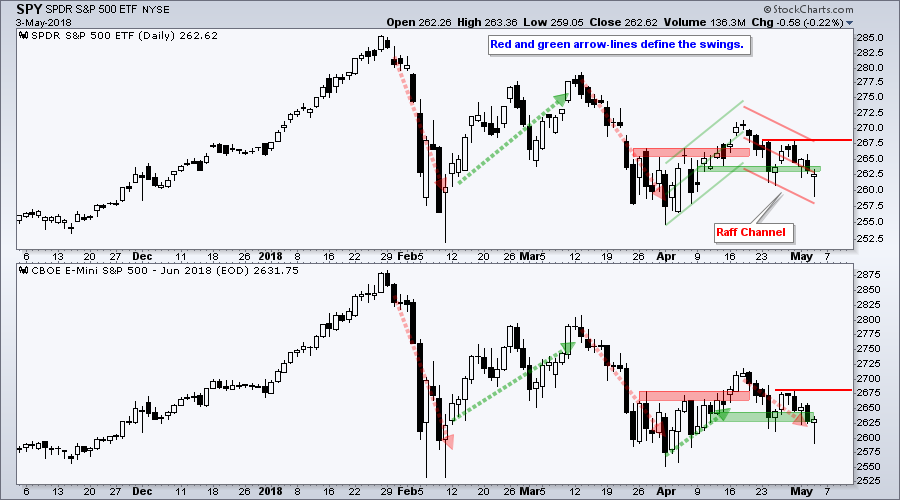
SPY Reverses Upswing
The S&P 500 SPDR (SPY) and the E-mini are used to analyze the swings with the triangle and the whipsaws are building. SPY reversed its upswing with a close below support on Thursday and I drew a new Raff Regression Channel to define the new downswing. Resistance is marked at 268 and a breakout here is needed for a reversal.
Large-cap Tech Holds Up
QQQ took a hit on April 24th with a plunge below 160 and then recovered with a gap up two days later and closed back above 160. The ETF stalled the last five days with a slight slope down and this could be a bull flag (blue lines). Look for a breakout at 163 to signal a continuation of last week's gap-surge.
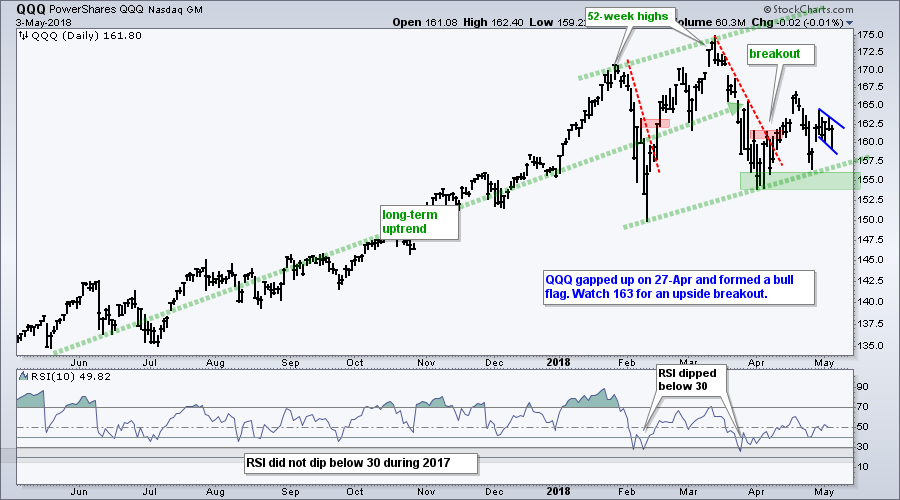
Overall, QQQ is still in a long-term uptrend and still one of the stronger ETFs. QQQ hit a 52-week high in March and formed a higher low from February to April. Also keep in mind that QQQ led the major index ETFs in 2017 and is up 4% in 2018. SPY, in contrast, is down 1.2% this year.
A Bull Flag in the S&P SmallCap iShares
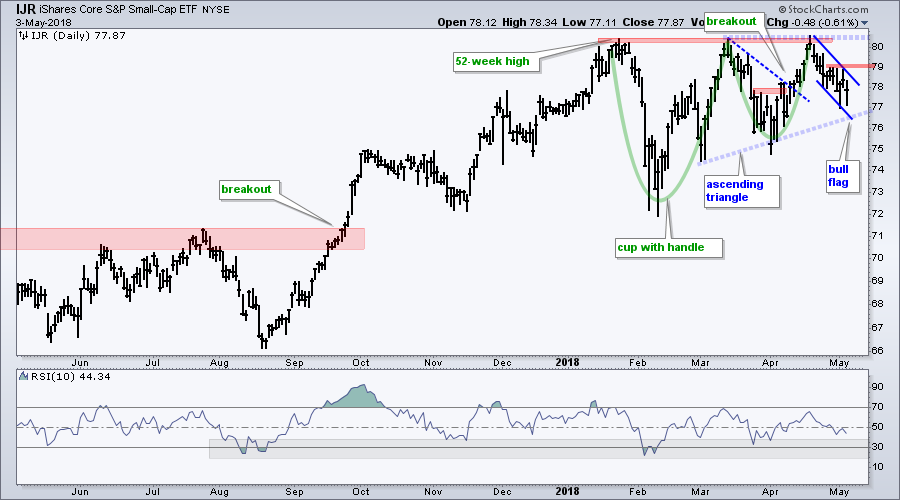
We can add another bullish continuation pattern to the S&P SmallCap iShares (IJR) this week. First, a big cup-with-handle formed from January to April. Second, an ascending triangle formed over the last two months. Third, a bull flag is taking shape with the decline over the last two weeks. Watch 79 for a flag breakout and the 2018 highs for an even bigger breakout.
Finance and Industrials Weigh
The Financials SPDR (XLF) broke rising flag support this week and formed a lower low this week. Thus, the April low is below the February low and the May low is below the February low.
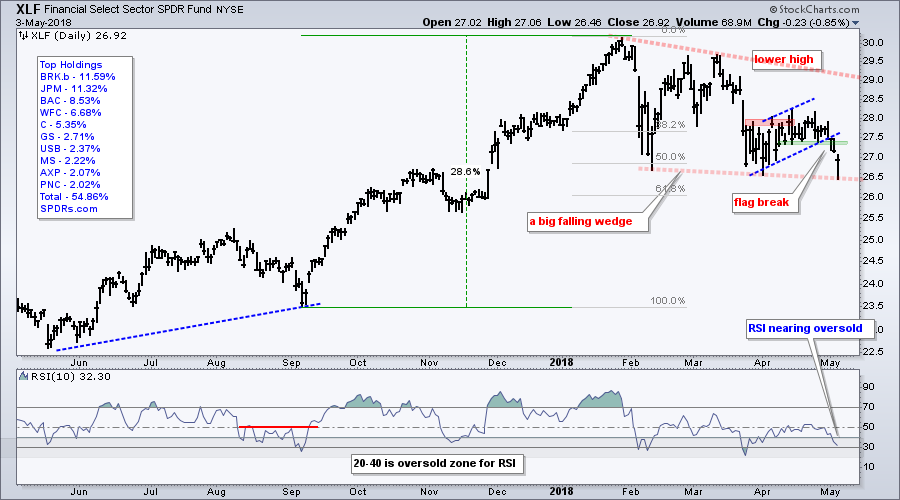
There is a clear downtrend in 2018 with a falling wedge taking shape. While this could be a big correction after a 20+ percent advance in 2017, XLF is one of the weaker sectors right now and weighing on the broader market.
The Industrials SPDR (XLI) also moved below its February low with a sharp decline the last two weeks. Drawing a lower trend line is premature, but a big wedge is also possible here. Keep in mind that XLI was also up 20+ percent in 2017.
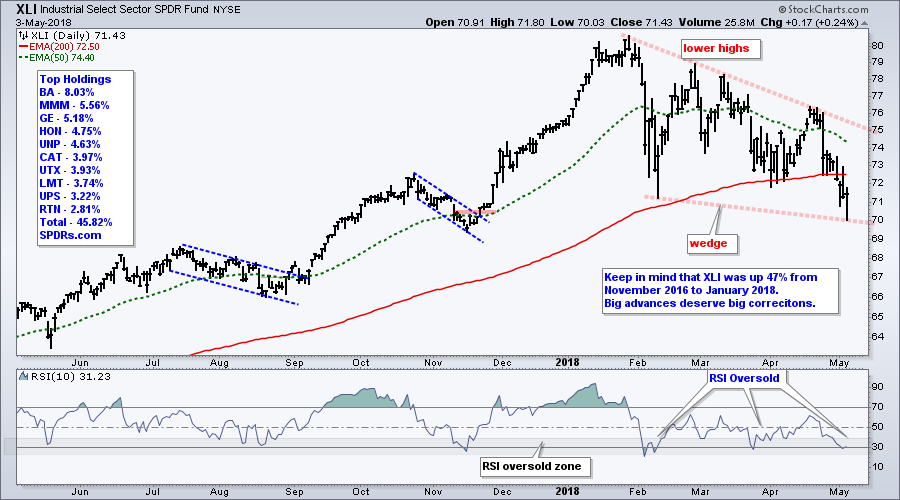
The indicator window shows RSI moving below 30 for the fourth time this year. Prior dips gave way to an oversold bounce, but relative weakness in XLI this year is a concern.
Healthcare Breakdown Tilts the Balance
The Health Care SPDR (XLV) did not break its early April low, but the ETF broke rising wedge support for the second time in two months. A lower high also formed from March to April.
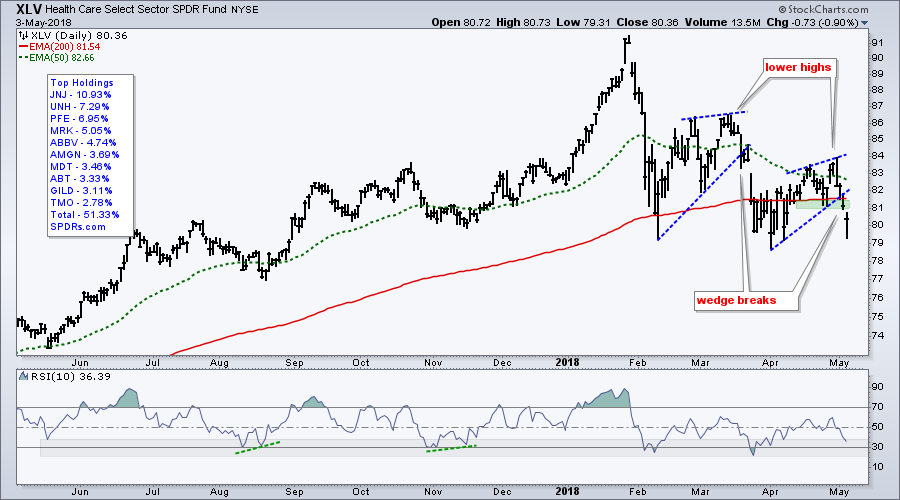
With healthcare and finance joining industrials in a breakdown, this means three of the five biggest sectors are weighing on the broader market. Throw in a 52-week low in the Consumer Staples SPDR (XLP), which is the six largest sector (6.82%), and it is little wonder that SPY is struggling.
Mind the Gap in Tech-Related ETFs
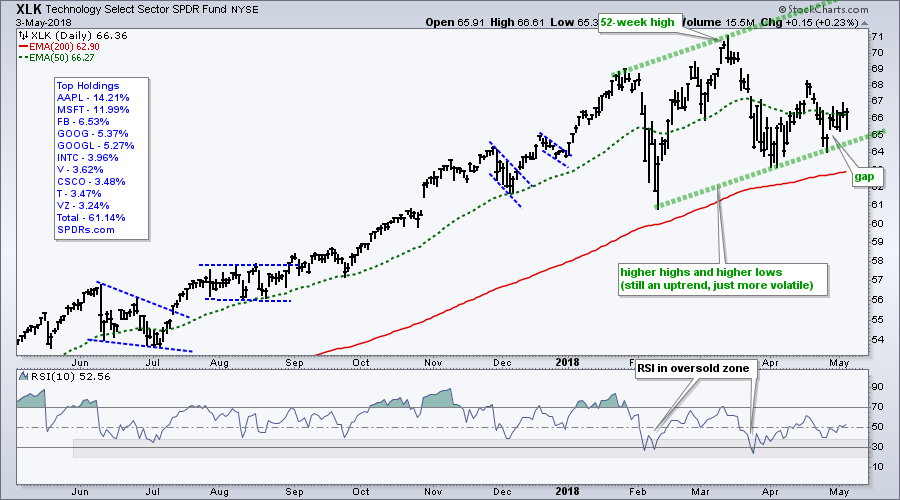
Technology is still the leader in 2018 and this past week. Note that nine of the ten sectors SPDRs are down so far this week, but the Technology SPDR (XLK) is up .71%. It is not a huge gain, but it does show some short-term strength in XLK. Also notice that XLK (+4.09%) is the second-best performing sector year-to-date (XLY is up 4.34%).
The chart shows XLK gapping up last week Thursday and holding this gap the last six days. I view this as bullish price action as long as it holds. A close below 64.8 would fill the gap and call for a reassessment.
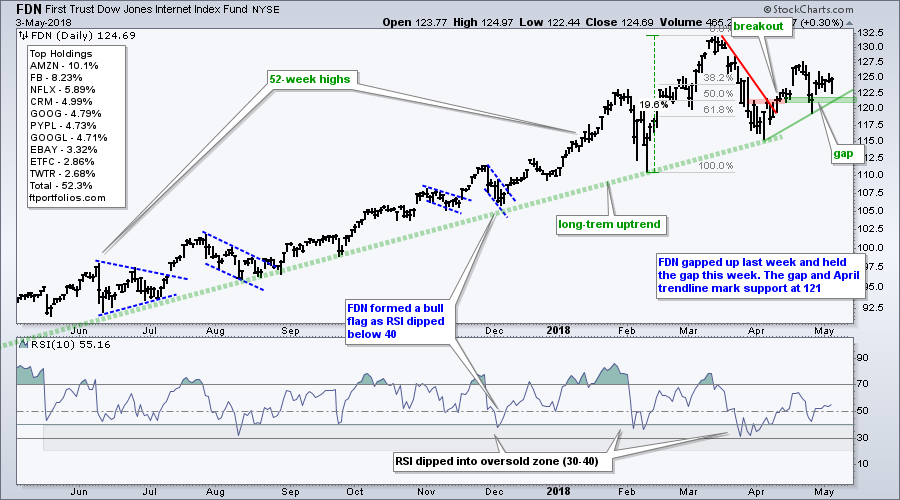
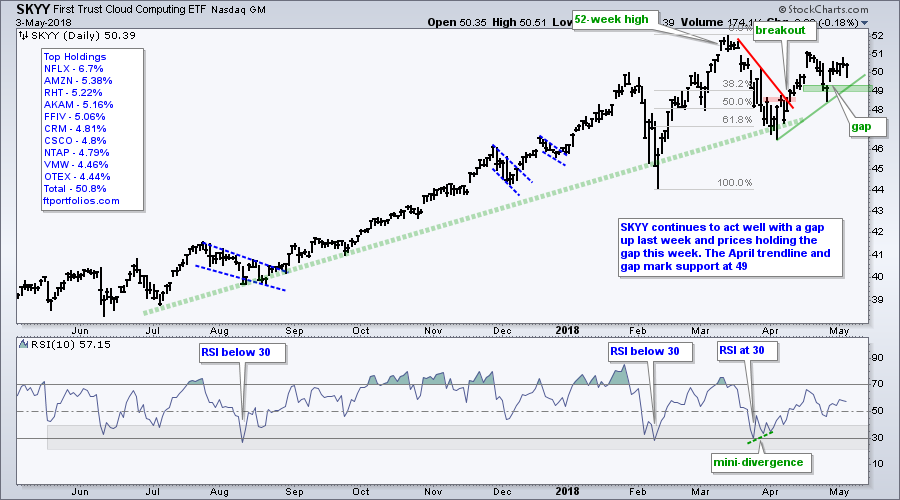
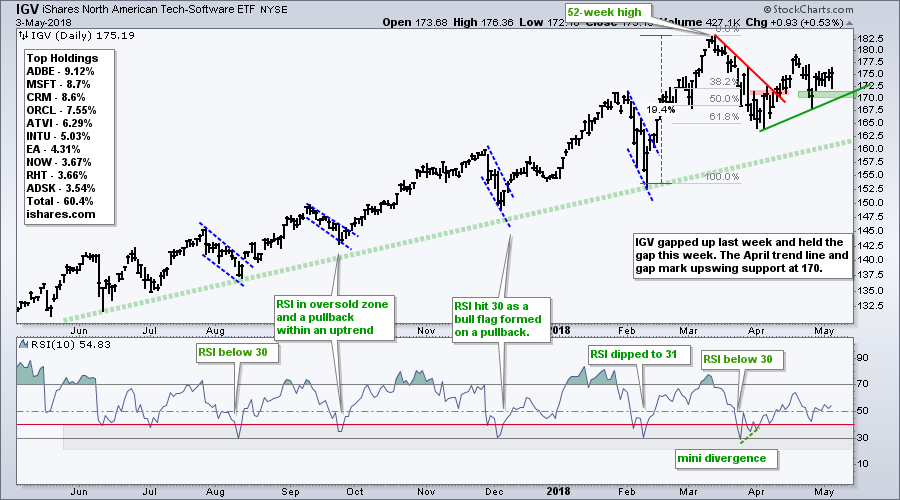
Within the tech sector, I am seeing similar gaps in the Cloud Computing ETF (SKYY), Internet ETF (FDN) and Software iShares (IGV). All three are in long-term uptrends and broke short-term resistance in early April. They were hit hard last week Tuesday (April 24th), but recovered with the gap. The April trend line and gaps mark support. A close below support would be quite negative for these three and weigh on the tech sector.
Oil Forms Bull Flag
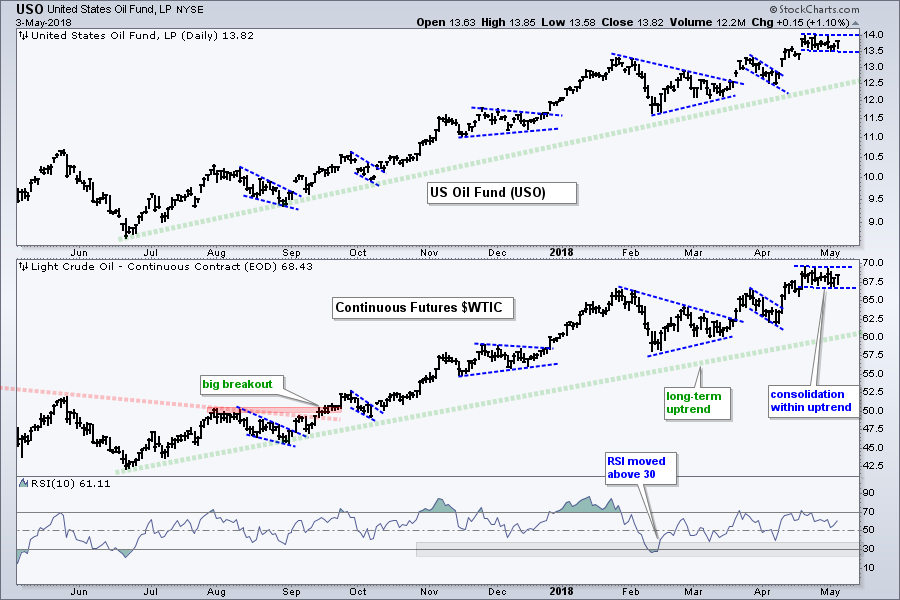
The Light Crude Continuous Contract ($WTIC) surged to a new high in mid April and then traded flat the last two weeks. This looks like a consolidation within an uptrend and a breakout would argue for a move into the mid 70s. Such a move could be bullish for energy-related shares and ETFs.
Gold Forges Lower Low
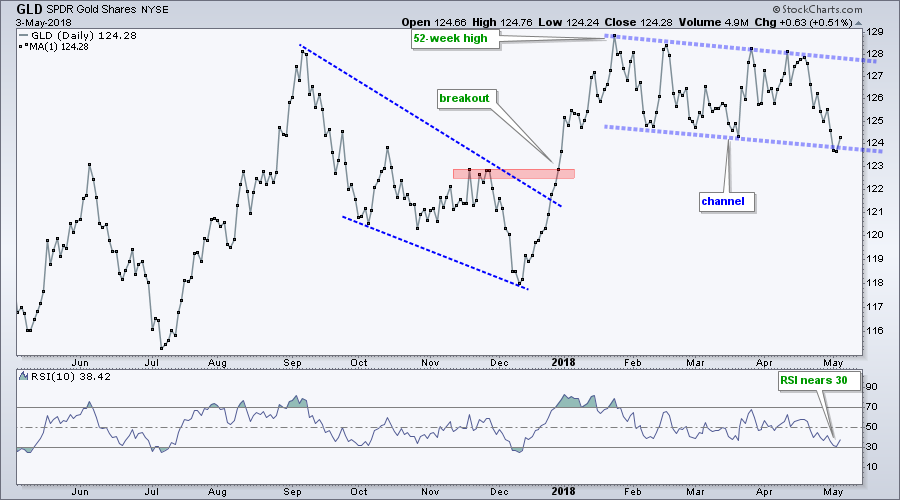
The Gold SPDR (GLD) fell some three percent in the last three weeks and exceeded the March low. GLD remains within a falling channel with lower lows and lower highs since February. The indicator window shows RSI moving towards 30 and its lowest level since December. Gold is getting short-term oversold and this could give way to a bounce.
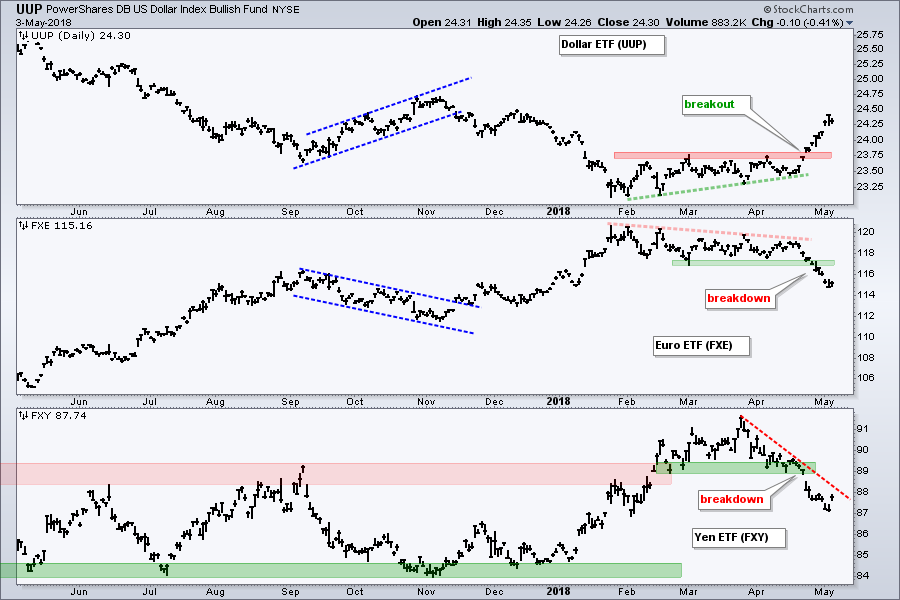
Dollar Breaks Out
It is hard to get too positive on gold with the US Dollar ETF (UUP) breaking out and the Euro ETF (FXE) breaking down. UUP broke resistance from the February-April highs with a big surge the last two weeks. Conversely, FXE formed lower highs and broke support. The Dollar breakout is negative for gold because these two are negatively correlated.
Weekend Videos
Chris Verrone, Strategas Partners, discusses the rising risks to the market. The traditional defensive plays have struggled along with the broader market, but small-caps, regional banks and oil have gained.
Marko Kolanovic, J.P. Morgan global head of derivatives and quantitative strategies, discusses his market predictions for the S&P 500 and the S&P 500 Volatility Index ($VIX).
Notes from the Art's Charts ChartList
- The Cyber Security ETF (HACK) hit a new high two weeks ago and consolidated with a pennant.
- The Cloud Computing ETF (SKYY), Internet ETF (FDN) and Software iShares (IGV) continue to act well with up gaps last week and prices that held the gaps this week.
- The Semiconductor iShares (SOXX) is firming at support.
- The Regional Bank SPDR (KRE) fell back this week, but the early April bounce off support remains alive.
- Biotechs were hit this week, but the Biotech SPDR (XBI) continues to hold up better than the Biotech iShares (IBB).
- The HealthCare Providers ETF (IHF) formed a bull flag over the last two weeks.
- The Copper Miners ETF (COPX) and Agribusiness ETF (MOO) fell back within their contracting triangles.
- The Metals & Mining SPDR (XME) is attempting to reverse its downswing with a bigger falling wedge.
- Click here for the ChartList (updated on Friday, May 4th)
Plan Your Trade and Trade Your Plan.
- Arthur Hill, CMT
Senior Technical Analyst, StockCharts.com
Book: Define the Trend and Trade the Trend
Twitter: Follow @ArthurHill


