- Ranking Sectors by High-Low Percent.
- Sector SPDR Chart Analysis (big wedges).
- Oil and Energy-Related ETFs Continue to Work.
- 10-yr T-Yield Turns Back Up.
- Winners and Losers in Rising Rate Environment.
- Stocks: TSLA, DHR, NKE, ROST, SYK, UNH.
Today's c ommentary and charts show some highlights from "On Trend", the StockChartsTV show designed to keep you on the right side of the trend. On Trend can be seen every Tuesday at 10:30 AM ET. This show is repeated immediately at 11:00 AM ET and throughout the week on StockChartsTV. On Trend is then archived on the StockCharts Youtube channel.
In general, the show consists of three parts: technical concepts or strategy, timely analysis and StockCharts tools. Sometimes I will devote 10 to 15 minutes to a key technical concept or strategy. Other times, the will be highlighted throughout the show. SharpCharts and other tools are featured with details on the settings. Chartists can then incorporate these key technical concepts and chart settings into their processes.
Ranking Sectors by High-Low Percent
The first chart shows the High-Low Percent indicators for the nine sector SPDRs. A 10-day SMA (red line) was applied to each indicator and the windows are sorted by this value. This provides a ranking based on the two week average of High-Low Percent and we can see which sectors are generating the most new highs (as a percentage of total issues).
Energy and technology are the clear leaders with the highest average High-Low Percent readings (green outlines). Finance and industrials ticked up a little last week, but remain at relatively low levels (blue outlines). I will be watching these two sectors quite closely to see if they can further expand their new highs.
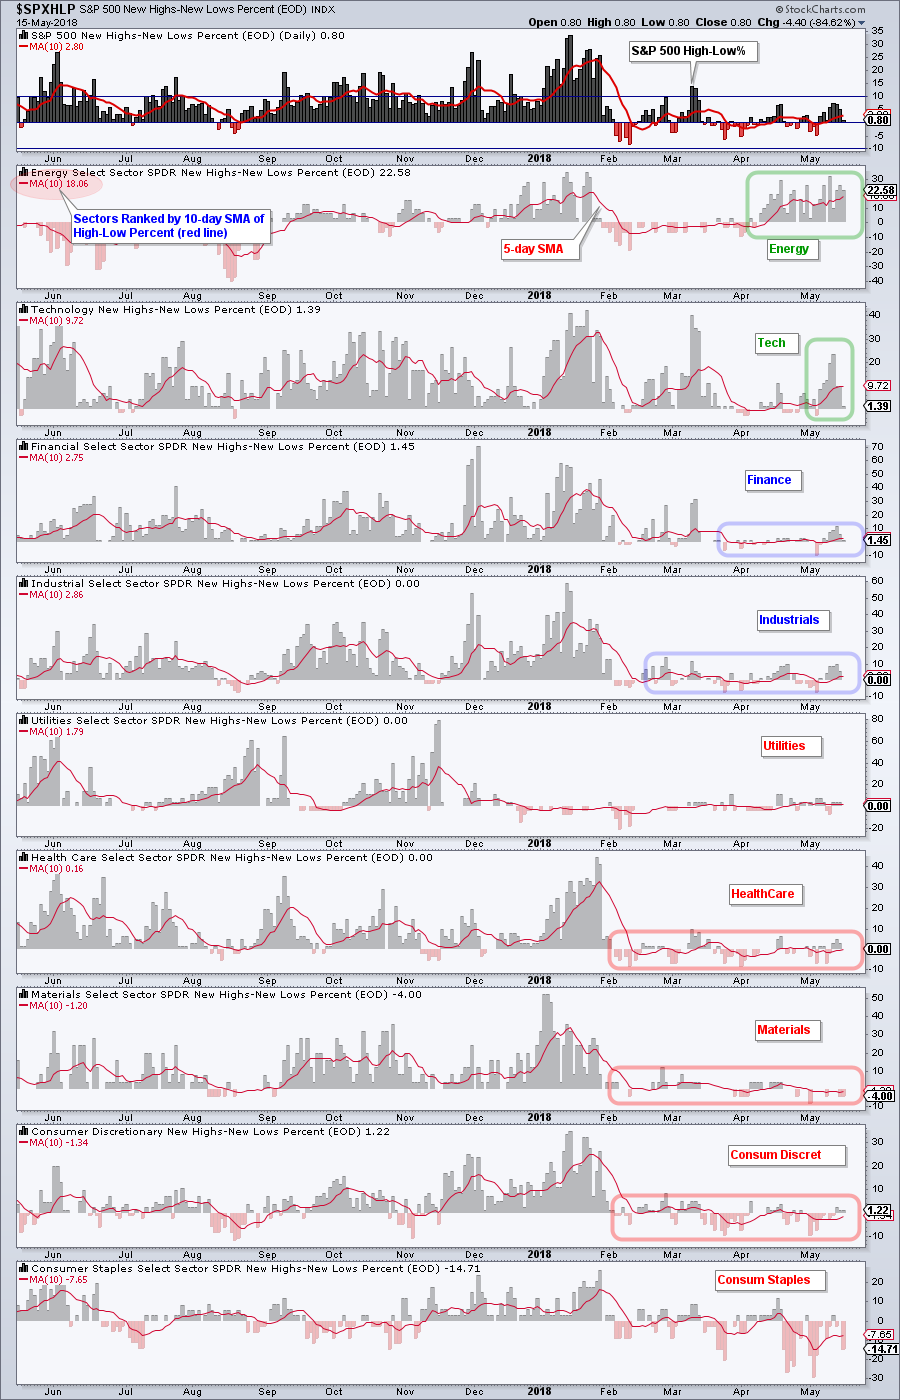
In the lower half of the chart, we can see that healthcare, materials and consumer discretionary are struggling (red outlines). Their High-Low Percent values are oscillating above/below the zero line without much conviction. Consumer staples remains, by far, the weakest of the nine sectors with the most new lows.
Big Wedges in Three Sector SPDRs
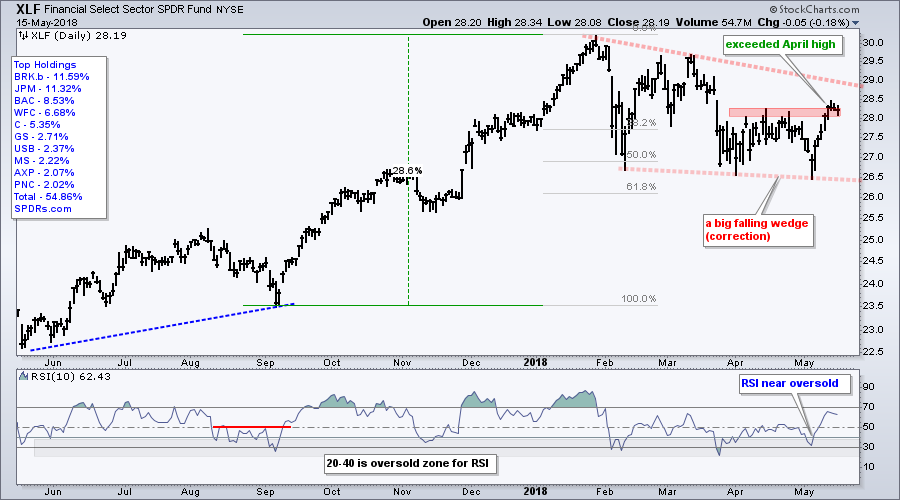
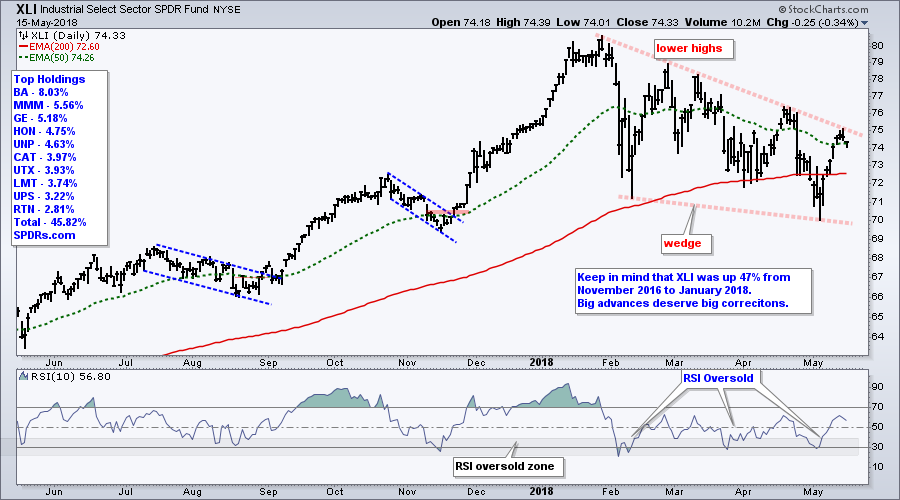
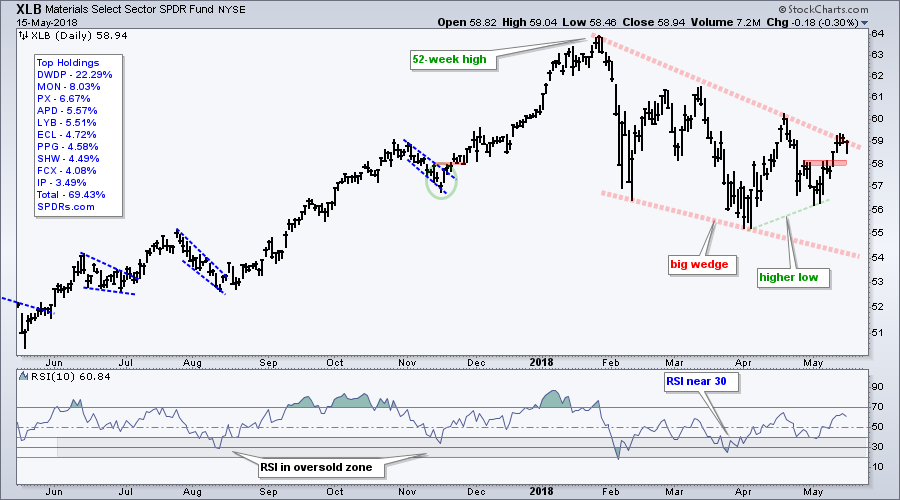
Note that I covered all nine sector SPDRs in the video (link below). The charts below show big falling wedges in the Financials SPDR (XLF), Industrials SPDR (XLI) and Materials SPDR (XLB). These wedges are viewed as big corrections after massive advances. XLF broke its April high and is showing upside leadership in May. XLI also recovered nicely the last nine days and is challenging the wedge line. XLB formed a higher low in early May and is challenging the wedge line.
Winners and Losers in A Rising Rate Environment
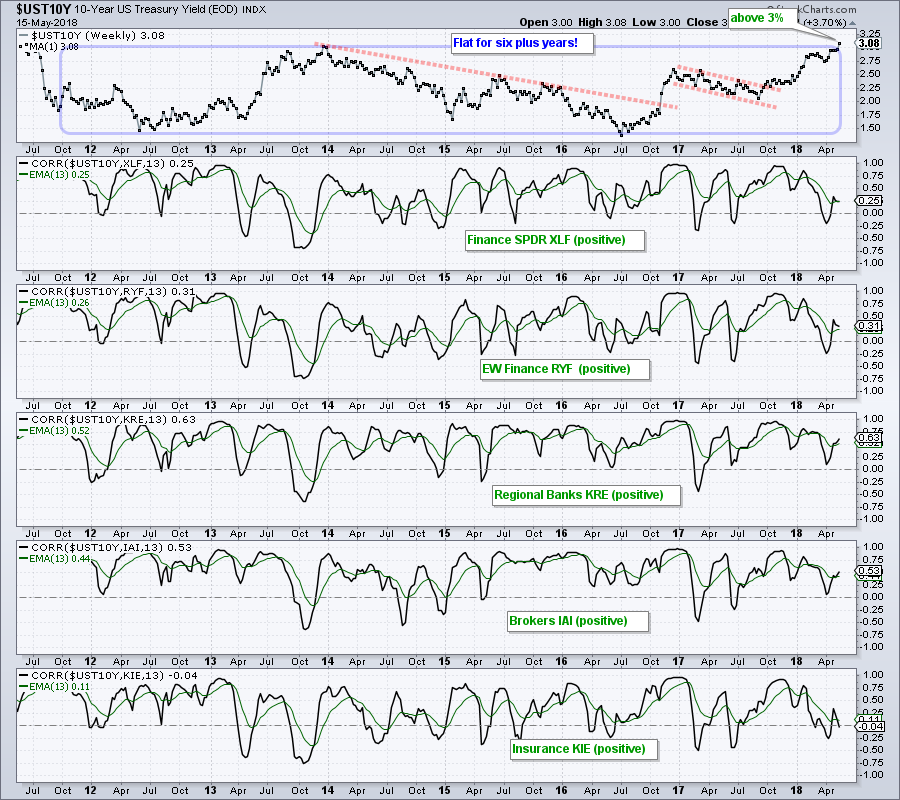
Chartists looking to pick the winners and losers in a rising rate environment can use the Correlation Coefficient with the 10-yr T-Yield. The first chart shows the 10-yr T-Yield ($UST10Y) moving above its 2013 high and exceeding 3% this week. Talk about a major breakout! The lower windows show the 13-week Correlation Coefficients for the finance-related ETFs (XLF, RYF, KRE, IAI and KIE). The green lines are 13-week EMAs to smooth the lines.
The Correlation Coefficient is not a timing indicator by any means. Instead, it just shows us the relationship between two symbols.
Note that the Correlation Coefficients are mostly positive and this means the finance-related ETFs tend to move in the same direction as the 10-yr T-Yield. Thus, rising yields should be positive for banks.
In the video, I also showed that the Utilities SPDR (XLU) and REIT iShares (IYR) are negatively correlated to the 10-yr T-Yield. This means they tend to move in opposite directions and rising yields could be negative for these two. Also note that John Murphy showed the Regional Bank SPDR (KRE) reacting positively to rising yields and the Real Estate SPDR (XLRE) reacting negatively in Tuesday's Market Message.
Further Details on Tuesday's Show
On Trend for Tuesday, May 15th, also includes chart analysis for all nine sector SPDRs, analysis for the 20+ YR T-Bond ETF (TLT) and 10-yr T-Yield ($TNX), a focus on energy and energy-related ETFs, and some individual stocks (TSLA, DHR, NKE, ROST, SYK, UNH).
Here are some of the technical concepts covered in this show:
- We cannot predict how long a trend will extend: XLE, $WTIC, $BRENT
- Corrections and 50% Retracements: XRT
- Flag/wedge Breakouts: XES, XOP, FCG, AMLP
- Relative weakness: ITB
- Throwback after breakout: TLT and IEF
- Broken Support turns Resistance TSLA and XLU
- Internal Leadership (High-Low Percent for XLK and XLE)
Plan Your Trade and Trade Your Plan.
- Arthur Hill, CMT
Senior Technical Analyst, StockCharts.com
Book: Define the Trend and Trade the Trend
Twitter: Follow @ArthurHill

