- Materials Sector Leads in May.
- Metals & Mining SPDR Breaks Out of Consolidation.
- Steel Dynamics, Allegheny and Reliant Lead Group.
- The Long Correction in Copper.
- Copper Miners ETF Challenges Resistance.
- Continuous Commodity Contracts are Mixed.
- Stocks to Watch: ADSK, CA, HPE, HCA.
 The EW Technology ETF, EW Industrials ETF and EW Materials ETF are the leading sectors this month. The chart below shows month-to-date performance for the EW S&P 500 ETF (RSP) and the nine equal-weight sectors. Tech and energy are leading with 5+ percent gains. Materials is third with a 3.92% gain this month. Elsewhere, money is clearly flowing out of consumer staples and utilities because these two are down.
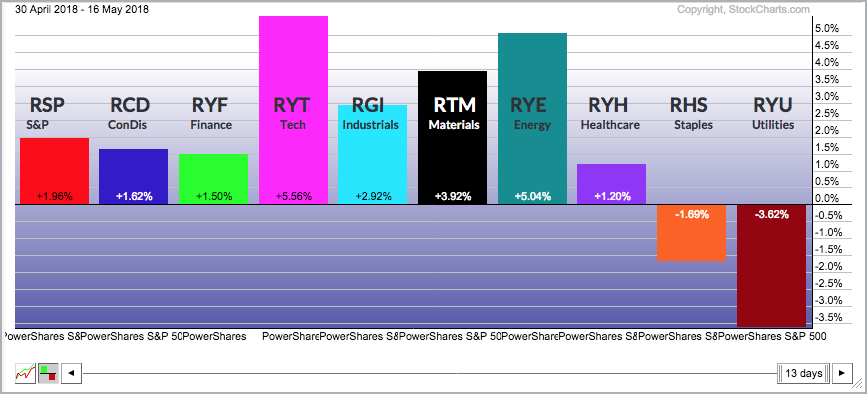
Within the materials sector, we are seeing some upside leadership in mining, metals and steel (sans gold miners). Today I will focus on the Metals & Mining SPDR, the Steel ETF and highlight some steel stocks. I will also look at copper and the Copper Miners ETF.
Metals & Mining SPDR Breaks Out of Consolidation
The next few charts are weekly charts extending two years. Sometimes it is hard to see the forest for the trees and weekly charts put patterns in perspective. The Metals & Mining SPDR (XME) sprang to life over the last seven weeks with a bounce off support and wedge breakout. First and foremost, the long-term trend is up because the ETF hit a 52-week high in January and the PPO(10,40,0) is positive.
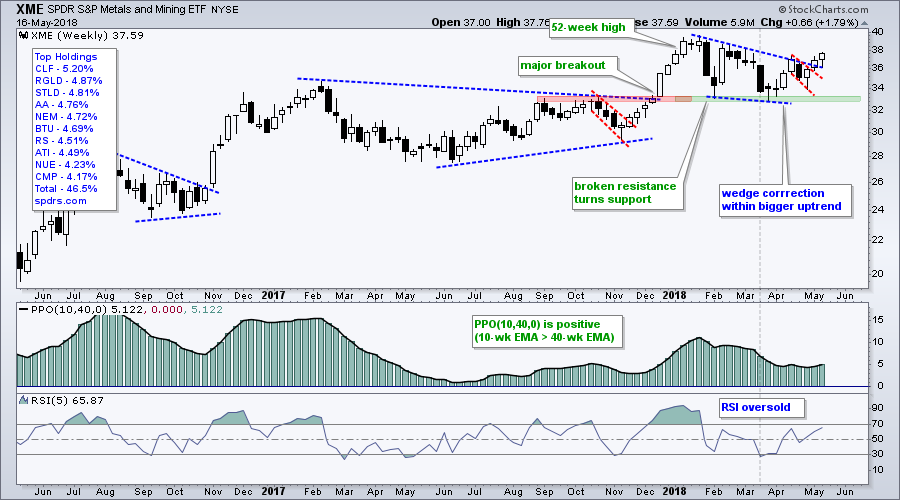
XME broke out of a big triangle in December 2017 and tested the breakout zone twice in 2018 as broken resistance turned support, which is a key concept in technical analysis. A wedge formed as the ETF corrected in 2018 and this correction ended with the breakout over the last two weeks.
The breakout signals a continuation of the bigger uptrend and I would expect new highs in the coming weeks. Note that this chart also shows the top holdings and steel stocks account for around 50% of the ETF.
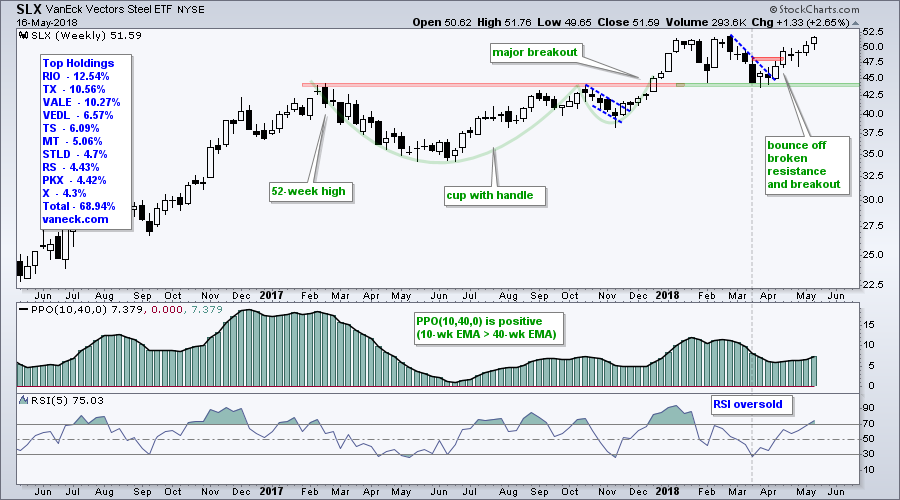
The next chart shows the Steel ETF (SLX) bouncing off broken resistance in April and moving towards its 2018 highs, which were 52-week highs. In contrast to XME above, this ETF has a heavy weighting in non-US steel stocks.
Steel Dynamics, Allegheny and Reliant Lead Group
The next chart shows six steel stocks with the leaders at the top. Steel Dynamics (STLD) broke out of a triangle consolidation last week and hit a 52-week high on Wednesday. Allegheny (ATI) broke out of a corrective channel last week and is close to a new high. Reliant Steel and Aluminum (RS) broke above the upper line of a triangle on Wednesday.
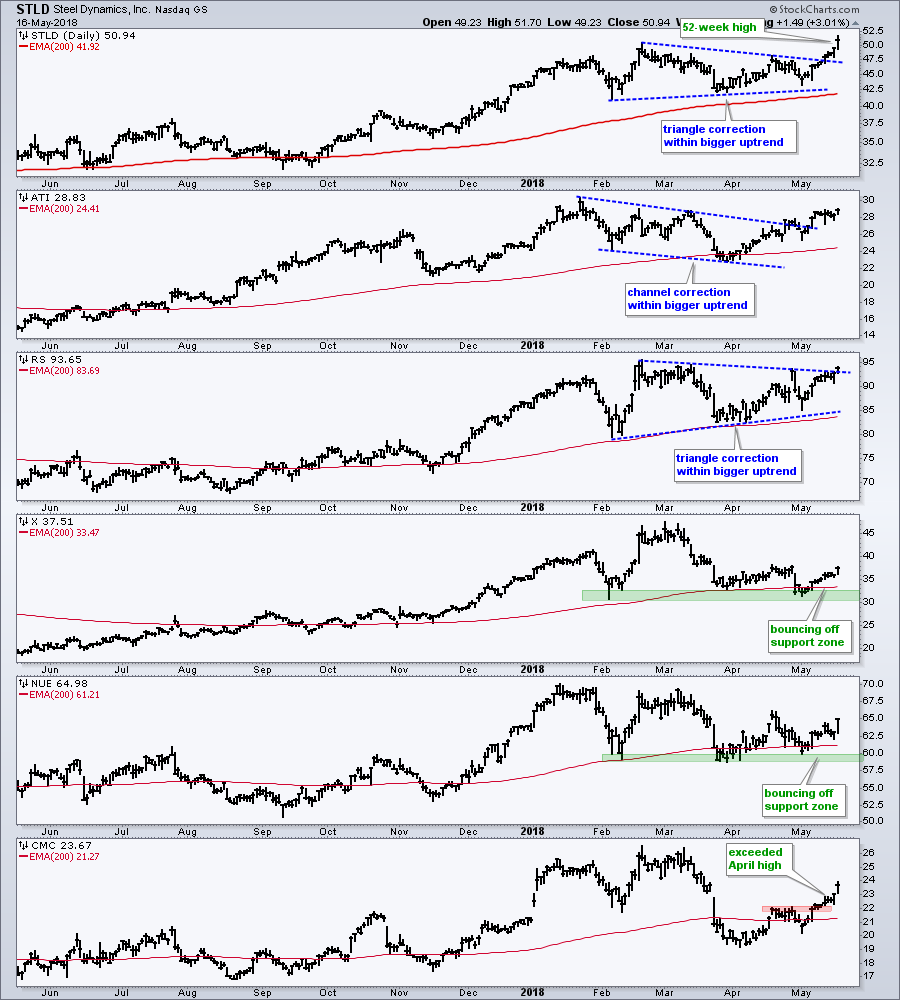
The lower half of the chart shows US Steel (X) and Nucor (NUE) with bounces off support. They are lagging the top three because they are still well below their 52-week highs. Commercial Metals (CMC) formed a lower low from February to April, but broke above its April high last week with a big move in May.
The Long Correction in Copper
The Copper Continuous Contract ($COPPER) surged in December and recorded a 52-week high, but then fell back in 2018 with a correction that is entering its fifth month. I still think the long-term trend is up because of the 52-week high in late December and positive PPO(10,40,0). Copper is also holding above a big support zone in the 2.9-3 area.
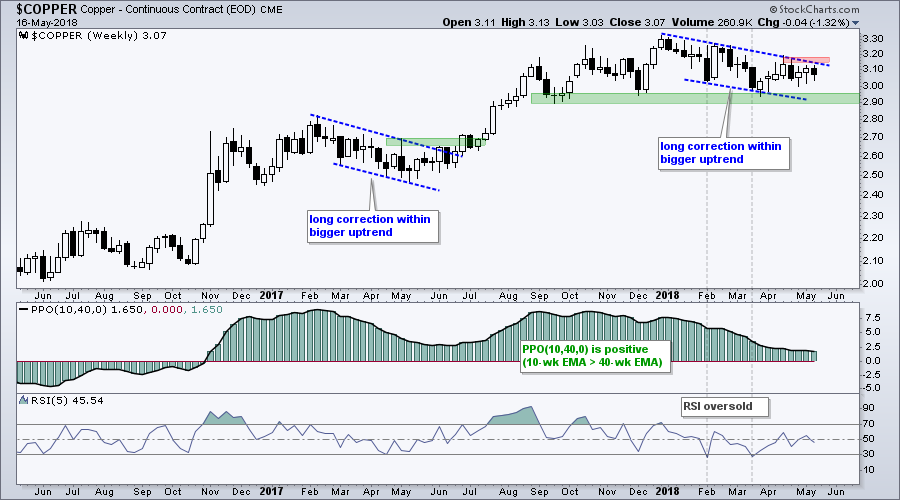
The blue lines mark a falling channel and this is the second long correction in the last 18 months. I am using the April highs to mark resistance and a breakout here would suggest that the big correction is ending.
Copper Miners ETF Challenges Resistance
The next chart shows the Copper Miners ETF (COPX) with a triangle forming in 2018. The long-term trend is up so this is considered a bullish continuation pattern. A break above the April highs would signal an end to the correction and a resumption of the bigger uptrend.
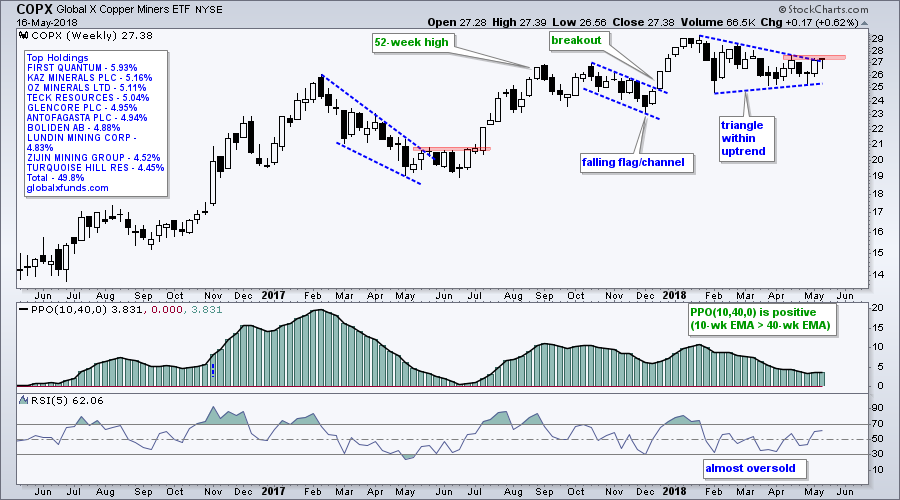
The chart also shows the top holdings. Note that most are trading in Canada and London. Depending on your subscription level, StockCharts has data for Canadian and British stocks. Simply enter the name in the symbol entry box at the top of any webpage to find the symbol.
Tracking the Continuous Commodity Contracts
Chartists interested in tracking commodities can use our continuous futures contracts. The table below shows 18 such contracts arranged by category: agriculture, energy, industrial metals, precious metals and softs. I stuck lumber in with softs. The right side of the table shows the year-to-date percentage change.
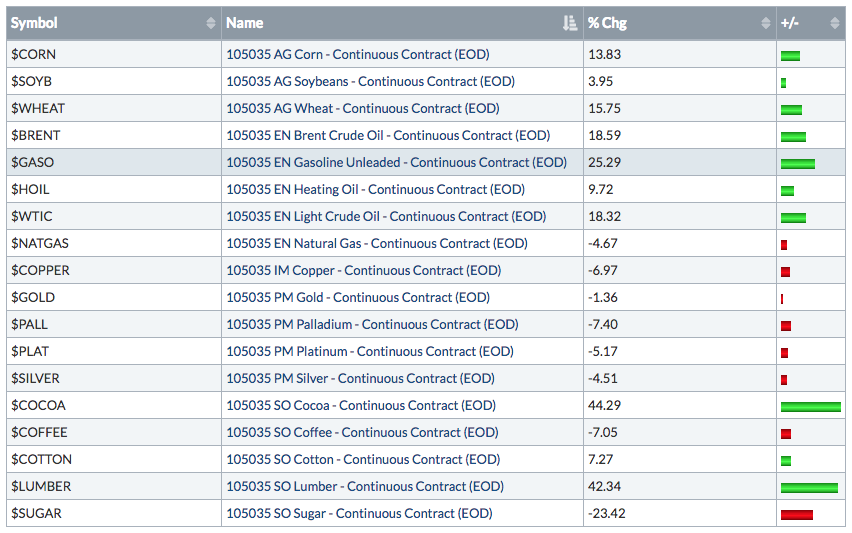
Overall, ten are up and eight are down. Thus, commodities are mixed overall. Agriculture and energy are strong, along with Cocoa and Lumber. Copper is down a little and precious metals are weak across the board. Coffee and sugar, which go good together, are both down.
Stocks to Watch
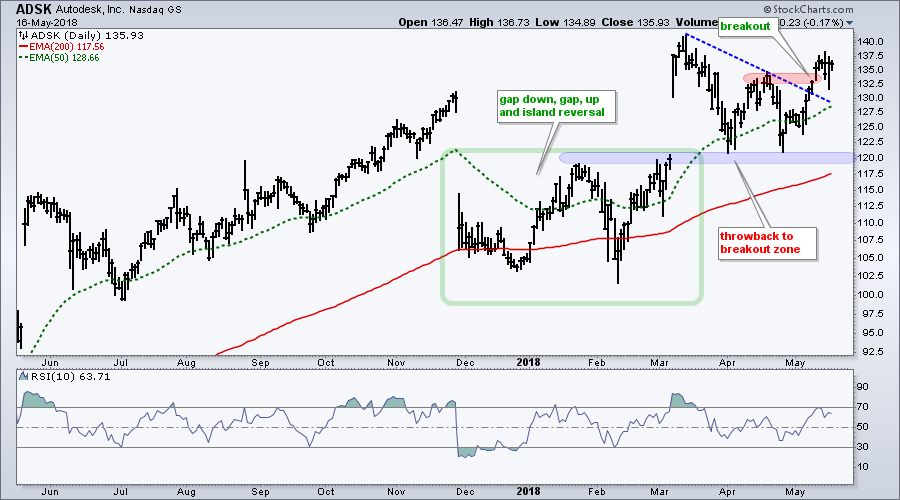
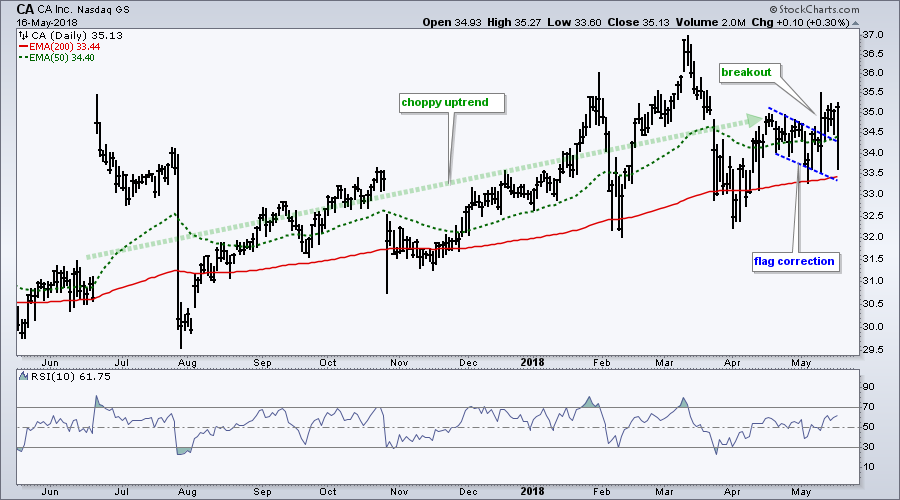
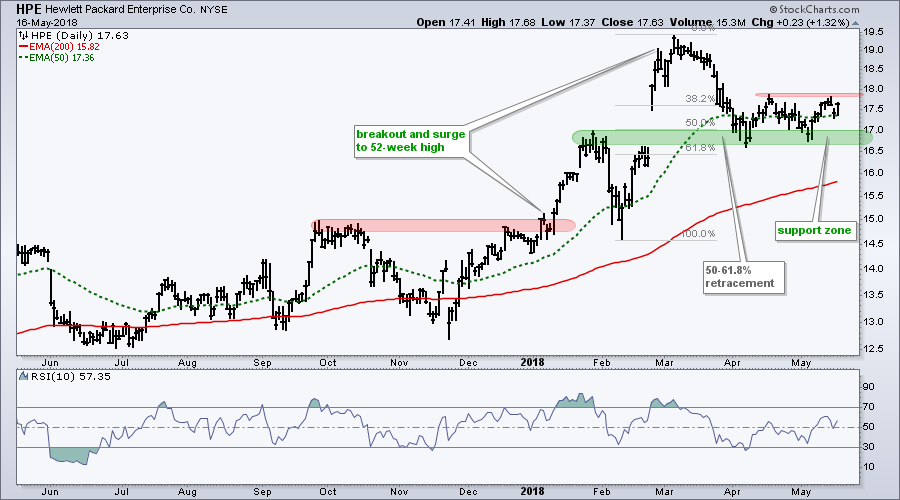
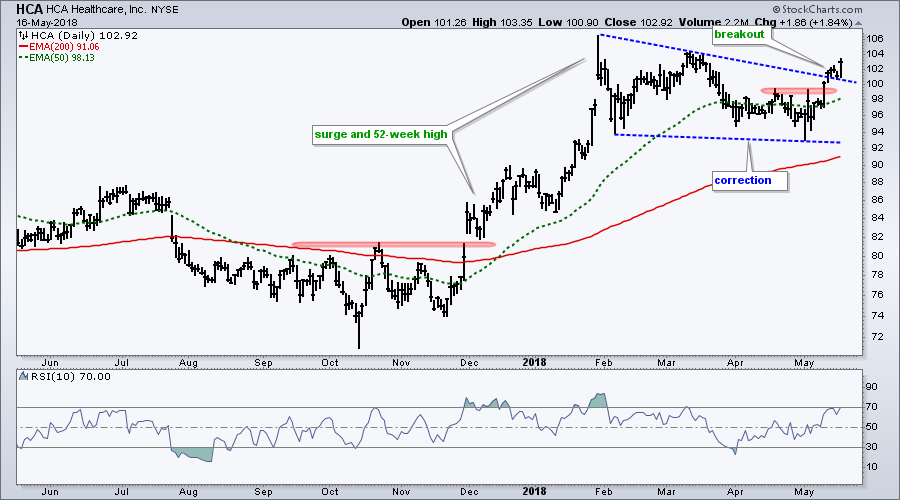
Plan Your Trade and Trade Your Plan.
- Arthur Hill, CMT
Senior Technical Analyst, StockCharts.com
Book: Define the Trend and Trade the Trend
Twitter: Follow @ArthurHill


