- Biotechs Perk Up.
- Average-Cap XBI versus Large-cap IBB.
- IBB Surges off Support.
- XBI Holds Above Support.
- Health Care SPDR Bounces off Retracement Zone.
 Biotechs showed some upside leadership with a big surge last week, most of which occurred on Friday. This group has been lagging the market in 2018, but the Biotech iShares (IBB) is bouncing off a support zone and the Biotech SPDR (XBI) is leading IBB. Today, I will dive into these two groups and also look at the HealthCare SPDR.
The first image shows some of the top performing industry-group ETFs. I created a ChartList of industry group ETFs and then viewed this list in summary format. The three biotech ETFs in this list gained four to five percent and showed some upside leadership last week.
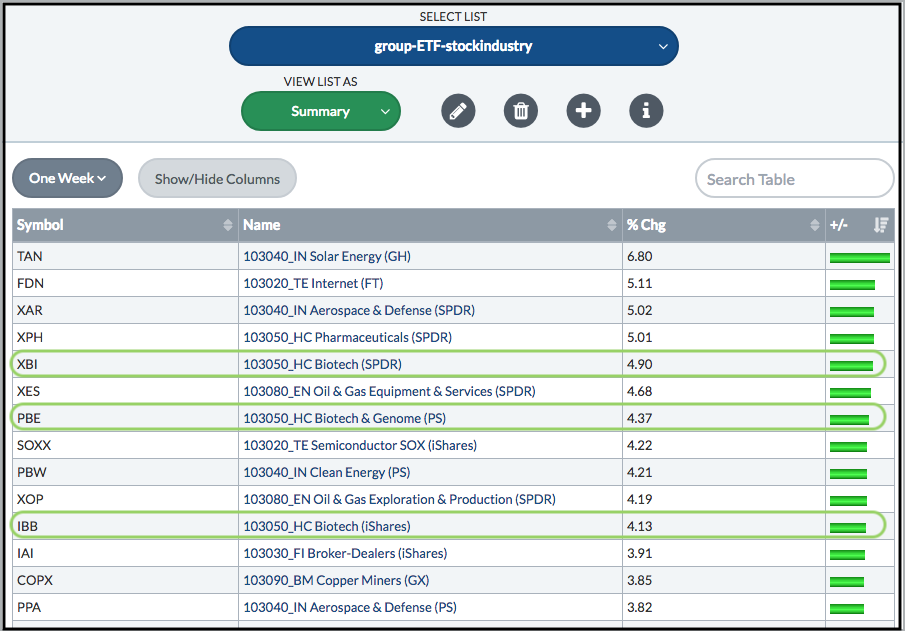 Note that I think Tom Bowley saw something similar because he covered biotechs in his commentary on Monday.
Average-cap XBI versus Large-cap IBB
Before looking at the charts, let's look at the differences between the Biotech iShares (IBB) and the Biotech SPDR (XBI). IBB is dominated by large-cap stocks with the top ten accounting for over 50% of the ETF. Chartists interested in this ETF also need to follow the charts for these stocks because they are the main drivers.
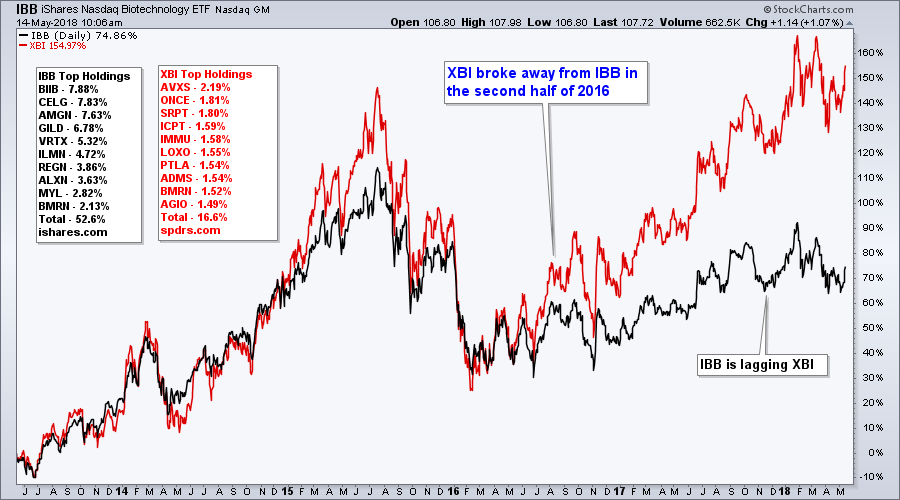
XBI is a different beast because the top ten stocks account for 16.6% of the ETF. XBI also has over 100 stocks, but these stocks are more evenly weighted and this tilts the balance towards small-cap biotechs. This also makes XBI a better representative for biotechs as a whole (small-cap, mid-cap and large-cap).
As you can see from the chart, XBI has outperformed IBB by a considerable margin, especially over the last two years. Notice that XBI broke away from IBB in the summer of 2016 and is up more than twice as much as IBB. Given recent relative performance, the preference would be for XBI.
Large-cap Biotech ETF Surges off Support
The first chart shows IBB with a long-term uptrend (green line) and a correction (red line). I think the long-term trend is up because the ETF hit a new high in January and support in the 100 area is holding. Notice that IBB fell back to the 100 area in February, April and May, but did not break support to forge a lower low.
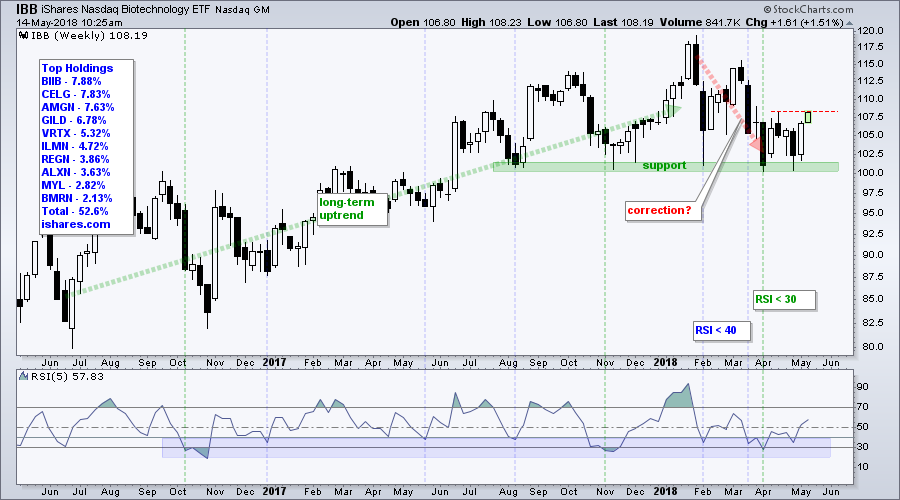
The indicator window shows RSI moving decisively out of this zone and above 50 for an upturn in momentum. On the price chart, IBB looks poised to break its mid April high.
I first highlighted IBB, XBI and XLV in the Weekly Market Review & Outlook on April 27th because the long-term trend was up and RSI was flirting with its oversold zone.
Average-cap Biotech ETF Holds Above Support
The next chart shows XBI, which I am naming the "average-cap" biotech ETF. XBI shows more chart strength because it held above its November-December lows in February and April. Also notice that XBI did not test the February-April lows with the dip into early May, and already exceeded its mid April high (red line).
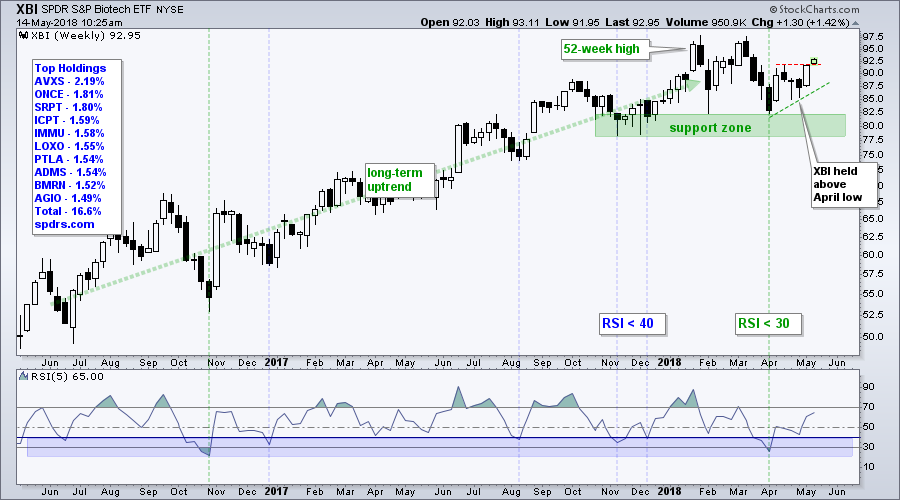
The indicator window shows RSI dipping below 30 in early April for the first time since October 2016. As far as I am concerned, short-term oversold conditions within an uptrend are opportunities to partake in the uptrend at a discount (pullback). RSI has since moved above 60 as momentum turned up the last few weeks.
Health Care SPDR Bounces off Retracement Zone
The Health Care SPDR (XLV) is also getting in on the action with a nice advance last week and a pop on Monday morning. The weekly chart shows a four week surge to new highs in January and then a sharp two week plunge. The ETF firmed for a few weeks and then fell sharply again in mid March.
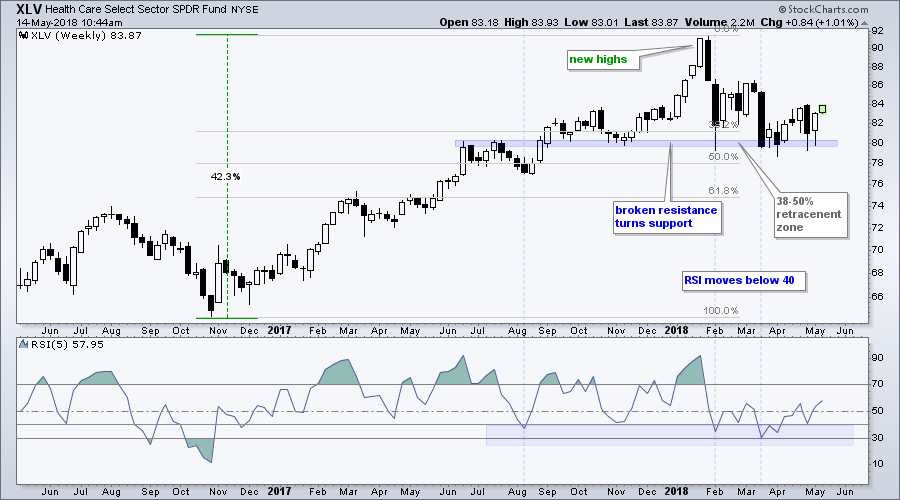
Taken into perspective, the decline from 92 to 80 could be a correction within a bigger uptrend. Notice that broken resistance turned support in the 80 area (blue zone). This area also marks a 38-50% of the prior advance (42 percent). It is quite normal for a correction to retrace one to two thirds of the prior advance. In addition, support in the 80 area is clear and XLV is bouncing off support.
Plan Your Trade and Trade Your Plan.
- Arthur Hill, CMT
Senior Technical Analyst, StockCharts.com
Book: Define the Trend and Trade the Trend
Twitter: Follow @ArthurHill


