- Weighing the Evidence.
- S&P 500 Breaks April High and Reverses Downswing.
- Small-caps Lead with New High.
- Small-caps are Really Really Small.
- Nasdaq 100 Leads New High List.
- Small-cap Sectors Lead.
- Tech, Finance and Industrials Dominate.
- Small-cap Industrials Sector Leads.
- Finance Sector Recovers.
- Notes from the Art's Charts ChartList.
 It is Still a Bull Market....
The market environment is not perfectly bullish, but the weight of the evidence has been bullish and became even more bullish this week.
Note that the S&P 500 SPDR hit a new high in January, the Nasdaq 100 ETF hit a new high in March and the S&P SmallCap iShares hit a new high in May. You can make of this what you will. The bears could point out a non-confirmation in SPY, but the bulls could counter with relative strength in small-caps.
Overall, I view the 2018 trading range in the S&P 500 has a big correction after a massive advance. My breadth indicators turned net bullish in March 2016 and have yet to turn bearish. Here's a video explaining these indicators. The new high in March for QQQ is bullish and techs are again leading in May. The new high in IJR is certainly more bullish than bearish.
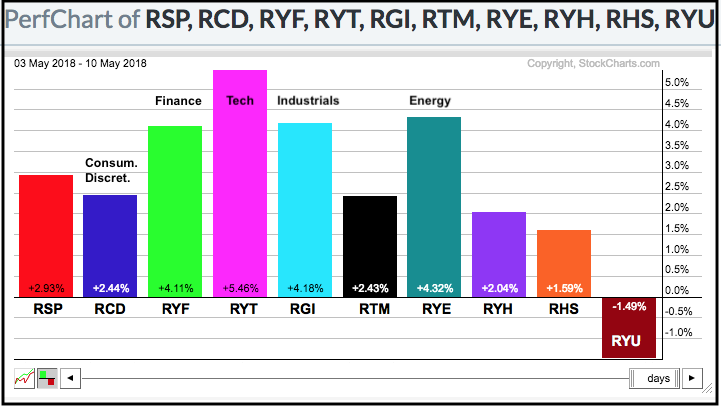
Elsewhere, we saw new highs in several tech-related ETFs and in three key groups, First, the Semiconductor ETF (SOXX) surged around 5% the last five days, while the finance and industrials sectors rebounded sharply. The PerfChart below shows the 5-day performance for the nine equal-weight sectors. Notice that the EW Finance ETF (RYF) and EW Industrials ETF (RGI) recovered and led the market this week. A continued rebound in these two offensive sectors would bode well for the bull market.
The weight of the evidence is clearly bullish for the stock market and we should expect bullish resolutions until this evidence changes. This means dips are opportunities, not threats.

S&P 500 Breaks April High and Reverses Downswing
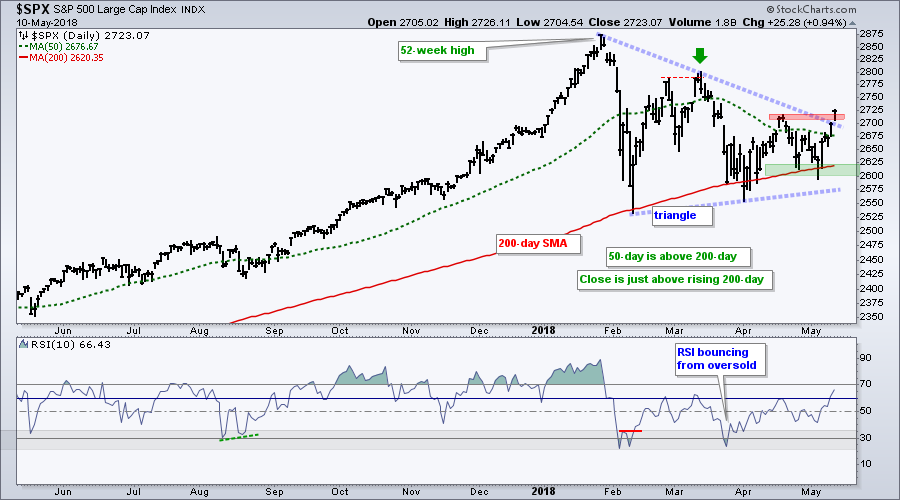
We start with the triangle seen around the world. The S&P 500 is the most widely followed benchmark for US stocks with some $7.8 trillion is benchmarked to this index. I imagine that most of this benchmarked money does not outperform the index though.
In any case, the index bounced off the rising 200-day SMA for at least the third time this year and broke above the April high. This is the first higher high since early March (green arrow). We never know when a breakout will fail, but should treat this breakout as bullish until proven otherwise. Long-term, I will raise key support to 2600 and stay bullish until a close below this level.
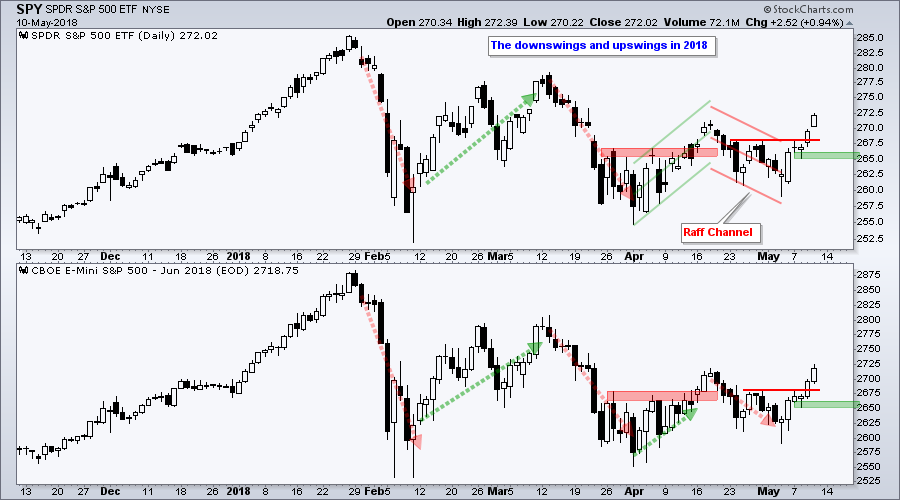
The next chart shows SPY and the E-mini reversing their downswings with breakouts on Wednesday. The green zones mark upswing support at Tuesday's low. These are the first levels to watch for trouble.
Small-caps Lead with New High
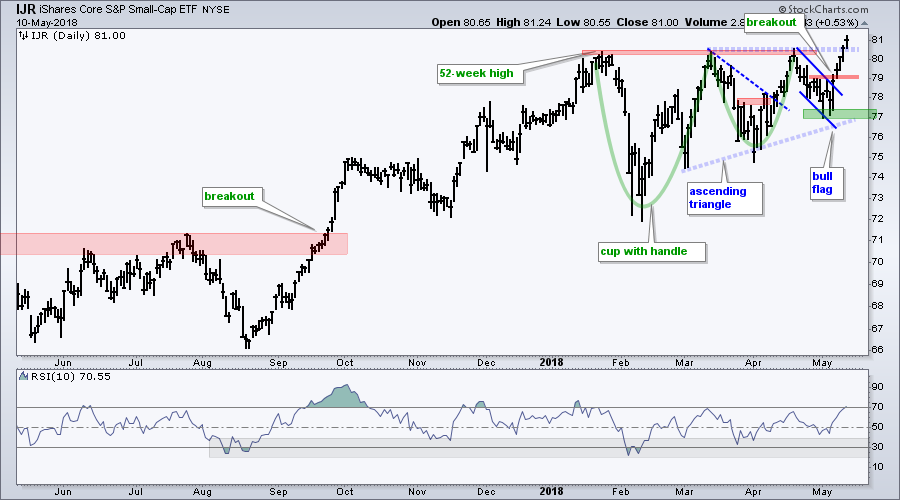
The S&P SmallCap iShares (IJR) is the chart leader because it recorded the most recent 52-week high. I have been watching the bullish continuation patterns develop since early April when I first noted the possibility of a cup-with-handle. This pattern and the ascending triangle give us information on the trend, but they are not always great for trading. Pullbacks and falling flags, in contrast, are good for trading because we can establish positions with a better reward-to-risk profile. IJR broke flag resistance with a breakout at 79 last Friday and I will mark first support at the May low.
Small-caps are Really Really Small
It does not take much to move small-caps because they account for a small sliver of the total US equity market. Note that the total US equity market is around $29.5 trillion and the S&P 500 accounts for about 80% of this total. This gives the S&P 500 a total market cap of $23.6 trillion (source: spindices.com).
For some perspective, the S&P Small-Cap 600 has a total market cap of $813 billion, which is around 3% of the total US equity market. Apple, by comparison, has a market cap of $934 billion. This means you can either own one Apple or the whole S&P 600 (with leftover change!). The S&P Mid-Cap 400 has a total market cap of $1.8 trillion.
Nasdaq 100 Leads New High List
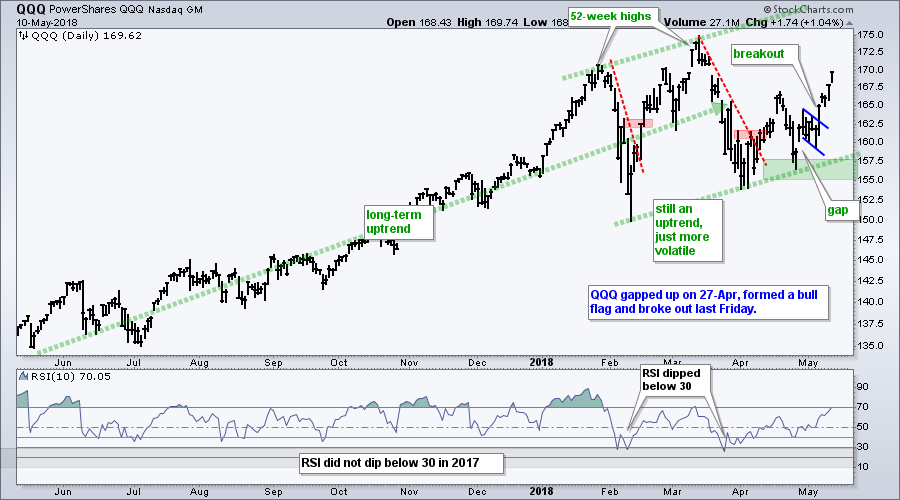
QQQ held above its February low in early April and turned up with a breakout. This breakout was derailed just before Apple earnings, but got back on track with the gap up on April 27th and flag breakout last Friday. QQQ is leading again with a 5% advance the last five days. The Nasdaq 100 is also leading the major indexes in High-Low Percent with a +12% reading on Thursday.
Small-cap Sectors Lead
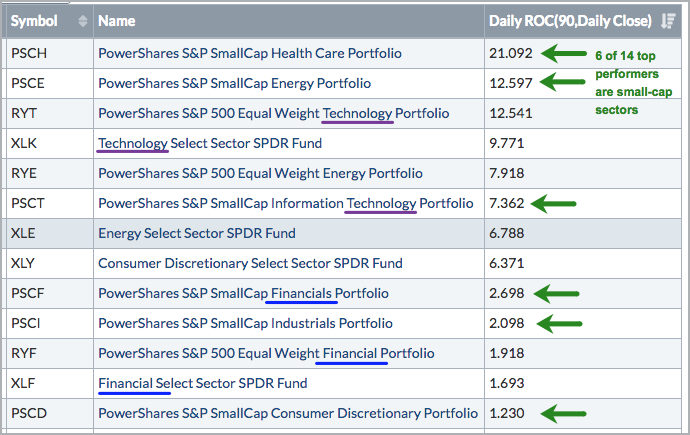
There are three different sector groupings: the large-cap SPDRs, the equal-weight sectors and the small-cap sectors. The table below shows the year-to-date leaders based on the 90 day Rate-of-Change. To keep it uniform, there are 9 sectors in each group and 27 total sectors.
14 of the 27 sectors are up year-to-date, which shows a pretty split market. Of these fourteen, notice that six are small-cap sectors and the top performers are the SmallCap HealthCare ETF (PSCH) and the SmallCap Energy ETF (PSCE). Elsewhere, note that technology (purple lines) and finance (blue lines) are performing well in all three groups.
Tech, Finance and Industrials Dominate
Here are the top two sectors in each group. S&P 500: Technology 24.8% and Finance 14.7%, S&P MidCap 400: Technology 17.1 and Financials 17%, S&P SmallCap 600: Industrials 19% and Financials 17.3%.
The finance sector second largest sector for large-caps (SPY), mid-caps (MDY) and small-caps (IJR). The technology sector is the largest sector for large-caps and mid-caps. The industrials sector is the biggest sector in the S&P SmallCap iShares (IJR) and, therefore, the one to watch.
Small-cap Industrials Lead XLI
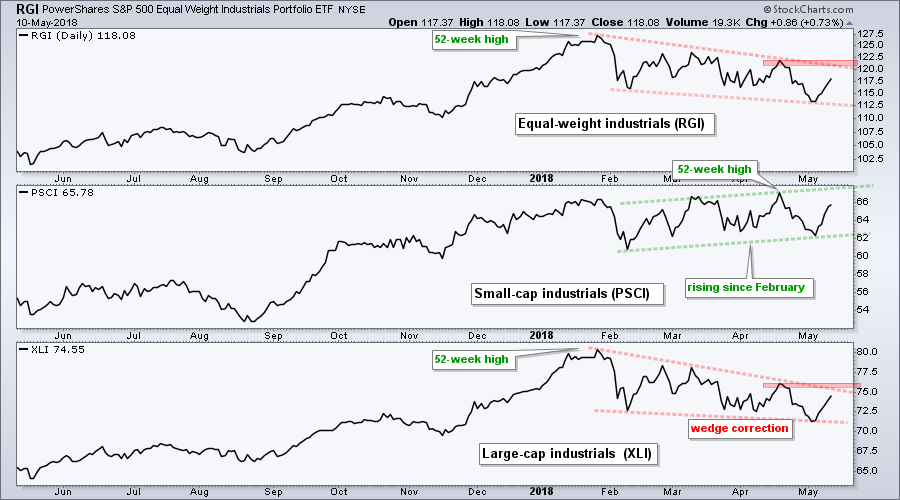
The chart below shows the EW Industrials ETF (RGI), the SmallCap Industrials ETF (PSCI) and the Industrials SPDR (XLI). Even though low volume makes the small-cap and equal-weight sector ETFs untradable, we can use them for analysis of long-term and medium-term trends. PSCI held above its February low and remains in an uptrend, while RGI and XLI are trending lower with falling wedges. These wedges look like corrections within a bigger uptrend and resistance breaks would be bullish.
Finance Sector Recovers
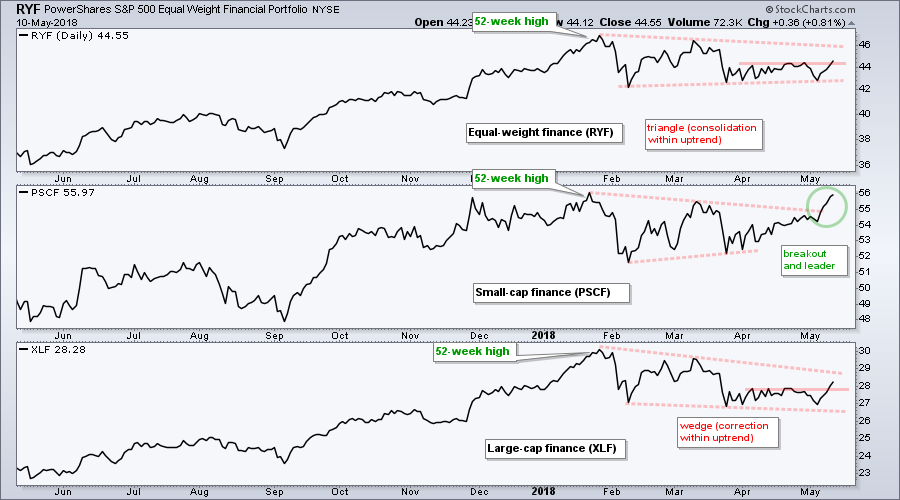
The next chart shows the EW Finance ETF (RYF), the SmallCap Financials ETF (PSCF) and the Financials SPDR (XLF). The middle window shows the PSCF leading with a breakout and surge the last six days. XLF (bottom window) recovered from the prior week's decline and broke above the April high. This week's recovery in the finance sector is positive for the broader market.
Notes from the Art's Charts ChartList
- The Home Construction iShares (ITB) continues to languish near the 2018 lows and show relative chart weakness.
- This week's bounce in the Retail SPDR (XRT) was not inspiring, but the short-term wedge is still rising.
- The Cloud Computing ETF (SKYY), Cyber Security ETF (HACK), Internet ETF (FDN) and Software iShares (IGV) are leading the market with new highs this week.
- The Semiconductor iShares (SOXX) got a strong bounce off support and led the market the last five trading days.
- The Regional Bank SPDR (KRE) extended its six week upswing this week and the Broker-Dealer iShares (IAI) reversed its short pullback with a breakout.
- The Airline ETF (JETS) fell this week and remains one of the weakest ETFs in the market.
- The HealthCare Providers ETF (IHF) looks poised to break flag resistance.
- The Medical Devices ETF (IHI) is leading the market with a new high this week.
- The Oil & Gas Equip & Services SPDR (XES) broke out of a small consolidation and the Alerian MLP ETF (AMJ) broke out of a small falling wedge.
- The Agribusiness ETF (MOO) and Copper Miners ETF (COPX) reversed their downswings, but remain below their April highs and show less chart strength (SPY broke above its April high).
- The Metals & Mining SPDR (XME) is challenging a wedge line and the Steel ETF (SLX) broke out of a small consolidation.
- Click here for the Art's Charts ChartList (updated May 11th).
Plan Your Trade and Trade Your Plan.
- Arthur Hill, CMT
Senior Technical Analyst, StockCharts.com
Book: Define the Trend and Trade the Trend
Twitter: Follow @ArthurHill


