- Gasoline ETF Firms after Pullback
- Notes on RSI Parameters and Levels
- Three Inside Weeks for Gold
- Bollinger Contractions for GLD and GDX
- Dollar Gets Extended
- Unadjusted REIT SPDR Hits Reversal Zone
- Questions, Comments or Feedback?
 ... Gasoline ETF Firms after Pullback
The US Gasoline ETF ($UGA) has a mean-reversion setup working as RSI dipped into the oversold zone and the ETF firmed. There are three parts to a mean-reversion trade. First and foremost, the long-term trend is up. Second, RSI moves into the oversold zone (20-40). Third, there is a short-term bullish trigger. This could be a gap, mini-breakout, bullish candlestick reversal or RSI move above 40.
The chart below shows UGA with all three in place. First, the long-term trend is up because the 50-day EMA is above the 200-day EMA and the ETF hit a new high in mid May. Second, RSI entered the oversold zone with a move below 40 in early June. Third, early signs of a trigger are present as the ETF bounced the last two Wednesdays. Chartists can also look for a mini-breakout at 34.
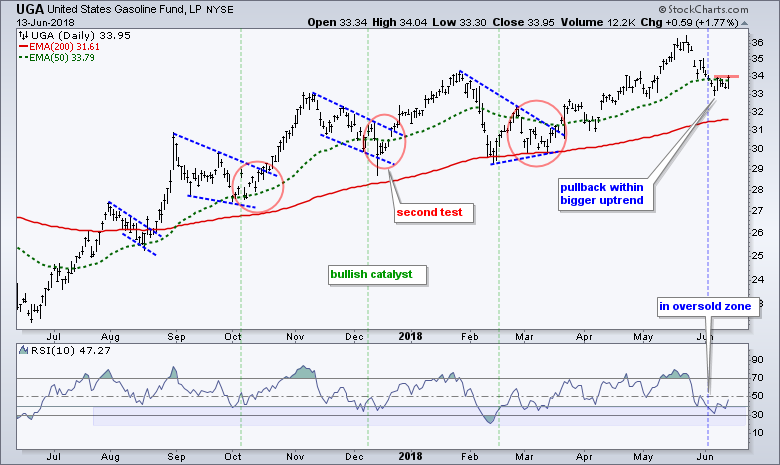
The green vertical lines show prior bullish triggers and the red circles mark subsequent retests. Breakouts are not always clean and there is sometimes a retest of the prior low or even a dip below the prior low. This is why tight stop-losses are not always helpful in this situation.
Notes on RSI Parameters and Levels
I set RSI at 10 periods on a daily chart because this is more sensitive than the default setting, which is 14 periods. A more sensitive setting is more likely to generate oversold readings (<30). Sometimes, however, RSI does not always play nice and dip below 30 for an obvious oversold reading. This is why I use the 20-40 zone as an “oversold” zone. A move below 40 means RSI is in the oversold zone and we should watch price action carefully. Technical analysis is part art and part science.
Three Inside Weeks for Gold
The Gold SPDR (GLD) remains at an interesting juncture as it firms above its December low. The chart below shows weekly prices over the last three years. The trend since December 2016 is up with a series of higher highs and higher lows.
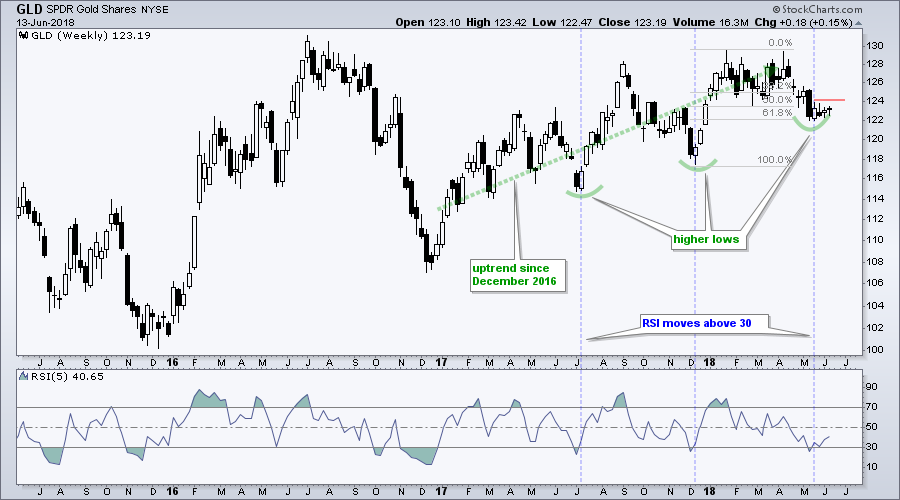
GLD fell back to the 122 area in May and firmed with three inside weeks. This means the high-low range of the last three weeks as been within the high-low range four weeks ago. This week is still a work in progress and subject to change.
Notice that GLD is firming at a potential reversal zone on the price chart and RSI(5) moved above 30 in mid May. The decline to 122 retraced 61.8% of the prior advance and this is a "normal" retracement for a correction within an uptrend. RSI became oversold within an uptrend and this suggests that a mean-reversion opportunity is at hand. The red line on the chart marks first resistance at 124 and this is the level to watch for a breakout.
Bollinger Contractions for GLD and GDX
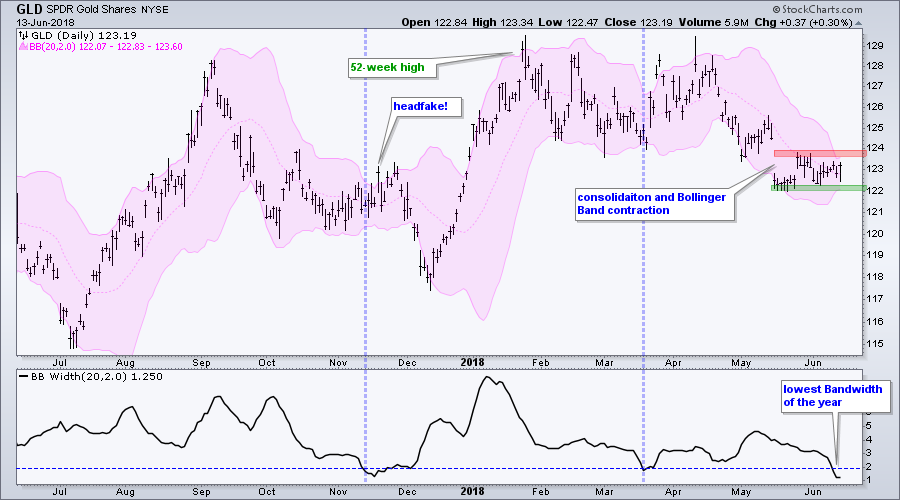
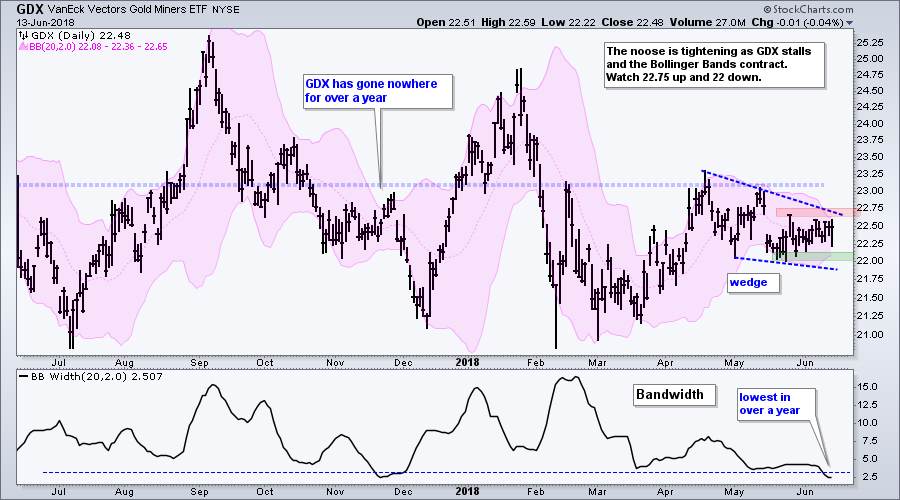
Bandwidth hit its lowest level in over a year for the Gold SPDR (GLD) and the Gold Miners ETF (GDX). The next charts show Bollinger Bands in pink and the Bandwidth indicator, which measures the distance between the bands. GLD has been stuck between 122 and 124 for over four weeks. Watch these levels for the break.
GDX has a falling wedge working since April. A move above 22.75 would break wedge resistance and the upper Bollinger Band, and be bullish. Note that GDX has gone nowhere for over a year and is just below the mid point of its one year range.
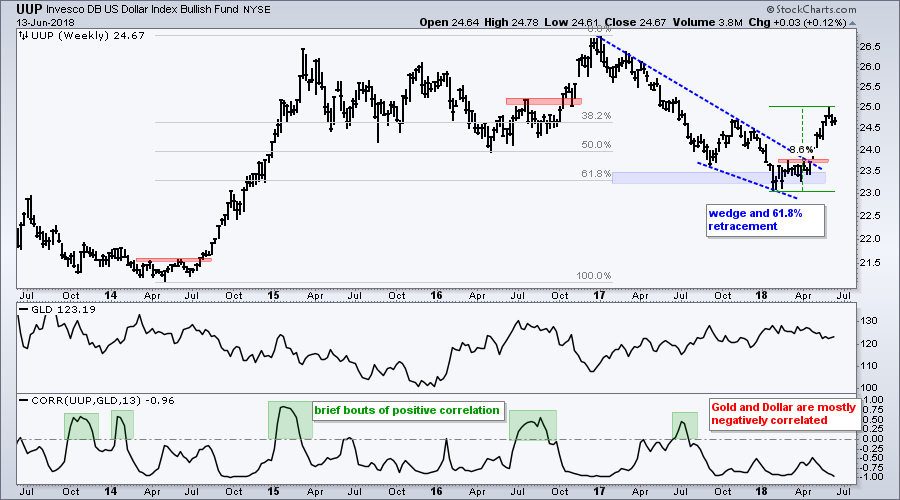
Dollar Gets Extended
It is hard to cover gold without referring to the Dollar. The chart shows the US Dollar ETF (UUP) breaking out with a big surge this year (23 to 25). Notice how UUP firmed in the 61.8% retracement zone before the wedge breakout. The only negative here is the overbought condition after a sharp advance. This could give way to a pullback and a 50% retracement would extend to the 24 area.
Unadjusted REIT SPDR Hits Reversal Zone
The Real Estate SPDR (XLRE) has been rising for four months now, but this advance still looks like a counter-trend move within a bigger downtrend. The chart below shows XLRE with dividend-adjusted prices in the top window and unadjusted prices in the lower window. StockCharts users can precede the symbol with an underscore (_XLRE) to see an unadjusted chart. Dividends make quite a difference for REITs because they have relatively high yields.
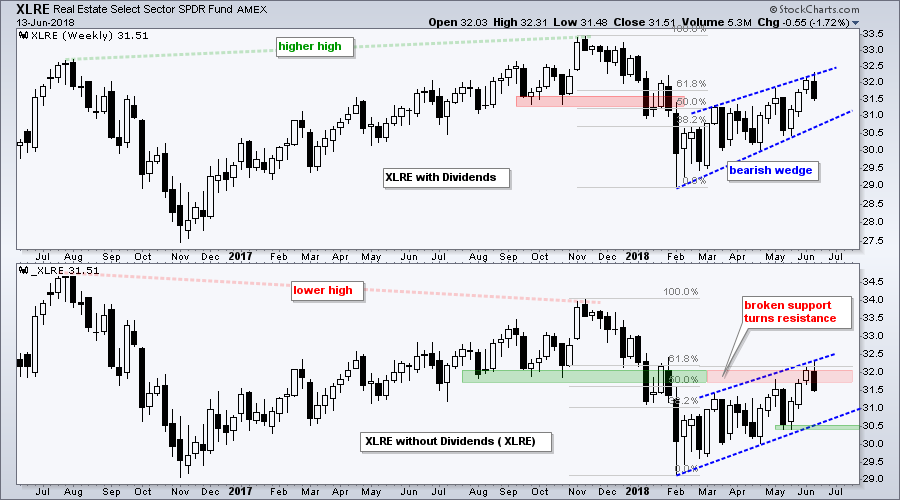
Focusing on the unadjusted chart in the lower window, notice that _XLRE formed a lower high from July 2016 to November 2017 and broke support with a sharp decline in January 2018. The ETF then rallied back to the breakout zone and retraced around 61.8% of the prior decline.
The combination of resistance and the 61.8% retracement make this an ideal spot for a reversal. _XLRE affirmed resistance with a sharp decline this week and the counter-trend bounce may be ending.
Questions, Comments or Feedback?
I cannot promise to response to all correspondence, but I will read it and take into under consideration. I greatly appreciate all feedback because it helps me improve the commentary and provides ideas for the future. Sorry, I do not take symbol requests.

Plan Your Trade and Trade Your Plan.
- Arthur Hill, CMT
Senior Technical Analyst, StockCharts.com
Book: Define the Trend and Trade the Trend
Twitter: Follow @ArthurHill


