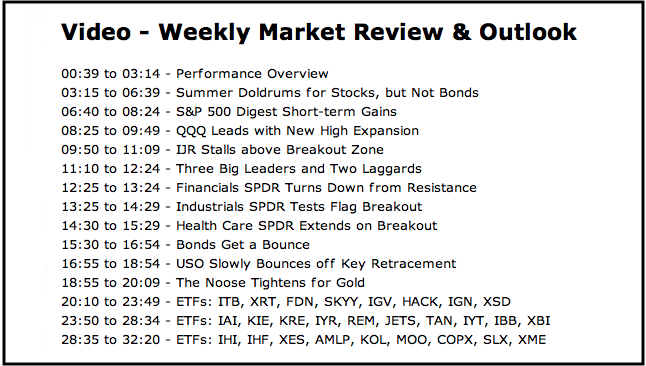
- S&P 500 Digest Short-term Gains.
- QQQ Leads with New High Expansion.
- IJR Stalls above Breakout Zone.
- Three Big Leaders and Two Laggards.
- XLF Turns Down from Resistance.
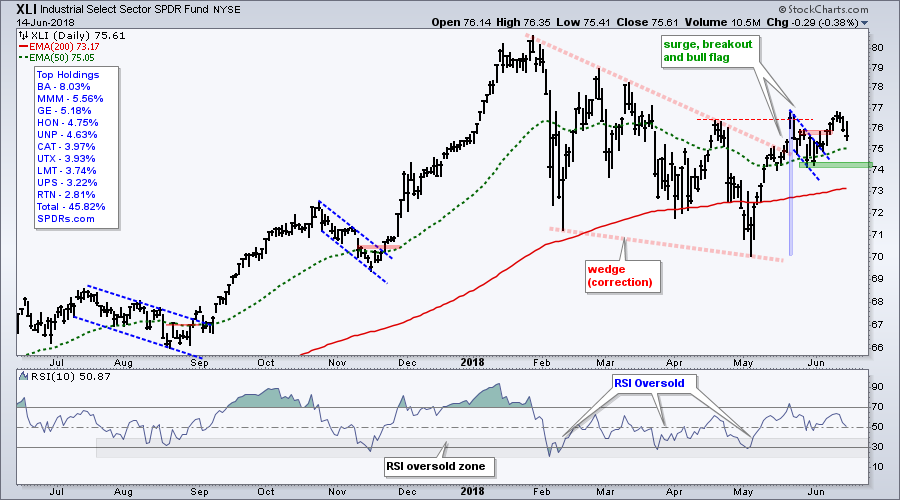
- XLI Tests Flag Breakout.
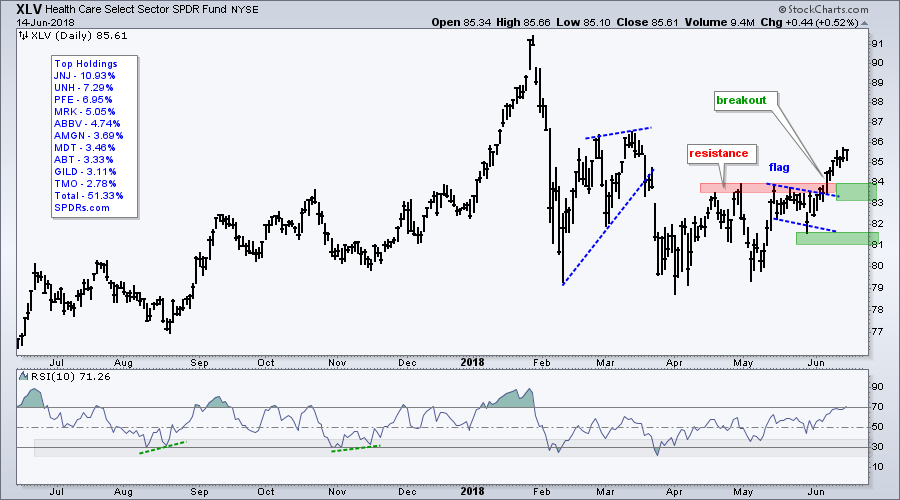
- XLV Extends on Breakout.
- Bonds Get a Bounce.
- USO Slowly Bounces off Key Retracement.
- The Noose Tightens for Gold
- Notes from the Art's Charts ChartList.
 Summer Doldrums for Stocks, but Not Bonds
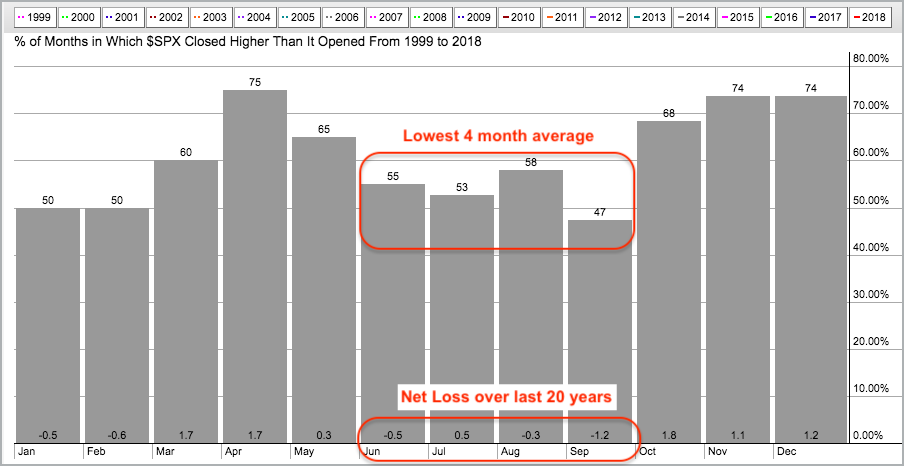
Even though this subject has been discussed ad nauseum, I think seasonal patterns are worth considering as we enter the summer months. At the very least, they can help us set expectations for the next two months. Should prevailing patterns continue, this means we can expect choppy price action in the stock market.
The seasonal patterns show that we are currently in the weakest four month stretch for the stock market. As measured by the S&P 500, the stock market rose 53 to 58 percent of the time in June, July and August. The average gain/loss ranged from +.5% to -.5%, which is not much movement. Based on history, this suggests a slightly better than 50/50 chance of gains over the next 2 months, but the gains are likely to be paltry. A small loss is also possible.
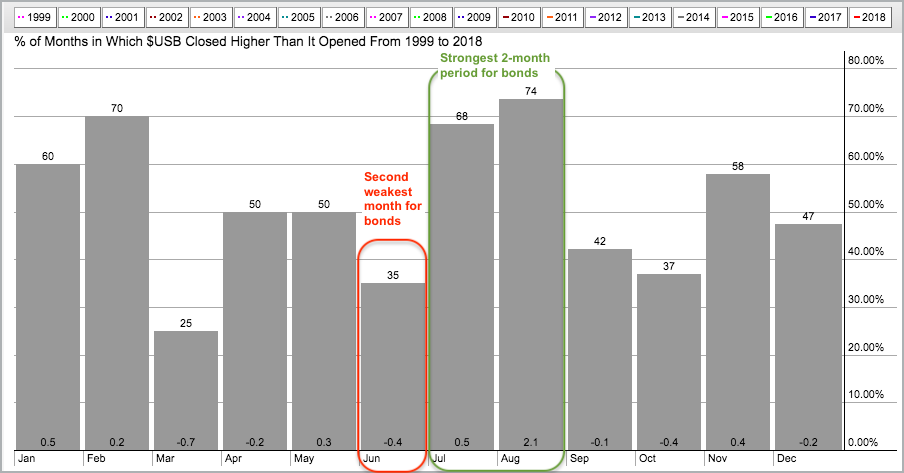
I also ran the seasonality chart for the US 30-year Bond (%USB) and found that June was the second weakest month over the last 20 years. However, July and August are the strongest two month period for Treasuries. Notice that $USB was up 68% of the time in July and 74% of the time in August. Also notice that the average gain in August was a whopping 2.1%. I don't know what is going on here, but bonds could be in for a bounce if history is any guide.
Caveat Emptor! Keep in mind that seasonality is just one tool and it is secondary to price action. In other words, keep seasonal patterns in the back of your mind and price charts at the forefront.
S&P 500 Digest Short-term Gains
The S&P 500 is continuing its surge and digest routine. First, there was a big surge (~35%) from November 2016 to January 2018 and then a three-month digestion phase with a large triangle. The index broke out of the triangle with a surge in early May and then digested these gains with a stall the last three weeks of May. Most recently, the index surged from 2675 to 2785 and then stalled the last few days. We might see some backing and filling, but this looks like a normal rest after a sharp move.
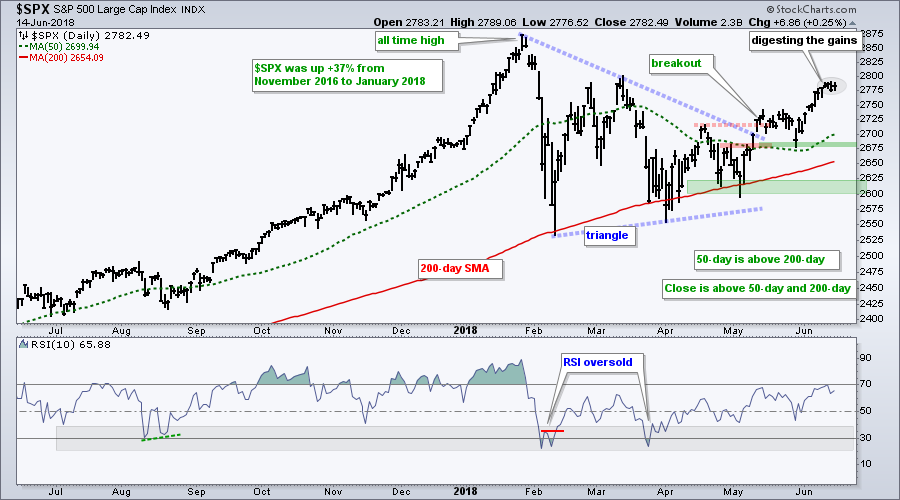 Long-term, the triangle breakout dominates the chart and remains bullish. The breakout zone turned into a support zone and first support is set at 2675. The lows in late April and early May combine to mark key support in the 2600-2625 area.
QQQ Leads with New High Expansion
QQQ led the market again this week with a 1.8% surge. The ETF is up 4.43% for the month and 14.21% for the year, and leading the other major index ETFs. There is nothing to do here except monitor the advance and trail a stop if long.
As far as targets, the advance into the pennant was 9% and a 9% advance from the pennant low would extend to the 182-183 area. It also looks like the upper line of a rising channel may extend to this area. Price targets are highly subjective and secondary actual price action.
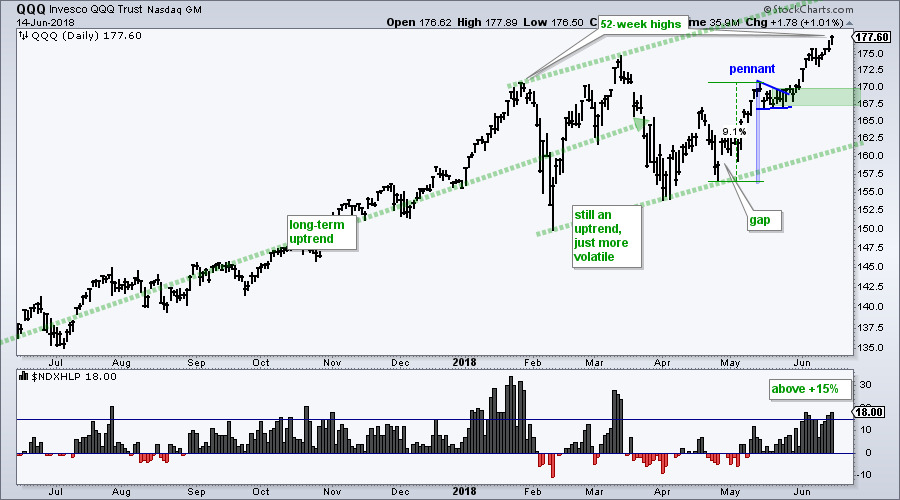 The indicator window shows Nasdaq 100 High-Low% ($NDXHLP) moving above +15% for the fourth time this year. As a percentage of the index, the number of new highs is expanding in the Nasdaq 100 and this shows broadening leadership.
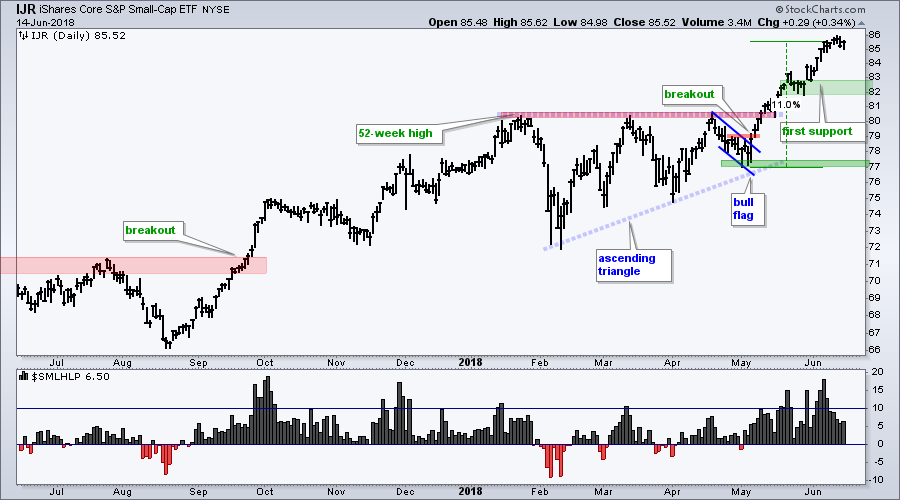
IJR Stalls above Breakout Zone
The S&P SmallCap iShares (IJR) hit a new high the prior week and then stalled the last six days. I am not going to read too much into this stall because the ETF was entitled to a rest after the breakout surge, which was around 11%. The late May consolidation marks first support in the 82-83 area. This is not a zone to watch for a trend changing break down though. Instead, it is a zone to watch for a pullback that could create an opportunity.
Three Big Leaders and Two Laggards
Among the five biggest sectors in the S&P 500, the Consumer Discretionary SPDR (XLY) hit a new high this week and is leading the sector SPDRs. The Technology SPDR (XLK) is not far behind and very close to a new high. These are the clear leaders and these two account for 39% of SPY.
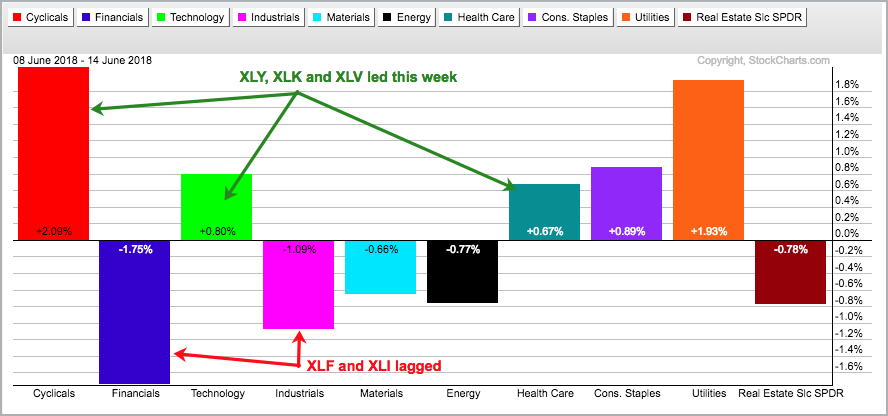 Despite clear leadership from XLY and XLK, the Financials SPDR (XLF) remains a big laggard with a 1.75% loss the last four days. Also notice that the Industrials SPDR (XLI) was down around 1%. The Health Care SPDR (XLV) partially made up for this weakness. Sector Weights in S&P 500: XLK(26.2%), XLF (14.19%), XLV(14.02%), XLY(13.17%) and XLI (9.86%).
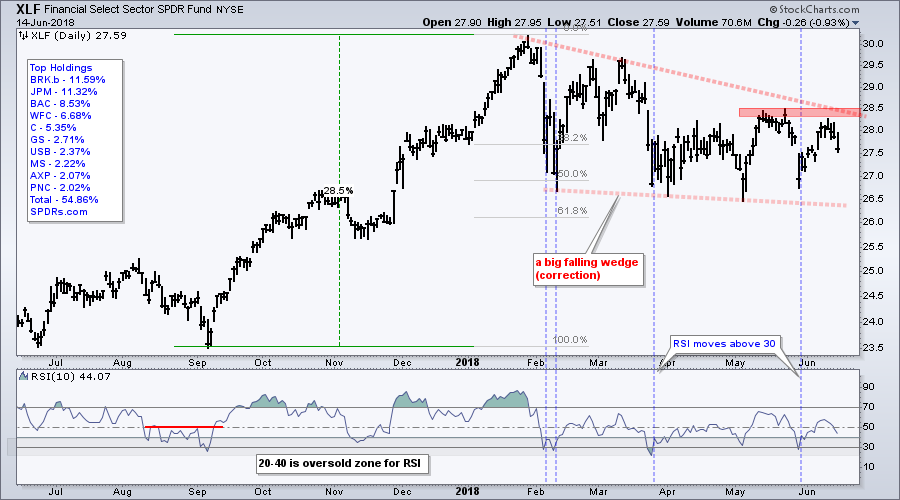
XLF Turns Down from Resistance
The chart below shows the Financials SPDR peaking below its May high and turning down this week. The falling wedge defines the 2018 decline and a breakout at 28.5 is needed to reverse this downtrend. Even though I think it is a correction after a big advance, this downtrend is going on four months and XLF shows some serious relative weakness.
XLI Tests Flag Breakout
The Industrials SPDR broke the wedge line in late May and broke flag resistance in early June. These breakouts are still valid, but XLI is having difficulty with the follow through after this week's decline. The flag lows mark first support to watch for a complete failure. A break below 74 would negate the flag breakout and invalidate the wedge breakout. Such a move could also spell trouble for the broader market.
XLV Extends on Breakout
The Health Care SPDR (XLV) is the third strongest of the big five sectors. The ETF broke out in early June and extended on this breakout with further gains over the last four days. The breakout zone turns first support in the 82-83 area. Key support is set at 81 for now.
Even though three of the top five sectors look strong, XLF is weak and XLI is looking vulnerable. Also keep in mind that XLK and XLY are looking extended and ripe for a corrective period. Throw in some summer doldrums and the S&P 500 could easily stay range bound the next two months.
Bonds Get a Bounce
The 7-10 YR T-Bond ETF (IEF) and the 20+ YR T-Bond ETF (TLT) broke their wedge/flag lines with bounces on Thursday. Even though the long-term trends are down with the spring highs marking resistance, note that the flag/wedge breakouts signal a continuation of the late May surge. This means we could soon see a challenge to the spring highs.
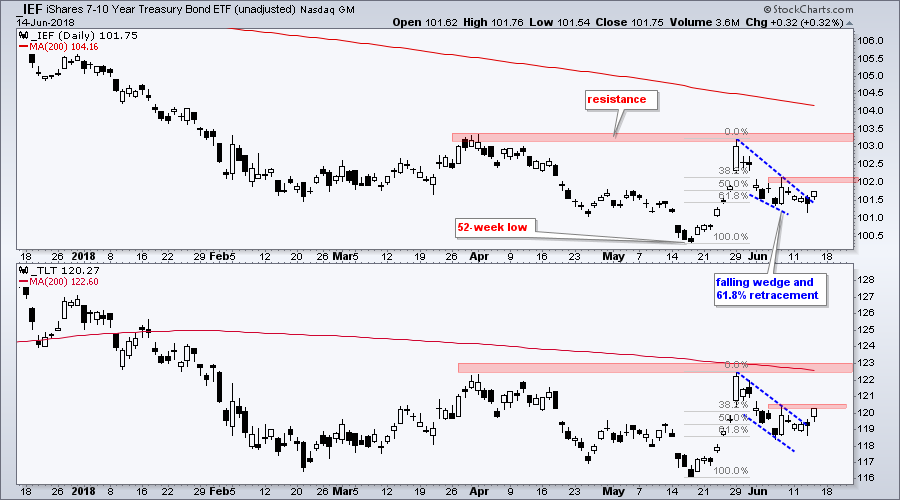
A bounce in bonds would be negative for banks, and positive for utilities and REITs. Also note that a bounce in bonds would show money moving to safe-haven assets and this could take money from riskier assets, such as stocks.
On Trend on Youtube
Note that I covered the 20+ YR T-Bond ETF (TLT), the Financials SPDR (XLF) and the correlations in Tuesday's show, On Trend. Each show is archived on our Youtube channel.
Topics for Tuesday, June 12th:
- Airlines Have yet to Take Off (Raff Channel Tutorial).
- Mean-Reversion Setup for Oil ($WTIC, USO).
- XES Hits Moment-of-truth as XLE Holds Gap (plus AMLP, CVX, SLB).
- XLF and Big Banks Remain Weaklings (C, BAC, GS, MS, USB).
- Treasury Bonds Firm as Fed Meeting Looms.
- Stocks to Watch: HON, UTX, CSCO, GPN, MSI, PFPT, SNPS, AET, MDT.
- Click Here to Watch
USO Slowly Bounces off Key Retracement
The USO Oil Fund (USO) edged higher over the last eight days and the oversold bounce is looking a little feeble. The concern here is that the bounce turns into a rising flag, which is a short-term bearish continuation pattern. A flag break would signal a continuation of the May decline and we could then see another leg lower in oil. For now, the flag is rising and the mean-reversion play remains. A close below 13.2 would call for a reassessment.
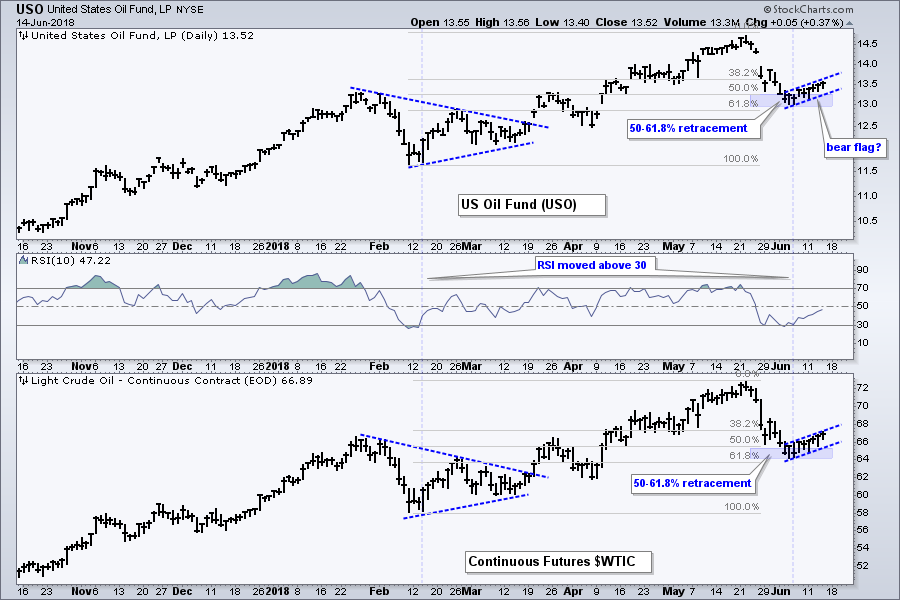
I featured the US Gasoline ETF ($UGA) on Thursday with a mean-reversion setup. A reader alerted me to the low volume and this makes it difficult to trade. Thank for the heads up and sorry for that oversight. USO and UGA have been strongly correlated since October so perhaps USO is the vehicle here.
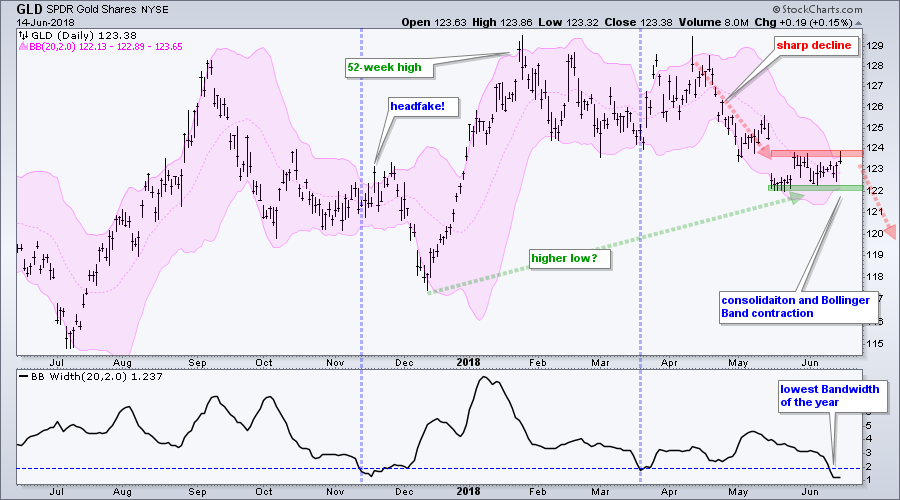
The Noose Tightens for Gold
Despite a big surge in the Dollar, the Gold SPDR (GLD) finished with a small gain and remains within a tight consolidation. The weekly chart shows a higher low from December to June and this means an upside breakout is possible. The daily chart shows a sharp decline from late April to late May and this means a downside break is possible. The Bollinger Bands just tell us that volatility is contracting and to expect a volatility expansion. As chartists, we can just watch the range and play the break.
Notes from the Art's Charts ChartList
- The Home Construction iShares (ITB) broke its May high and then pulled back. This could be the start of a trend reversal.
- The Cloud Computing ETF (SKYY), Cyber Security ETF (HACK), Internet ETF (FDN), Semiconductor SPDR (XSD) and Software iShares (IGV) led the technology sector with new highs again this week.
- The Broker-Dealer iShares (IAI) is consolidating at a triangle line.
- The Solar Energy ETF (TAN) held above its February low and turned up after RSI became oversold.
- The Transport iShares (IYT) extended its breakout with a surge this week, but the Airline ETF (JETS) remains in a downtrend and weak.
- Big biotechs remained strong as the Biotech iShares (IBB) extended on its flag breakout.
- The Oil & Gas Equip & Services SPDR (XES) continues to struggle as it fell four days this week.
- The Copper Miners ETF (COPX) is failing at resistance with a sharp downturn this week.
- The Metals & Mining SPDR (XME) formed a small bull flag the last six days.
- Click here for the Art's Charts ChartList
Questions, Comments or Feedback?
I cannot promise to response to all correspondence, but I will read it and take into under consideration. I greatly appreciate all feedback because it helps me improve the commentary and provides ideas for the future. Sorry, I do not take symbol requests.

Plan Your Trade and Trade Your Plan.
- Arthur Hill, CMT
Senior Technical Analyst, StockCharts.com
Book: Define the Trend and Trade the Trend


