- Two Breakout Zones to Watch on SPY.
- On Trend Preview.
- TLT Affirms Resistance.
- Banks and Utilities Cue off Bond Market.
- Finance Sector and Big Banks Continue to Lag.
- Aetna Breaks Out of Bull Flag.
- Questions, Comments or Feedback?
 Two Zones to Watch on SPY
...The S&P 500 SPDR (SPY) broke out twice in the last two months and these zones now mark support levels going forward. A basic tenet of technical analysis is that broken resistance turns into support. SPY broke a resistance zone in the 268-271 area in early May and this zone turned into support in late May. With a successful test in late May, this is the first major support zone to watch going forward.
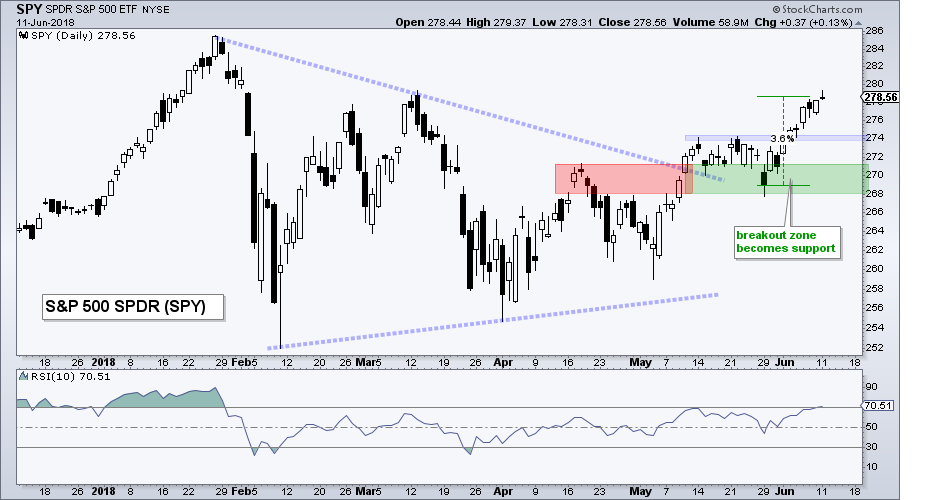
The ETF also broke resistance in the 274 area in early June and this area turns short-term support. SPY surged over 3.5% the last two weeks and is a bit overbought as RSI edged above 70 for the first time since January. A throwback to the breakout zone would alleviate this condition and could provide an opportunity.
On Trend Preview
The next charts represent a preview for today's show, On Trend. This show airs on Tuesdays at 10:30AM ET on StockCharts TV and repeats throughout the week at the same time. Each show is then archived on our Youtube channel.
Topics for Tuesday, June 12th:
- Airlines Have yet to Take Off (Raff Channel Tutorial)
- Mean-Reversion Setup for Oil ($WTIC, USO)
- XES Hits Moment-of-truth as XLE Holds Gap (plus AMLP, CVX, SLB)
- XLF and Big Banks Remain Weaklings (C, BAC, GS, MS, USB)
- Treasury Bonds Firm as Fed Meeting Looms
- Stocks to Watch: HON, UTX, CSCO, GPN, MSI, PFPT, SNPS, RSG, AET, MDT
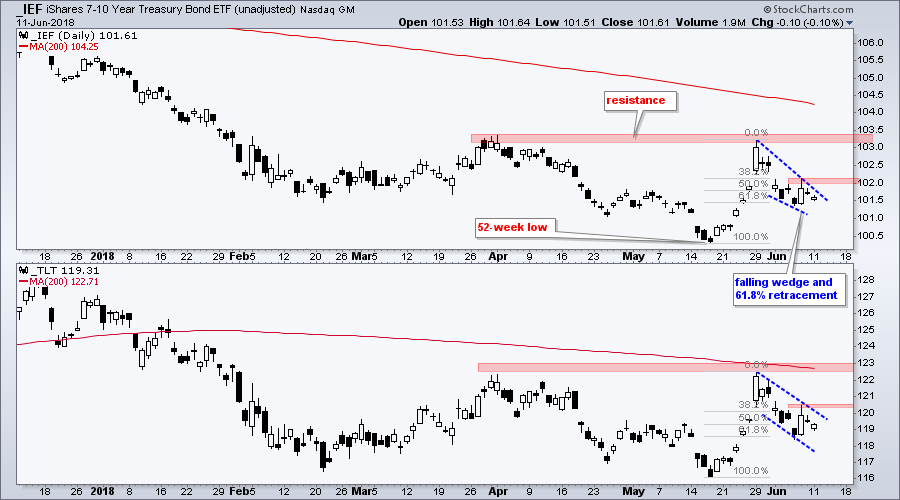
Treasury Bond ETFs Affirm Resistance
The Fed starts its two-day meeting today and will make a policy statement tomorrow afternoon. This could increase volatility in the bond market and affect interest-rate sensitive groups, such as banks, utilities and REITs.
The 20+ YR T-Bond ETF (TLT) and the 7-10 YR T-Bond ETF (IEF) remain in long-term downtrends, but I am watching short-term resistance for the first sign of a reversal. The chart below shows IEF and TLT hitting new lows in mid May and affirming resistance in late May. Both fell back the last two weeks and retraced around 61.8% of the May bounce. These pullbacks could be corrective because the retracement amount and patterns are typical for corrections. A break above last week's high would end the correction and be short-term bullish. Such a move would argue for a challenge to the bigger resistance levels.
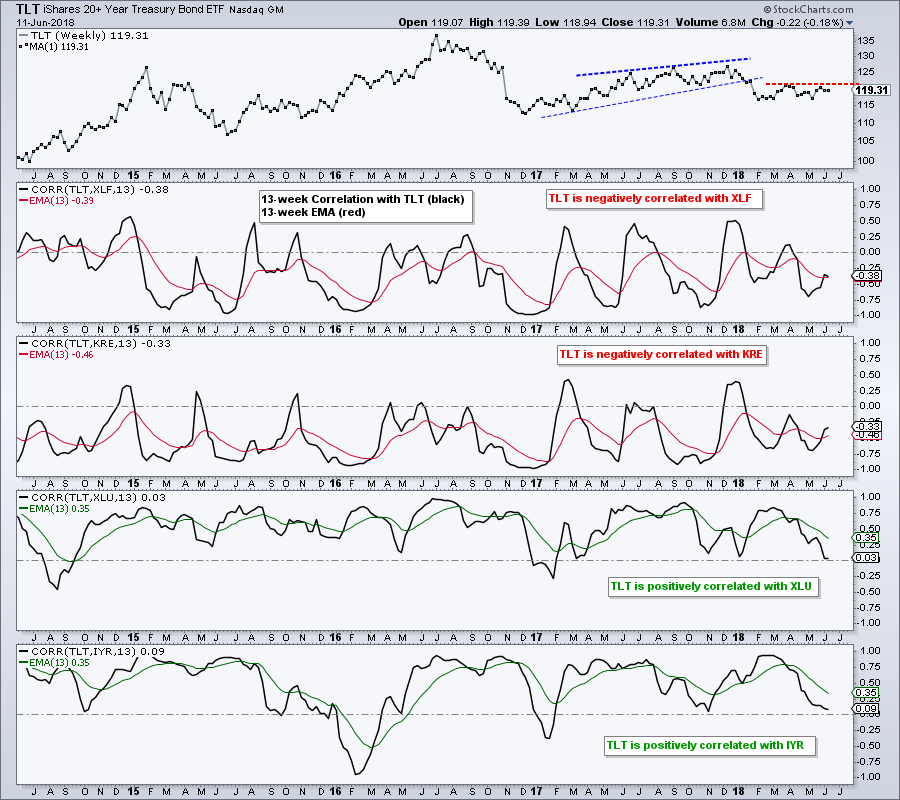
Banks and Utilities Cue off Bond Market
Chartists should watch TLT because it affects banks, utilities and REITs. The chart below shows TLT with the Correlation Coefficient for the Financials SPDR (XLF), Regional Bank SPDR (KRE), Utilities SPDR (XLU) and REIT iShares (IYR). XLF and KRE are positively correlated with TLT and tend to move in the same direction. XLU and IYR are negatively correlated and tend to move in opposite directions. Based on these correlations, an upside breakout in TLT would be negative for banks (XLF and KRE), but positive for utilities (XLU) and REITs (IYR).
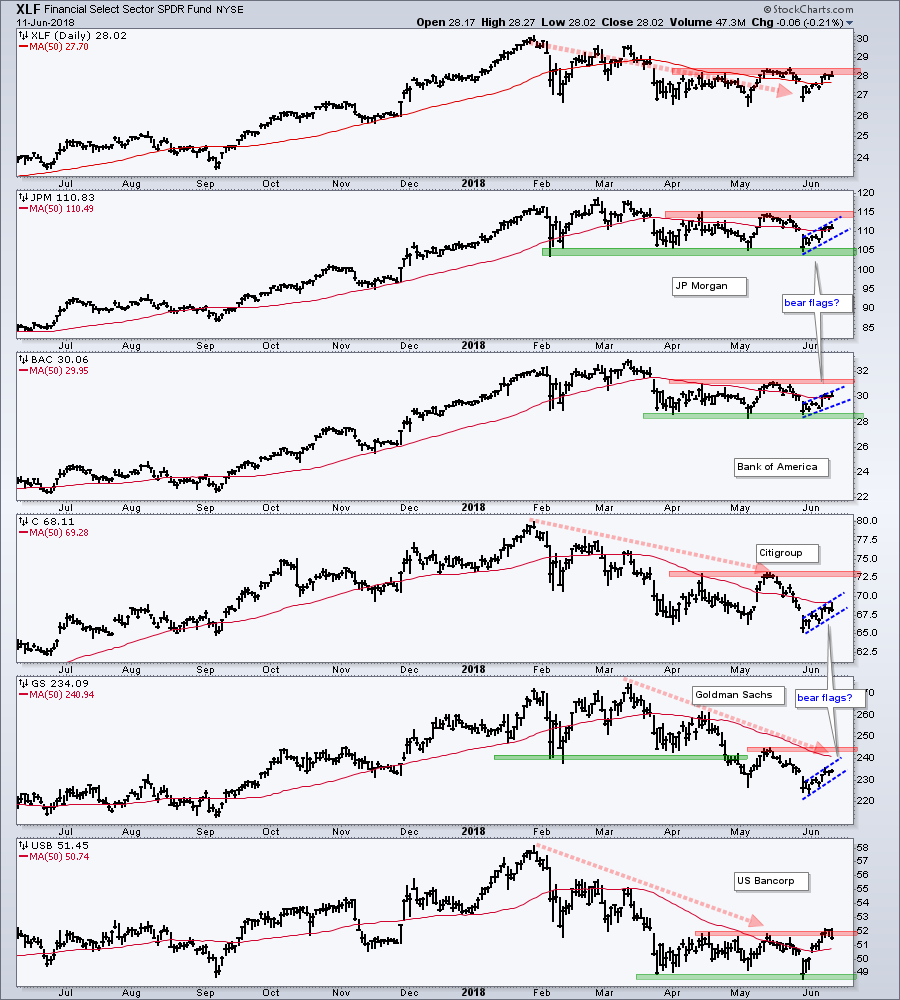
Finance Sector and Big Banks Continue to Lag
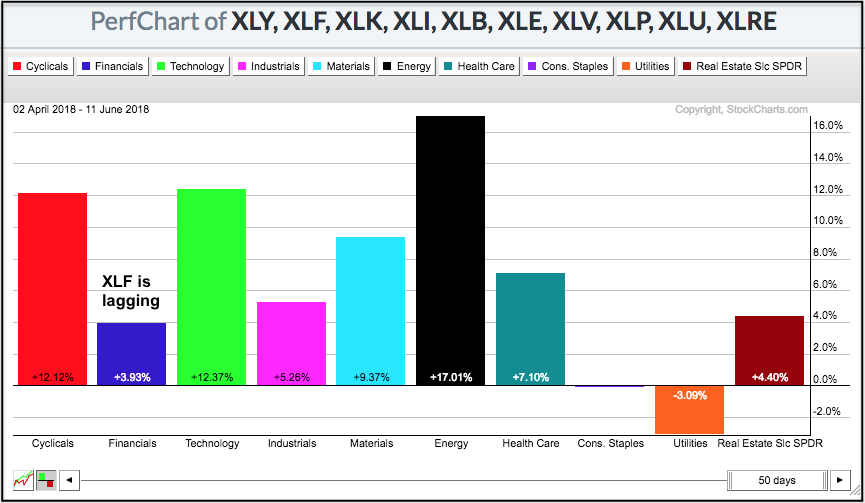
SPY bottomed on April 2nd and is up around 8% since this low (49 trading days ago). Using this timeframe, I created a sector PerfChart to compare performance during this upswing. Note, you must add a day and enter 50 days on the PerfChart.
The Consumer Discretionary SPDR (XLY), Technology SPDR (XLK) and Energy SPDR (XLE) are leading with double digit gains. The Materials SPDR (XLB), Industrials SPDR (XLI) and Health Care SPDR (XLV) are up less than SPY, but performing okay with 5-7% gains. The Financials SPDR (XLF) is lagging these six sectors with a 4% gain.
The next chart shows XLF and five big banking stocks. JP Morgan, Bank of America and US Bancorp are stuck in consolidations. Upside breakouts in at least two of the three would be bullish for XLF, while downside breaks would be bearish. Citigroup and Goldman are in downtrends with lower lows in late May. Notice that the first four stocks on the chart could be forming bear flags that last two weeks and breaks would be short-term bearish. Watch TLT for clues.
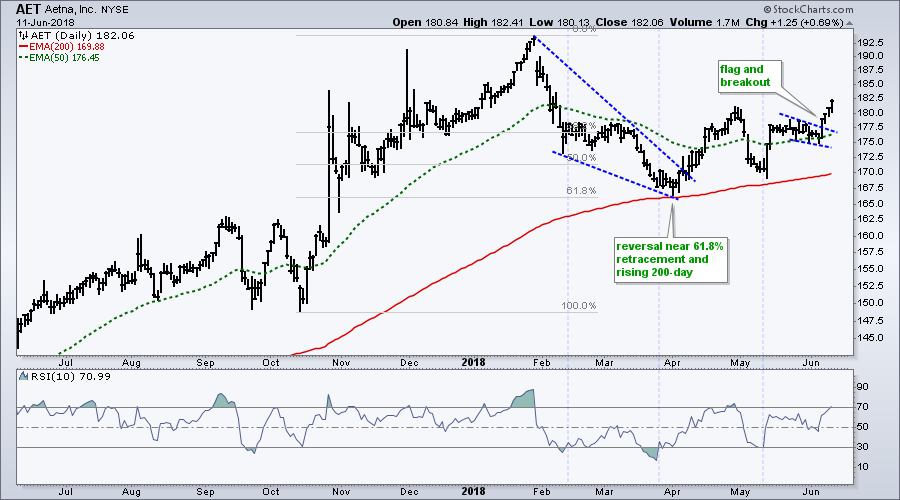
Aetna Breaks Out of Bull Flag
The HealthCare Providers ETF (IHF) is one of the stronger groups, but Aetna has been lagging and remains well below its January high. That could change as the stock broke out of a flag with a four day surge. Prior to this breakout, notice how the stock bounced off the 61.8% retracement and rising 200-day EMA in late March and broke out of a falling wedge.
Questions, Comments or Feedback?
I cannot promise to response to all correspondence, but I will read it and take into under consideration. I greatly appreciate all feedback because it helps me improve the commentary and provides ideas for the future. Sorry, I do not take symbol requests.

Plan Your Trade and Trade Your Plan.
- Arthur Hill, CMT
Senior Technical Analyst, StockCharts.com
Book: Define the Trend and Trade the Trend
Twitter: Follow @ArthurHill


