- Measuring Participation during a Big Move.
- The State of the Market
- QQQ Nears First Support Test
- IJR Corrects after Big Move
- XLV Stocks Versus XLF Stocks
- StockCharts TV and On Trend.
 ... Measuring Participation during a Big Move
... AD Percent is the first breadth indicator I check after a big up or down day in the stock market. AD Percent equals Advances less Declines divided by Total Issues. It is the percentage of Net Advances. StockCharts computes and publishes this indicator for the major indexes and sectors.
The chart below shows AD Percent for the S&P 500, S&P Mid-Cap 400 and S&P Small-Cap 600 with horizontal lines at +70% and -70%. The green arrows mark bullish breadth thrusts that reflect broad upside participation, while the red arrows mark bearish thrusts that reflect broad downside participation.
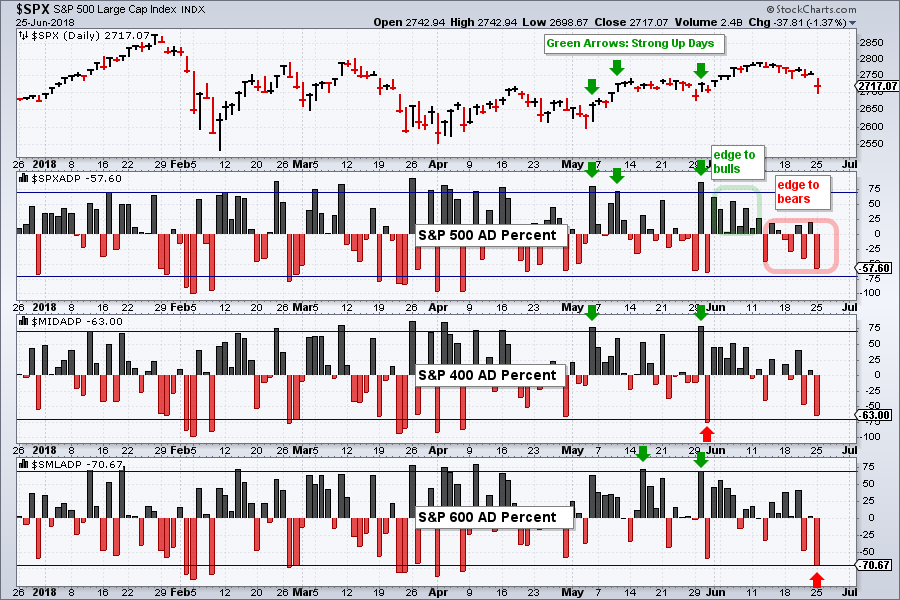
There were several (seven) bullish breadth thrusts in May and one bearish thrust. Breadth in June has been relatively tame with the bulls getting a slight edge the first two weeks and the bears the last two weeks. S&P SmallCap AD Percent ($SMLADP) was the only indicator to plunge below -70% yesterday as small-caps bore the brunt of selling pressure.
AD Percent for the S&P 500 and S&P Mid-Cap 400 did not exceed -70% and this shows that downside participation was somewhat contained. However, the bulls have not shown much muscle since late May. Until we see bullish breadth thrusts from two of the three indexes, these indicators point to sideways price action or perhaps even a correction in the broader market.
The State of the Market
While I still think the bull market remains intact, there are some weak under currents that could give us a summer of discontent. I am not looking for a bear market and will definitely not try to predict a top. However, flatness in the S&P 500, weakness in finance and industrials, and negative seasonal patterns point to a correction. This may be a good time to oil that fishing reel, dust off that tennis racquet and enjoy a little summer (sans markets). Here are some notes:
- The S&P 500 is in the middle of its 2018 range and up just 1.63% year-to-date.
- The S&P SmallCap iShares (IJR) and Nasdaq 100 ETF (QQQ) are leading this year with 10% gains, but ripe for a corrective period, which may have just started.
- The Industrials SPDR (XLI) and Financials SPDR (XLF) are lagging badly and down 3-5% year-to-date.
- The Consumer Discretionary SPDR (XLY) led the new low list as High-Low Percent reached -9%.
- Seasonal patterns for stocks are negative until the end of September.
- Seasonal patterns for Treasury bonds are positive in July and August.
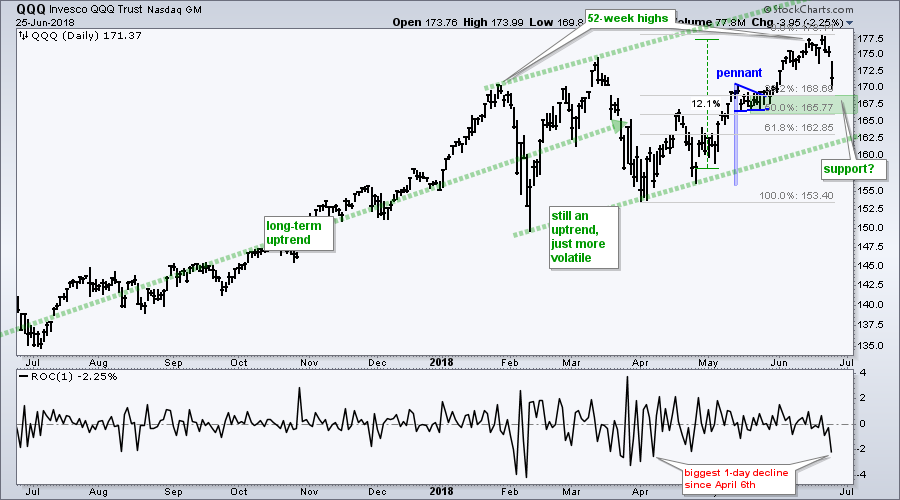
QQQ Nears First Support Test
QQQ was hit hard on Monday with a gap down and the largest one-day decline since April 6th. This is not enough to derail the bigger uptrend and a support zone is coming into play. First, the pennant consolidation marks support in the 166-169 area. Second, the 38-50% retracement zone is a potential reversal area in the 165.7-168.7 area. Taken together, the green zone is the first area to watch for a bounce.
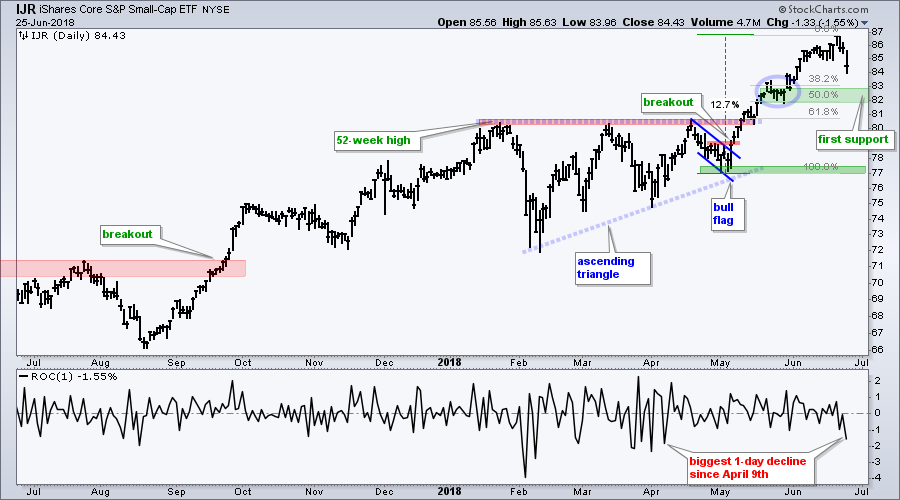
IJR Corrects after Big Move
The S&P SmallCap iShares (IJR) surged some 12% from early May to mid June and hit a 52-week high. The index is entitled to a pullback after such a move and we can now guestimate the first support zone. Yes, these are guesstimates. I generally apply the Fibonacci retracements tool and look for price support to estimate support. On the IJR chart, the late May consolidation and 38-50% retracement zone mark potential support in the 82-83 area.
A note on Fibonacci: I do not use the Fibonacci numbers per se, and I don't think there is anything magical about the golden ratio when it comes to the markets. The 38.2% and 61.8% retracements and are, after all, pretty close to the 1/3 and 2/3 retracements proffered by Charles Dow. 50% is in the middle of both and represents the base case for a retracement.
Overall, these retracement numbers provide general guidelines when it comes to estimating the length of a correction. Personally, I raise my alert level when a correction enters the 38%-62% zone. This is when I start looking for signs of strength and/or an end to the pullback. See this ChartWatchers article for more details on Fibonacci and Dow.
XLV Stocks Versus XLF Stocks
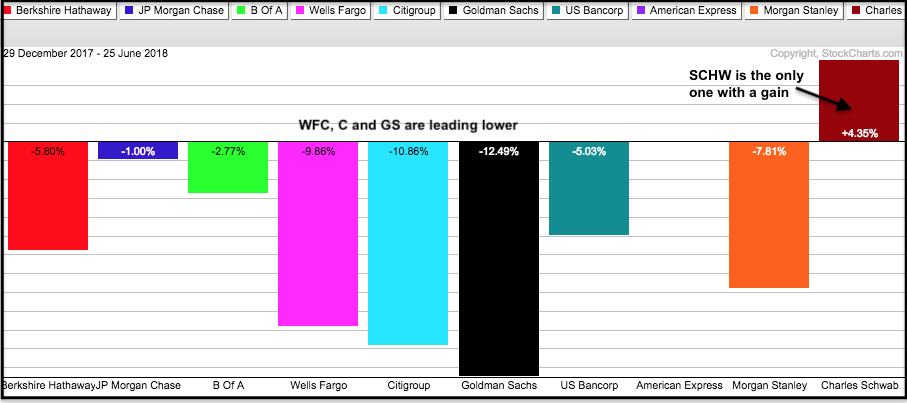
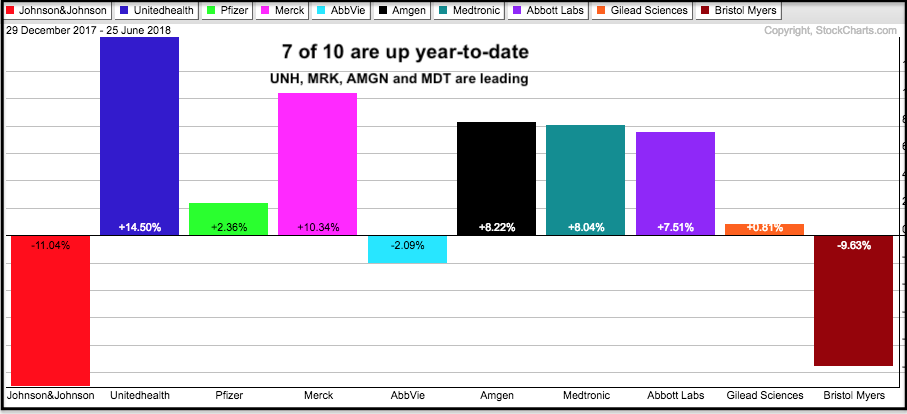
The two PerfCharts show year-to-date performance for the top ten stocks in the Financials SPDR (XLF) and the Health Care SPDR (XLV). Nine of the ten stocks in XLF are DOWN year-to-date with Goldman (GS), Citigroup (C) and Wells Fargo (WFC) leading lower. Seven of ten stocks are UP in XLV with United Health (UHN), Merck (MRK), Amgen (AMGN) and Medtronic (MDT) leading higher.
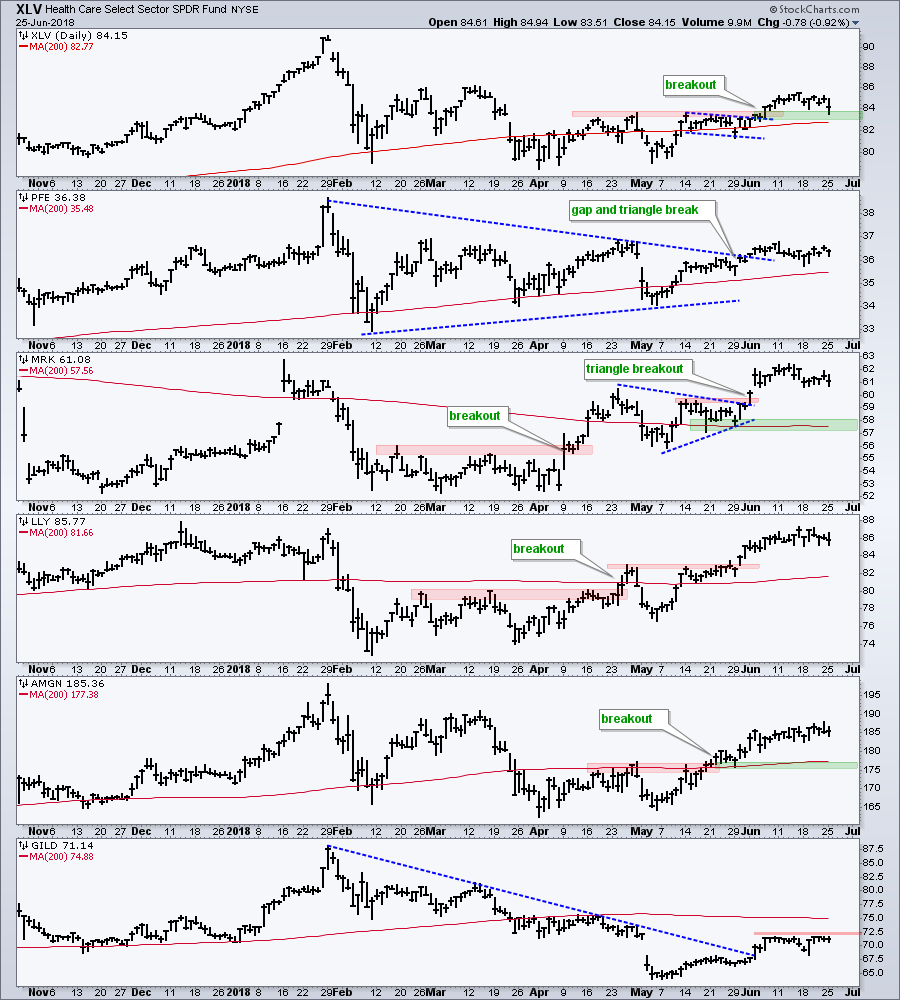
The next two charts show five key stocks in each sector with the 200-day SMA. XLV is above its 200-day SMA and above its May high. Thus, the breakout is still holding. In addition, four of the five stocks are above their 200-day SMAs. The fifth stock, Gilead, held up quite well yesterday and a breakout at 72.5 would be bullish.
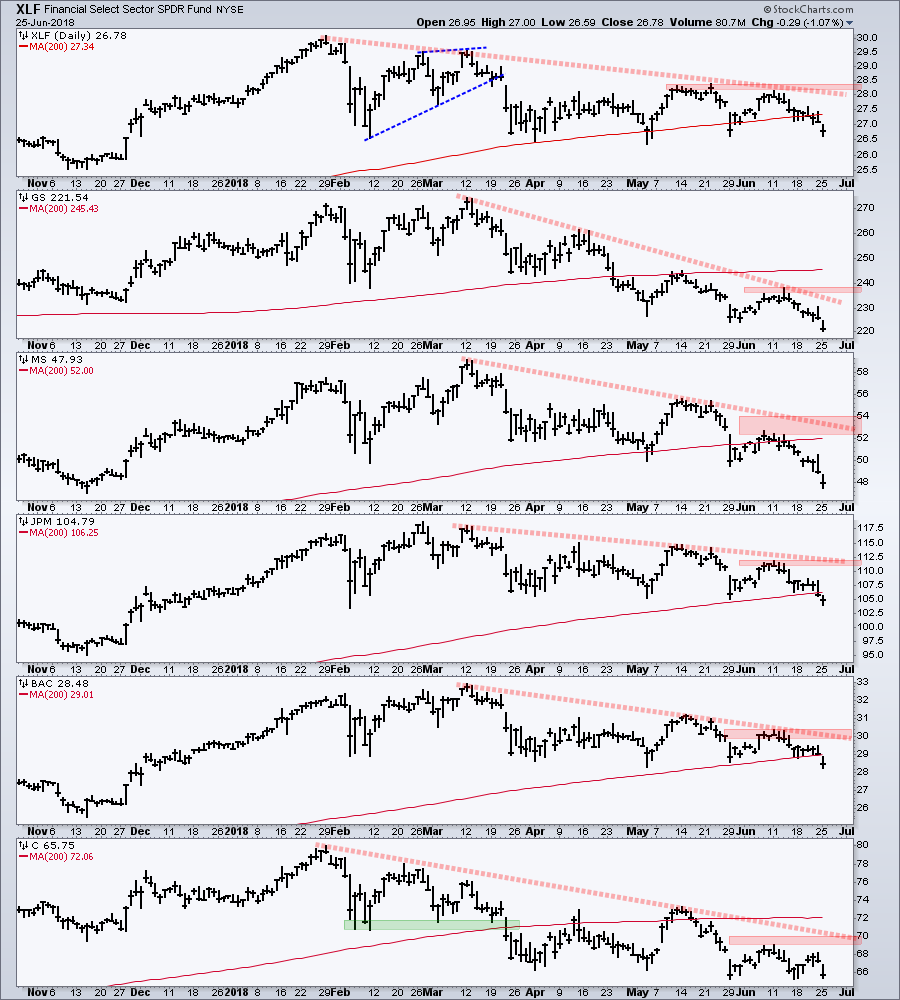
XLF is below its 200-day SMA and yesterday's close was the lowest close of the year. Clearly, XLF is weak and not helping the S&P 500. All five stocks are also below their 200-day SMAs and four of the five recorded new lows for 2018.
StockCharts TV and On Trend
Note that I will cover the charts above and more in today's show (On Trend - Tuesdays at 10:30AM ET). Here are the topics for today:
- Measuring Participation after a Big Move
- Spotting Underlying Strength/Weakness
- State of the Market (IJR, XLI/XLF, Seasonality and more)
- Finance Sector versus Healthcare Sector
- Where to Find Components
- PerfCharts Comparing Top Ten Stocks
- XLF and XLV Chart Analysis
- Key Stocks: PFE,MRK,LLY,AMGN, GILD
- Key Stocks: GS, MS, JPM, C, BAC
- Stocks to Watch: MDT, ROST, HSIC, ANTM, UTX
- Click here for StockCharts TV
Questions, Comments or Feedback?
I cannot promise to response to all correspondence, but I will read it and take into under consideration. I greatly appreciate all feedback because it helps me improve the commentary and provides ideas for the future. Sorry, I do not take symbol requests.

Plan Your Trade and Trade Your Plan.
- Arthur Hill, CMT
Senior Technical Analyst, StockCharts.com
Book: Define the Trend and Trade the Trend
Twitter: Follow @ArthurHill


