- A Binary Approach to Indicators.
- Wobbly S&P Holds Breakout Zone.
- A Small Pullback in the E-Mini.
- The Dow? Fughedaboutit!
- QQQ and IJR Hit Fresh New Highs.
- Retail and Amazon Power XLY.
- XLV Holds Breakout.
- XLK Starts to Stall.
- XLF Tests a Big Support Zone.
- Oil Holds Support Near Key Retracement.
- Notes from the Art's Charts ChartList.
 ...A Binary Approach to Indicators
...It is easy to get caught up with the "degree" of bullishness or bearishness in an indicator because the degree is open for debate. It is often simpler, and more effective, to consider indicators in a binary manner. They are either bullish or bearish. As with trends and timeframes, we do not know how long an indicator will remain bullish or bearish. We just accept the result until it changes.
The Percentage of Stocks above the 200-day EMA is an indicator that "seems" less bullish, but it is currently more bullish than bearish. It seems less bullish when we compare current levels to prior levels. However, this particular indicator is net bullish as long as it is above the 50% mark.
The chart below shows the Percent Above 200-day EMA for the S&P 500, S&P Mid-Cap 400, S&P Small-Cap 600 and Nasdaq 100. Except for small-caps, this indicator is not as high as it was in December-January 2017. Back in the day, the Percent Above 200-day EMA exceeded 80% for the S&P 500 and Nasdaq 100.
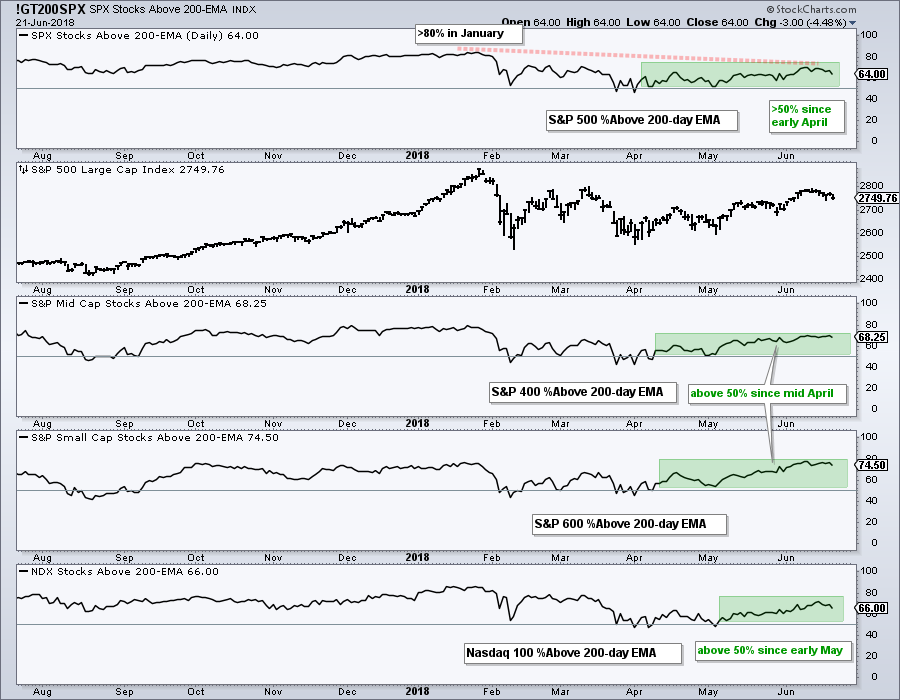
Over 60% of stocks in all four indexes are above their 200-day EMA. This is clearly more bullish than bearish. As a binary indicator, 50% is the first level when we must start reconsidering. Note that the S&P 500, S&P Mid-Cap 400 and S&P Small-Cap 600 have been above 50% since early April, while the Nasdaq 100 has been above 50% since early May.
As wobbly and divided as the market seems, I would not become concerned with a correction unless these indicators start breaking below 50%.
Wobbly S&P Holds Breakout Zone
The broad S&P 500 reflects the mixed performance for large-caps because the index is up around 3% year-to-date and trading in a choppy range. This range narrowed into early May and the index broke out of a large triangle in mid May.
This breakout is the dominant chart feature and it is bullish. The breakout points and late May low mark first support at 2675 and this is the first area to watch for signs of a failed breakout.
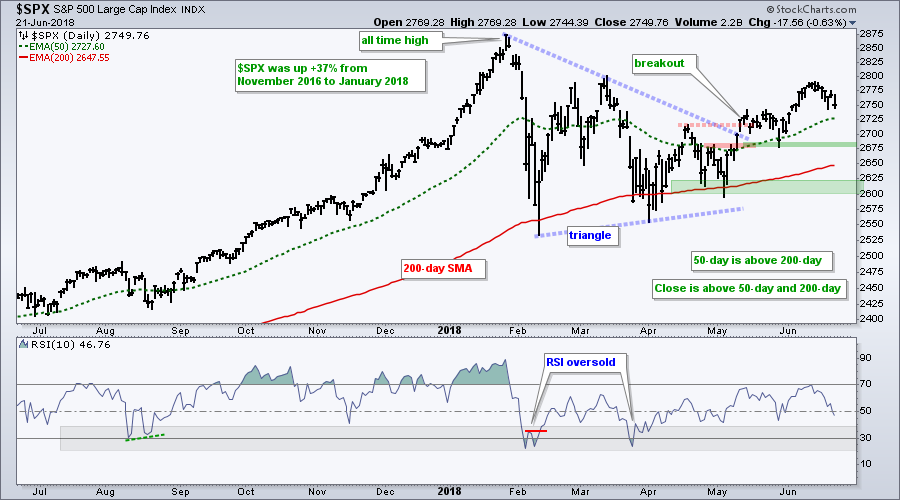
Long-term, I am keeping key support in the 2600-2625 area. A break below this level, while still a ways off, would reverse the long-term uptrend. I would also consider the long-term uptrend reversed when the 50-day EMA moves below the 200-day EMA. Until such breakdowns, the trend is up and the bulls are still in charge.
A Small Pullback in the E-Mini
The next chart shows two different versions of the S&P 500 using SPY and the E-mini. The close-only SPY chart sports a rising wedge since early April and key support at 267.50. A close below this level would reverse the rising wedge and provide the early sign that the January-February decline is continuing. Such a break would target a move to the 250 area, which is a 10% decline from 277.5.
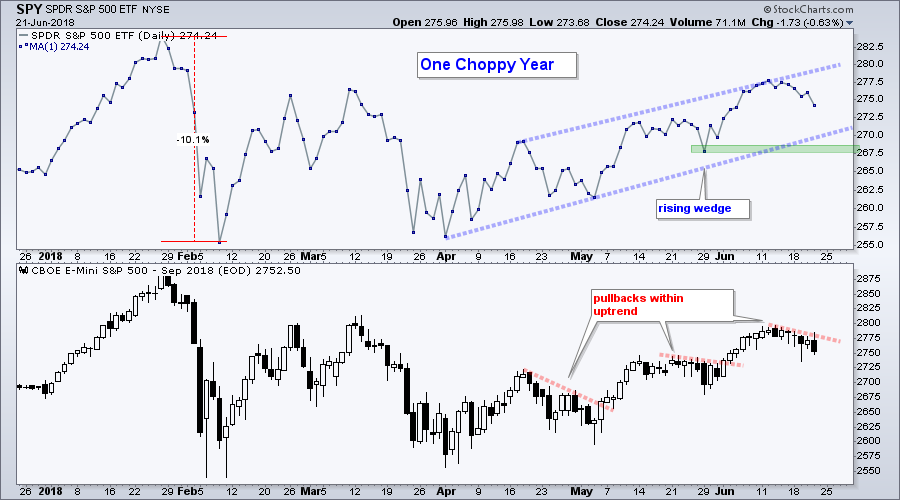
The second window shows the E-mini with the third pullback in as many months (red lines). Technically, the long-term trend is up for the S&P 500 and SPY is trending higher within a rising wedge. Thus, the odds still favor an upside resolution to this short pullback. Why? Because the bigger trend is the dominant force at work. Look for a break above 2780 to reverse the pullback.
The Dow? Fughedaboutit!
While SPY and the S&P MidCap SPDR (MDY) struggle in 2018, the S&P SmallCap iShares (IJR) and Nasdaq 100 ETF (QQQ) continue to lead with double digit gains. Thus far in 2018, SPY is up 3.64%, MDY is up 5.17%, IJR is up 12% and QQQ is up 13.23%. For reference, QQQ led in 2017 with a 34.6% gain and SPY was second with a 22.2% advance.
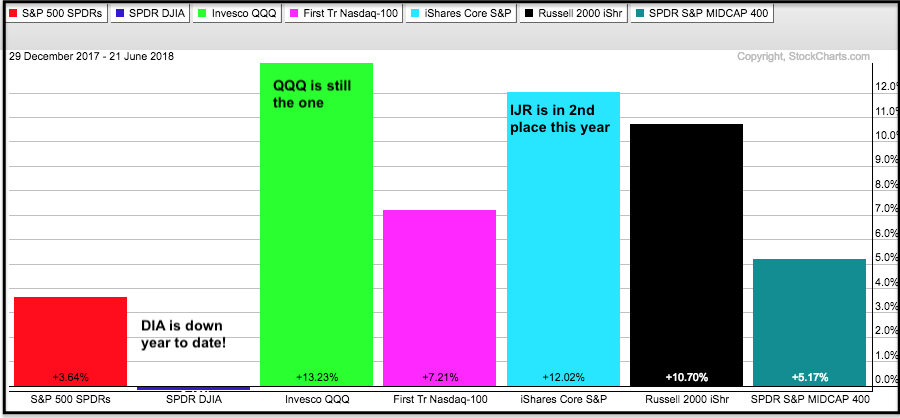
The Dow Diamonds (DIA) is the only major index ETF that is down year-to-date. Personally, I think the Dow Industrials and DIA are poor representatives for the broader market and should not be used for broad market assessments. The Dow is just 30 stocks and they are weighted by price, which means the stocks with the highest price carry the most weight. As John McEnroe would say: You cannot be serious!
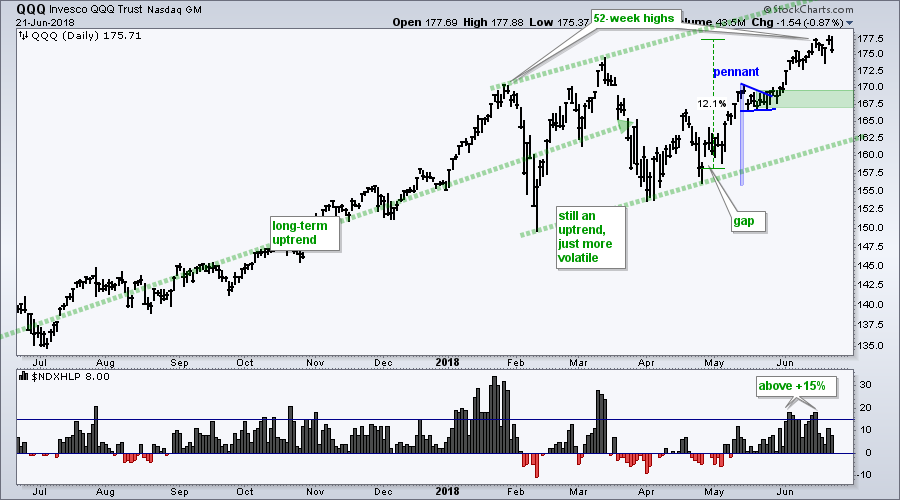
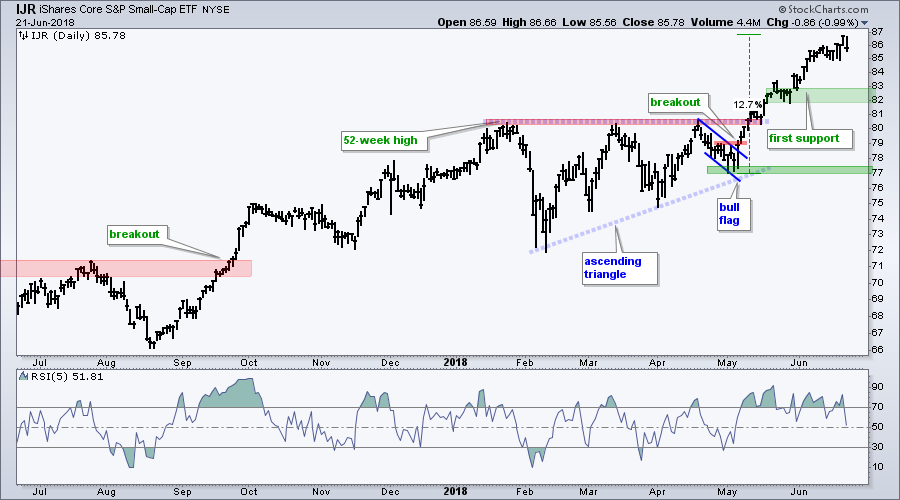
QQQ and IJR Hit Fresh New Highs
The next charts show QQQ and IJR hitting new highs again this week and extending their long-term uptrends. One could argue that the ETFs are extended after 12% advances in seven to eight weeks, but there is no arguing the trend (up, up, up). The green zone marks first support to watch should we get a pullback.
Retail and Amazon Power XLY
The sector PerfChart shows performance for the ten sector SPDRs over the last 11 trading days. There is some short-term risk aversion in this chart because three of the big offensive sectors are down (XLK, XLI, XLF) and the two defensive sectors are up (XLP, XLU).
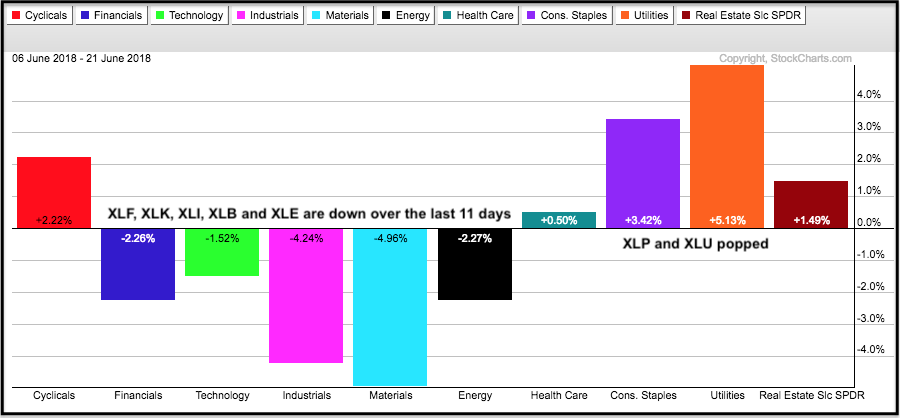
The Consumer Discretionary SPDR (XLY) remained strong because Amazon was up 2% during this timeframe and the Retail SPDR (XRT) was up 4%. The Health Care SPDR (XLV) is the one that stands out in my book because it is one of the big five sectors and shows a small gain.
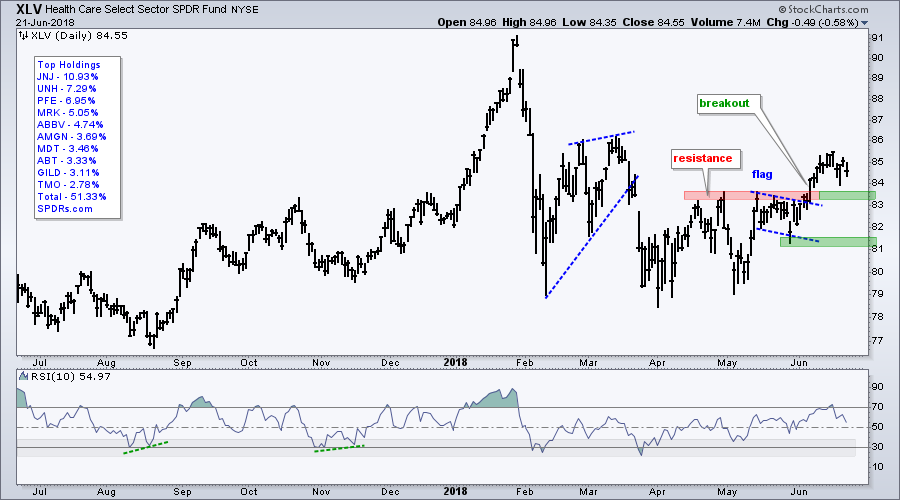
XLV Holds Breakout
The Health Care SPDR (XLV) broke out with a surge in early June and held above this breakout over the last two weeks. The breakout zone around 83-83.5 turns first support and the breakout remains strong as long as this level holds. While a move back below 83 would negate the breakout, I would not turn outright bearish unless XLV breaks the late May low (81). Within the group, PFE is on the verge of a range breakout and GILD is consolidating after a surge from 64 to 72.
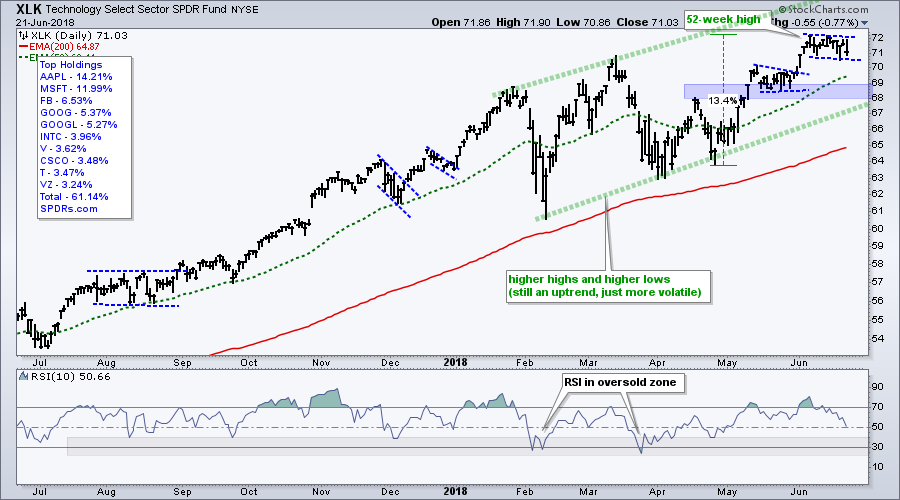
XLK Starts to Stall
The next chart shows the Technology SPDR (XLK) edging lower the last two weeks with a small correction. The pattern looks like a falling flag and a breakout at 72 would argue for another push higher. Even if XLK breaks below 70, I would not turn bearish because weakness would be viewed as a correction within a bigger uptrend. The blue zone marks potential support in the 68-69 area.
XLF Tests a Big Support Zone
The Financials SPDR (XLF) remains with a serious of lower highs in 2018 and relatively equal lows. Overall, it looks as if a large descending triangle is forming. This means a break below 26.5 would be bearish and target a test of the September low.
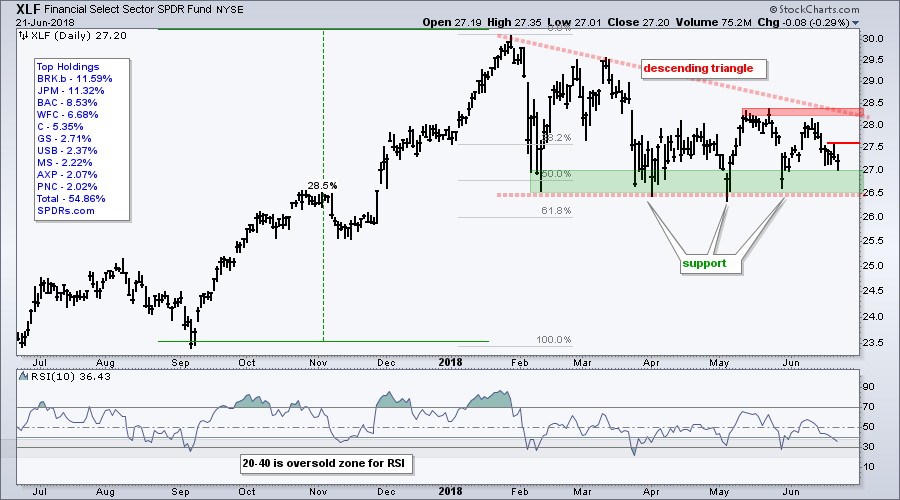
There is, however, a lot of support in the 26.5-27 area as the ETF bounced off this zone in February, April and May. XLF is once again testing the top of this zone after a pullback the last two weeks. Look for a break above 27.6 to reverse this two week downswing and set up a resistance challenge in the 28-28.5 area.
Oil Holds Support Near Key Retracement
Now I am going to wade back into the murky world of oil. OPEC is meeting as I write and this could move the markets. I have no idea what OPEC will decide or how the market will react. All I have is a humble chart.
I was watching oil last week because the long-term trend is up and RSI became oversold. This mean-reversion setup pointed to a bounce, but oil did not cooperate and broke flag support with a sharp decline last Friday. We have yet to see follow through to this flag break and oil remains in a potential reversal zone.
After hitting a 52-week high in late May, oil retraced around 61.8% of its prior advance with a decline into early June. USO shows support in the 13 area, while $WTIC shows support in the 64 area. The red zones mark short-term resistance and breakouts here would be bullish.
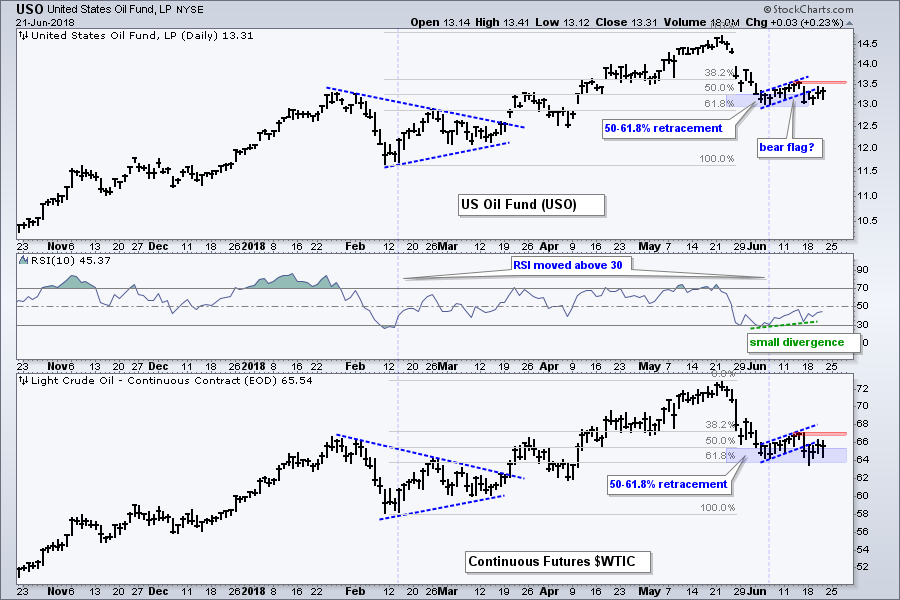
The indicator window shows RSI with a small bullish divergence. Keep in mind that RSI is based on closing prices and this means we should base divergences on closing prices. The higher low in RSI created a small bullish divergence and a move above 50 would trigger a momentum breakout.
Notes from the Art's Charts ChartList
- The Semiconductor iShares (SOXX) is underperforming the last two weeks, but the decline may be a bull flag.
- The Semiconductor SPDR (XSD) turned choppy and could be poised to correct after the 15% surge.
- The Broker-Dealer iShares (IAI) remains locked in a triangle consolidation with a two week downswing underway.
- The Regional Bank SPDR (KRE) turned up and broke a two week trend line this week.
- The REIT iShares (IYR) and Mortgage REIT ETF (REM) continue to lead with new highs for 2018.
- The iShares Aerospace & Defense ETF (ITA) failed at resistance and moved sharply lower the last two weeks.
- The Oil & Gas Equip & Services SPDR (XES) is testing the breakout zone and the 61.8% retracement as RSI flirts with oversold levels.
- The Agribusiness ETF (MOO) and Metals & Mining SPDR (XME) formed rising wedges and are testing key support levels.
Questions, Comments or Feedback?
I cannot promise to response to all correspondence, but I will read it and take into under consideration. I greatly appreciate all feedback because it helps me improve the commentary and provides ideas for the future. Sorry, I do not take symbol requests.

Plan Your Trade and Trade Your Plan.
- Arthur Hill, CMT
Senior Technical Analyst, StockCharts.com
Book: Define the Trend and Trade the Trend
Twitter: Follow @ArthurHill


