- Strong, but Getting Frothy.
- S&P 500 High-Low Percent Exceeds 10%.
- S&P 500 Extends Breakout.
- QQQ and IJR Hit New Highs.
- Two New Highs and Two Breakouts.
- Sector SPDRs Mask Strength Within.
- Setting Resistance for Treasury Bond ETFs.
- A Mean-Reversion Setup in Oil.
- Notes from the Art's Charts ChartList.
 The stock market remains in bull mode with small-caps and large-techs leading the way, but these two are getting quite extended over the short-term timeframe. This is not bearish and I certainly do not want to pick a short-term top during a long-term uptrend. However, extended conditions increase the chances of a pullback or consolidation.
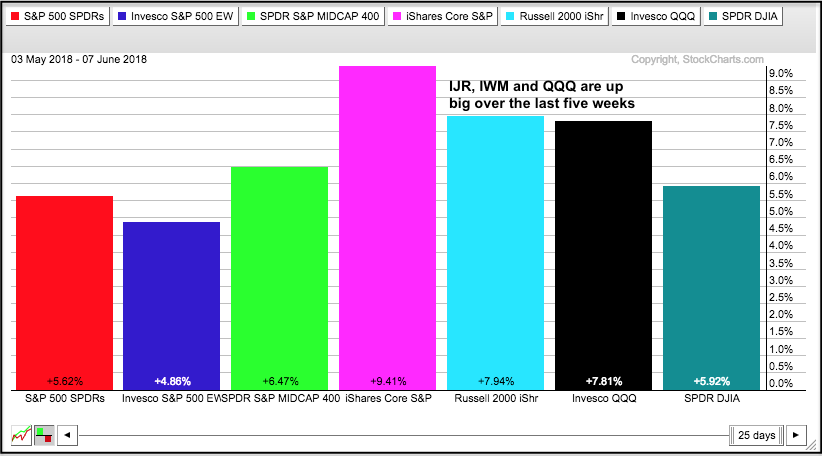
The PerfChart below shows the five week performance for the major index ETFs (closing basis). The S&P SmallCap iShares (IJR) is up over 9% and the Nasdaq 100 ETF (QQQ) is up almost 8%. These are big gains in a short period of time.
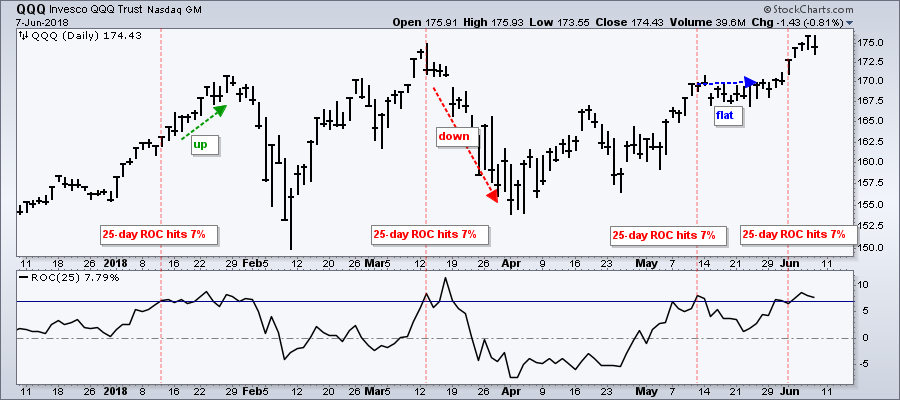
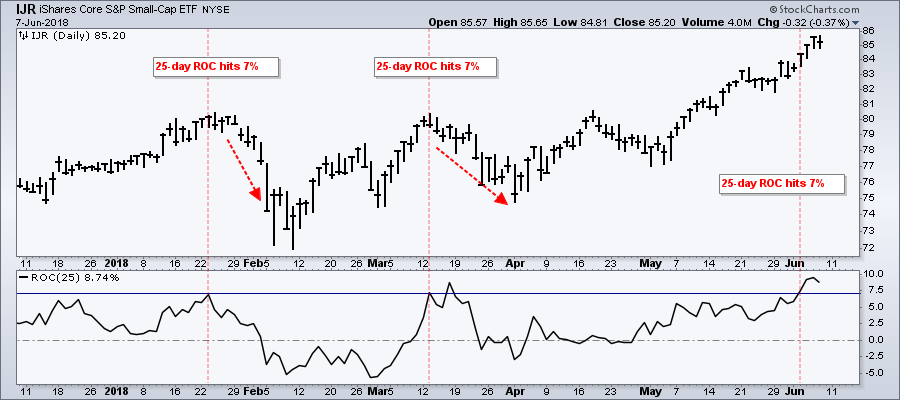
The next charts show QQQ and IJR with the 25-day Rate-of-Change. The red lines shows when 25-day ROC hit or exceeded 7% in 2018. There are only five occurrences this year so this is not a comprehensive study. The arrows show QQQ subsequently rising, falling and flattening over the next one to two weeks. IJR fell twice after the 25-day ROC hit 7% and is currently up since the early June occurrence. I am not turning bearish here, but just making the point that stocks are getting frothy and could consolidate or correct in the near future.
S&P 500 High-Low Percent Exceeds 10%
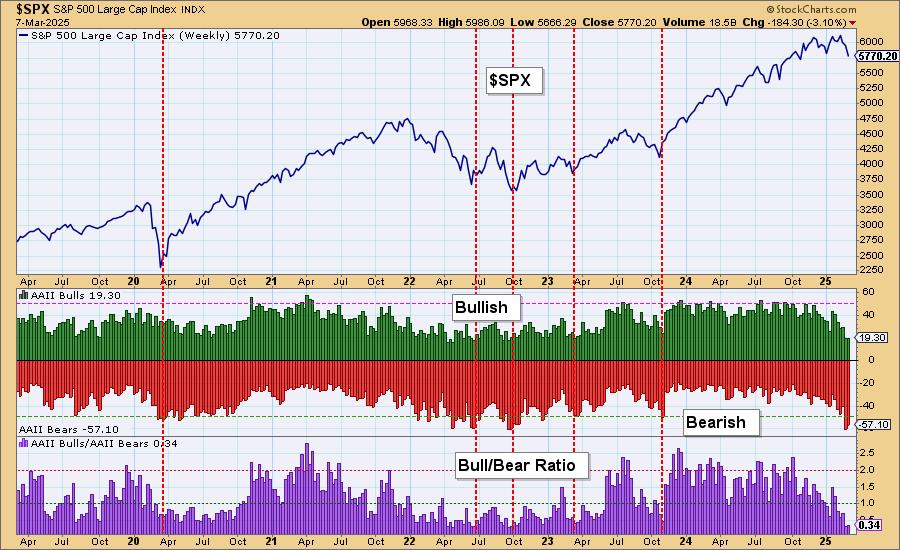
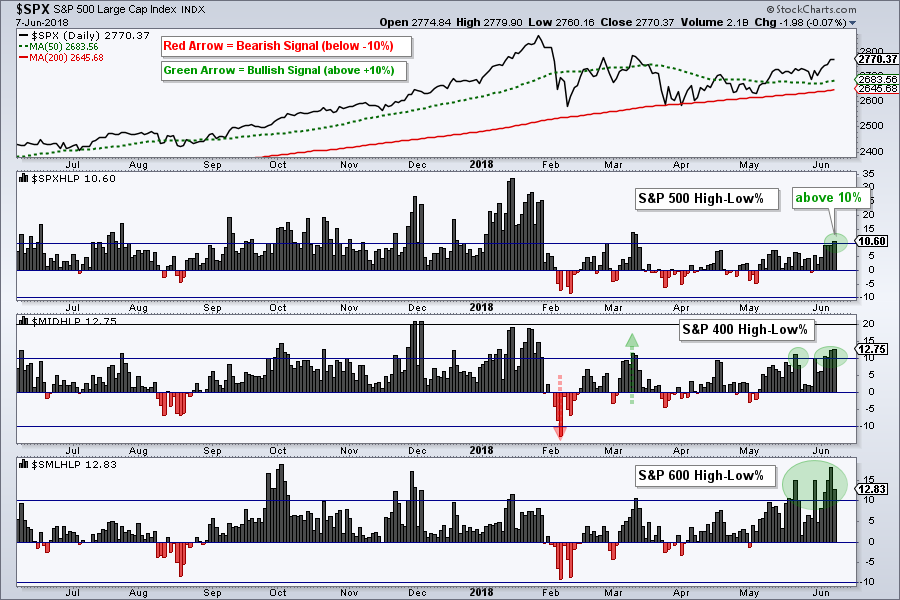
Leadership expanded this week as High-Low Percent rose within the major stock indexes. S&P 500 High-Low% ($SPXHLP) exceeded +10% for the first time since mid March, S&P 400 High-Low% ($MIDHLP) hit its highest level since late January and S&P 600 High-Low% ($SMLHLP) reached its highest level since October. The expansion of new highs is bullish because it shows expanding leadership.
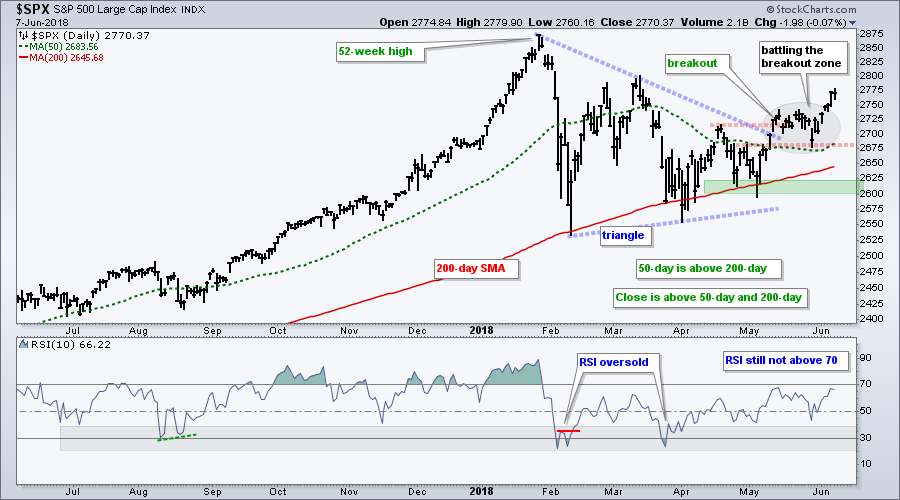
S&P 500 Extends Breakout
The S&P 500 extended its breakout with a surge above the May high. The index remains below the March high and RSI has yet to exceed 70, but I think the bullish evidence outweighs the bearish evidence. Price is above the 50-day SMA, the 50-day is above the 200-day and the triangle breakout is holding. The triangle represents a big corrective period after a sharp advance and the breakout signals a continuation of this advance. Given the evidence, I would expect new highs in the coming weeks or months. The late May low marks first support at 2675 and key support is set at 2600.
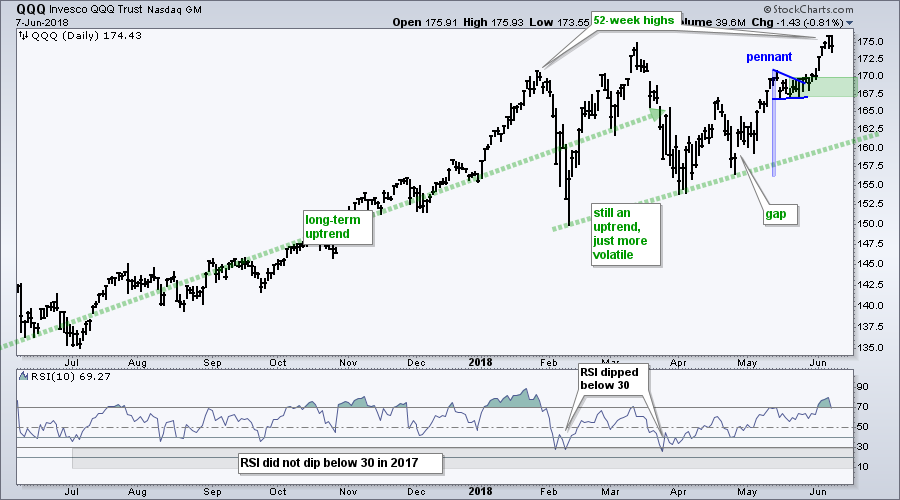
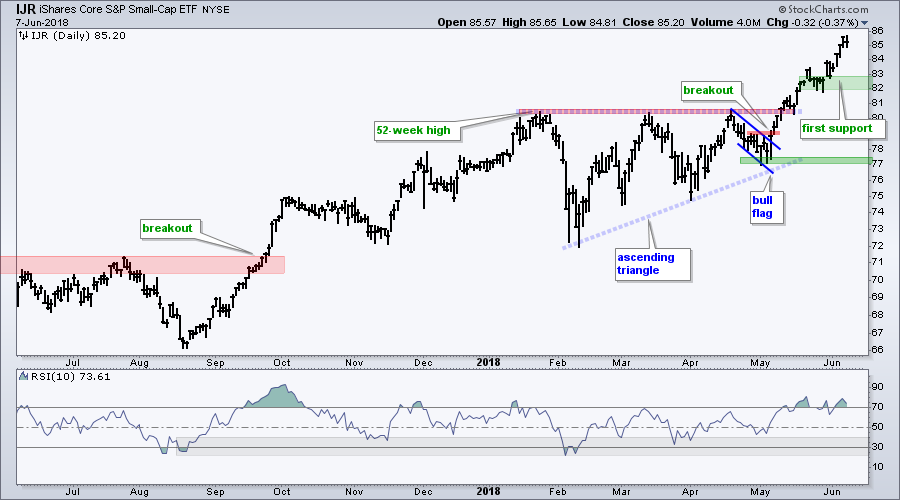
QQQ and IJR Hit New Highs
The Nasdaq 100 ETF (QQQ) and the S&P SmallCap iShares (IJR) continue to lead with new highs this week. QQQ broke out of a pennant in late May and moved to a new high in early June. The ETF may be extended after a 10% surge in six weeks, but it is certainly not bearish or weak. Should we see a pullback, the pennant area marks the first support zone to watch for a bounce.
IJR surged over 9.4% in five weeks and recorded several new highs in the process. The ETF is getting extended and ripe for a rest, but picking a top is probably a lesson in futility. Should we get a pullback, I would watch the mid May consolidation as the first support zone (82-83).
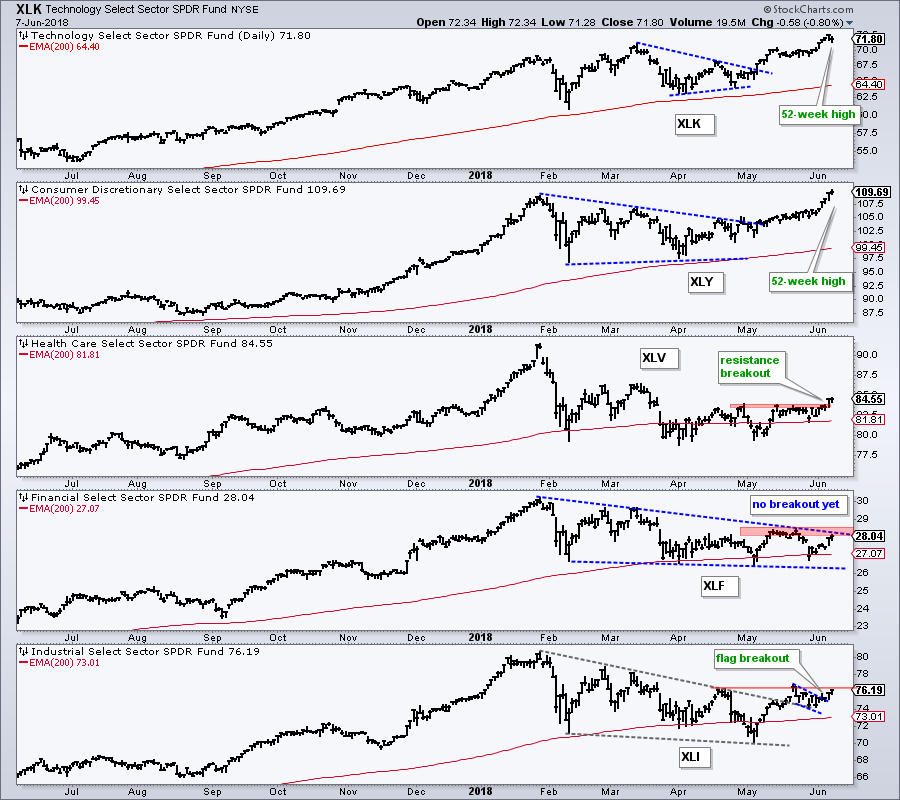
Two New Highs and Two Breakouts
The small-caps sectors are leading, but we saw some large-cap sectors come alive this week. The Technology SPDR (XLK) and the Consumer Discretionary SPDR (XLY) hit new highs and continued to lead. As noted in Thursday's commentary, the Industrials SPDR (XLI) broke out of a big wedge and the Health Care SPDR (XLV) triggered a bullish signal with StochRSI. The Financials SPDR (XLF) also bounced, but remains short of triggering a bullish signal from StochRSI.
Sector SPDRs Mask Strength Within
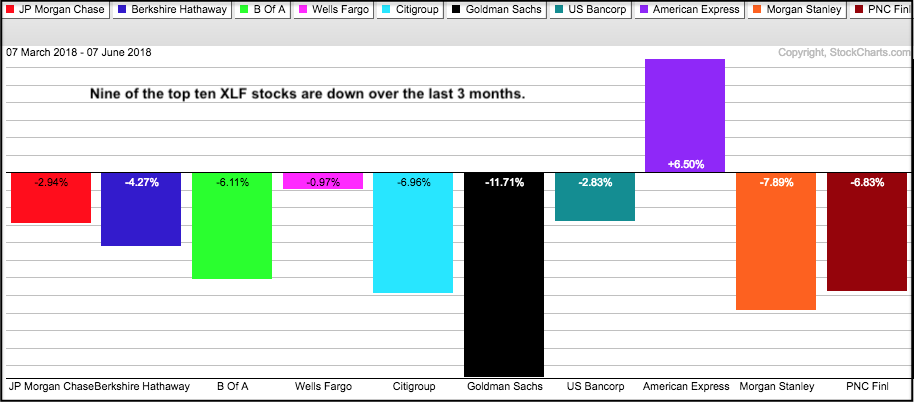
The real action is sometimes happening within the sectors. The Financials SPDR (XLF) remains short of a breakout and is the weakest of the big five sectors. This is because the large-caps within the sector are weighing. The PerfChart below shows 3-month performance for the top ten components. Nine of ten are down with American Express as the only gainer.
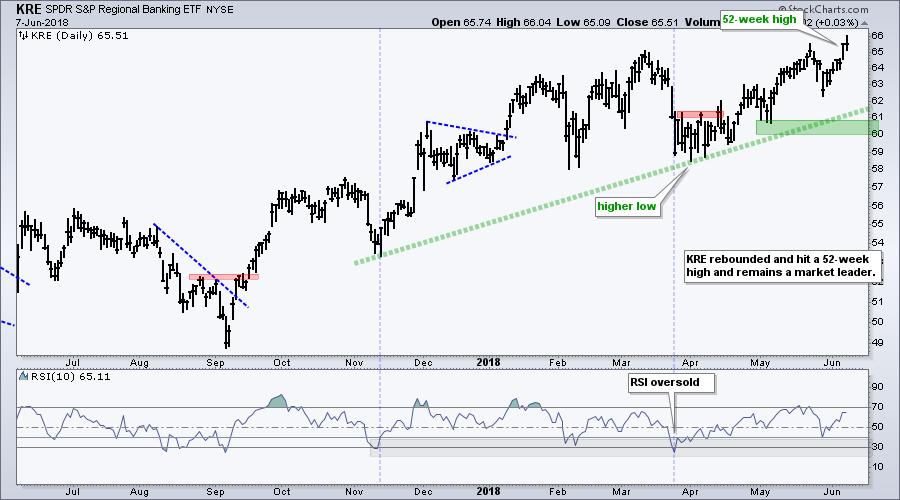
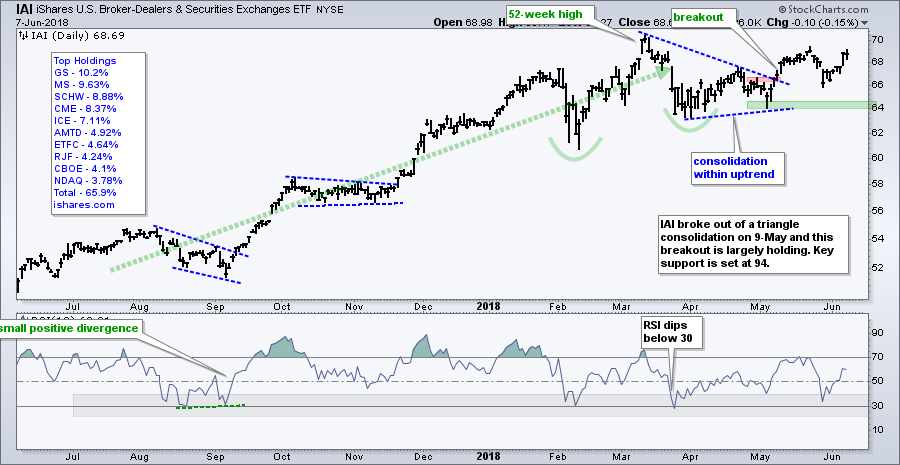
There are, however, pockets of strength within the finance sector, the Regional Bank SPDR (KRE) hit a new high this week and the Broker-Dealer iShares (IAI) is holding its triangle breakout.
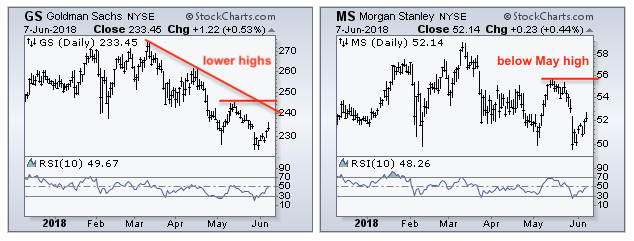
Goldman Sachs (GS) and Morgan Stanley (MS) are the biggest holdings in IAI and they are weighing on the ETF this year.
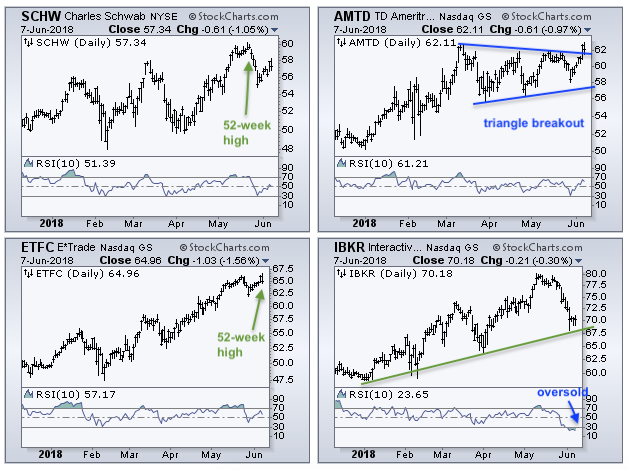
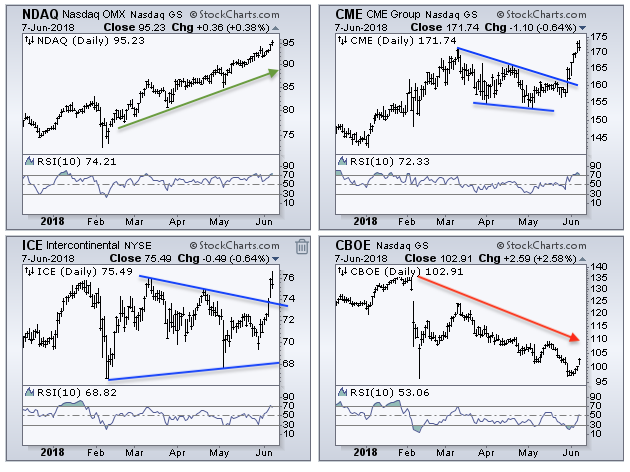
In contrast to GS and MS, the discount brokers (SCHW, AMTD, ETFC, IBKR) and exchanges (NDAQ, CME, ICE, CBOE) are performing better. Well, at least three of the four.
We are also seeing this play out in the Health Care SPDR (XLV). Celgene (CELG), Bristol Meyers (BMY), Perrigo (PRGO), Vertex (VRTX) and Gilead (GILD) are down 9 to 20 percent over the last three months. In contrast, the broad-based Biotech SPDR (XBI) is up 1.88%, the Medical Devices ETF (IHI) is up 8.24% and the HealthCare Providers ETF (IHF) is up 6.42% over the last three months. A few big names are disproportionately weighing on the Healthcare SPDR, but there are pockets of strength within the sector.
Setting Resistance for Treasury Bond ETFs
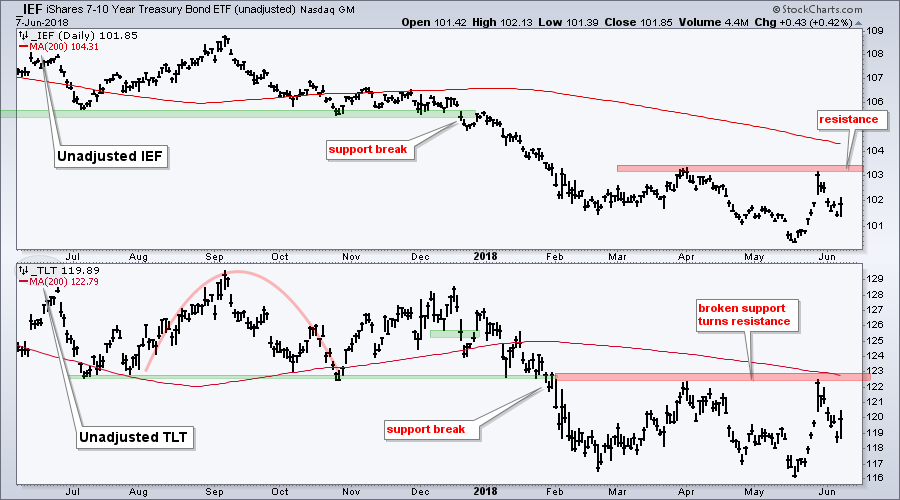
The 20+ YR T-Bond ETF (TLT) and 7-10 YR T-Bond ETF (IEF) got big bounces on Thursday, but remain in long-term downtrends. I am focused on Treasuries because the downtrend means money is moving out of these safe-havens and yields are rising, both of which are positive for stocks, especially financials. The red zones mark resistance from the spring highs. Both ETFs failed at these highs in late May and turned down. A break above these resistance zone would be bullish for bonds and call for a re-evaluation.
A Mean-Reversion Setup in Oil
I featured oil in DITC on Thursday and will include this chart today. Oil is in a long-term uptrend and short-term oversold. As noted many times, I view short-term oversold conditions as an opportunity when the long-term trend is up. This is a classic mean-reversion setup. As with all strategies, not every setup will result in a profitable trade.
The chart shows the USO Oil Fund (USO) in the top window, RSI(10) in the middle and the Light Crude Continuous Contract ($WTIC). The long-term trend is up because crude hit a 52-week high in May and is above the rising 200-day EMA.
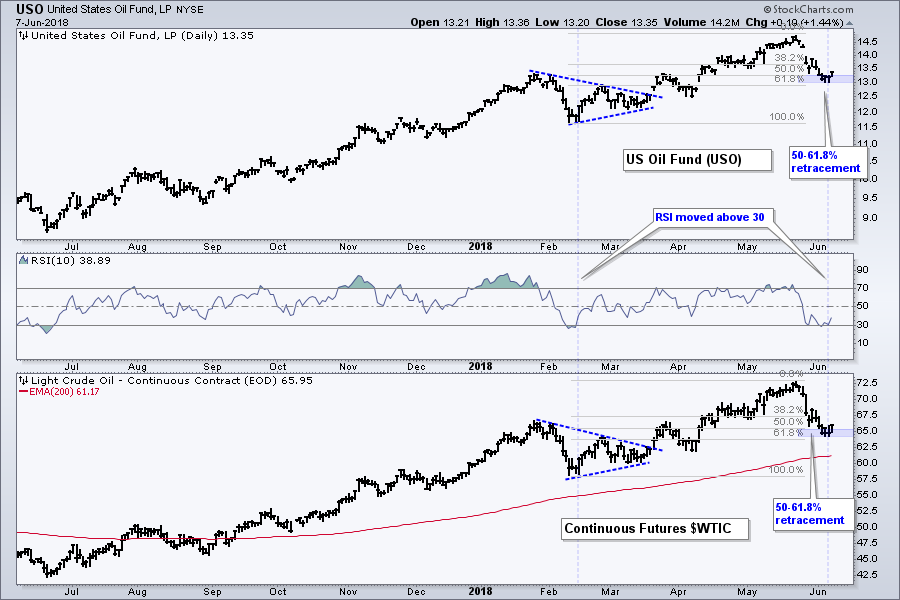
USO became oversold when RSI moved below 30 on Monday and then back above 30 on Wednesday. Also notice that USO retraced 50-61.8% of the prior advance and such retracements are typical for corrections within bigger uptrends. A bounce in oil would be positive for XES.
Notes from the Art's Charts ChartList
- The Retail SPDR (XRT) hit a new high and this is a positive for the market overall.
- The Cloud Computing ETF (SKYY), Cyber Security ETF (HACK), Internet ETF (FDN), the Semiconductor SPDR (XSD) and Software iShares (IGV) hit new highs this week to lead the technology sector.
- The Networking iShares (IGN) broke resistance with a four day surge.
- The Regional Bank SPDR (KRE) hit a new high and continues to lead the market overall.
- The iShares Aerospace & Defense ETF (ITA) broke out of a bull flag.
- The Airline ETF (JETS) remains one of the weakest industry-group ETFs this year.
- The Biotech iShares (IBB) broke out of a bull flag in late May and the breakout is holding as big biotechs strengthen.
- The Oil & Gas Equip & Services SPDR (XES) bounced off the early May support zone and RSI moved from its oversold zone.
- The Copper Miners ETF (COPX) surged off support and challenged resistance from a large triangle consolidation.
- Click here for the Art's Charts ChartList (updated June 8th)
Plan Your Trade and Trade Your Plan.
- Arthur Hill, CMT
Senior Technical Analyst, StockCharts.com
Book: Define the Trend and Trade the Trend
Twitter: Follow @ArthurHill