- Remember the Failed Flag in SPY?
- XLI Fails and Breaks Support.
- KRE Holding Up Well.
- USB Forges Island Reversal.
- Biotech ETFs Breakout.
- 4 Healthcare Stocks to Watch.
- On Trend on Youtube.
 ... Remember the Failed Flag in SPY?
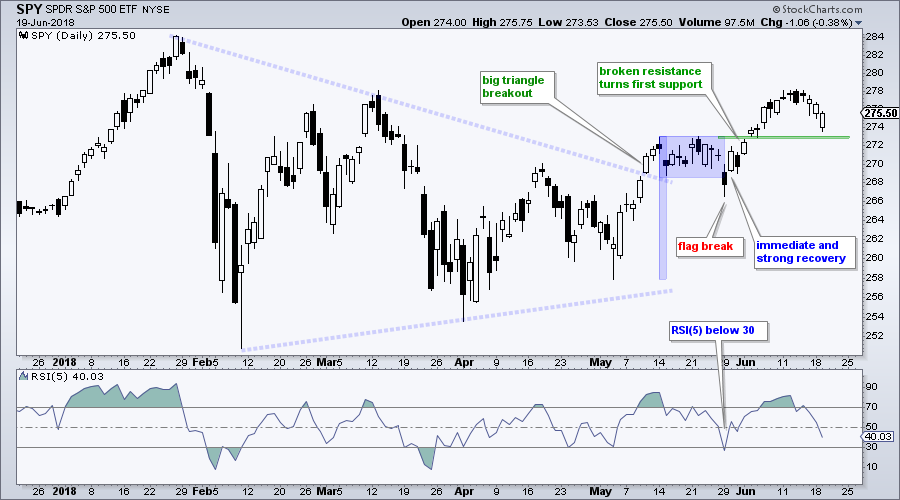
... Not too long ago, the S&P 500 SPDR (SPY) surged and formed a bullish flag. Instead of breaking out to the upside, the ETF broke below the flag lows and appeared to negate the flag. This flag break proved to mark the late May low and the ETF surged around 3.5% over the next two weeks.
There is a buyer for every seller and some traders were buying SPY on the flag break. What were they seeing? Notice that RSI(5) became oversold with a move below 30. Prior to this short-term oversold reading, SPY broke out of a large triangle and exceeded its mid April high. Thus, this was a short-term oversold reading within a bigger uptrend. Put another way, this was a mean-reversion setup.
XLI Fails and Breaks Support
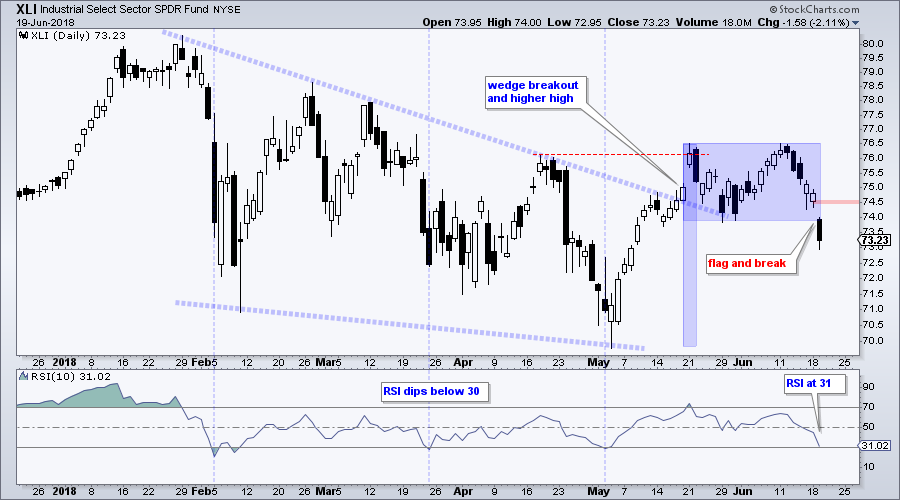
Prior to yesterday's gap and sharp decline, I thought the Industrials SPDR (XLI) may be tracing out a bull flag. Instead of bouncing off the late May low, the ETF broke the late May low with a gap and sharp decline. This is clearly a negative, but RSI(10) is at 31 and almost oversold. The blue vertical lines show prior oversold readings this year.
Now what? The gap and support break are the first levels to watch going forward. A break back above 74.5 would show resilience and could set the stage for a bear trap, as we saw in SPY in late May.
Note that I use RSI(5) for SPY because it is a broad index and less volatile. I use RSI(10) for the sector SPDRs because their stocks are more homogenous and the SPDRs tend to be more volatile than a broad index.
KRE Holding Up Well
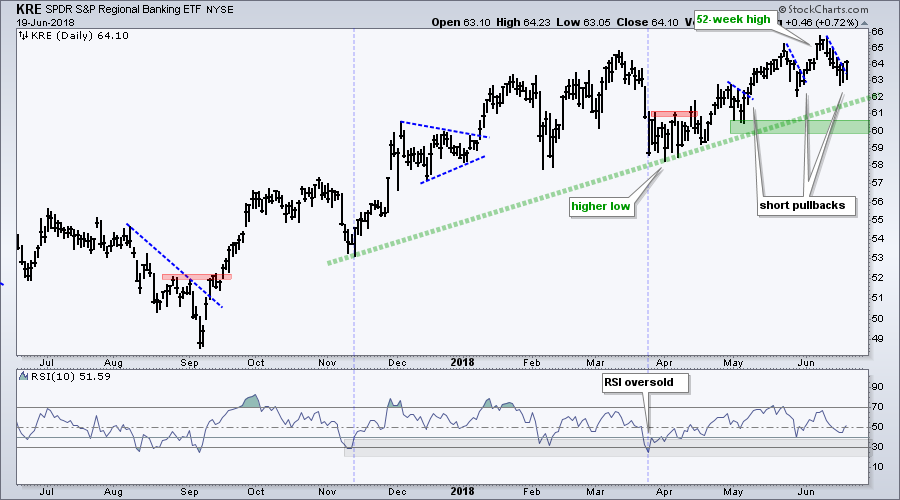
The Regional Bank SPDR (KRE) remains one of the stronger industry group ETFs because it recorded a 52-week high in early June. The ETF pulled back with a dip below 64 and firmed for two days. Stocks were under pressure on Tuesday, but KRE managed to recover early losses and finish with a gain for the day. Perhaps a short-term breakout is in the making.
USB Forges Island Reversal
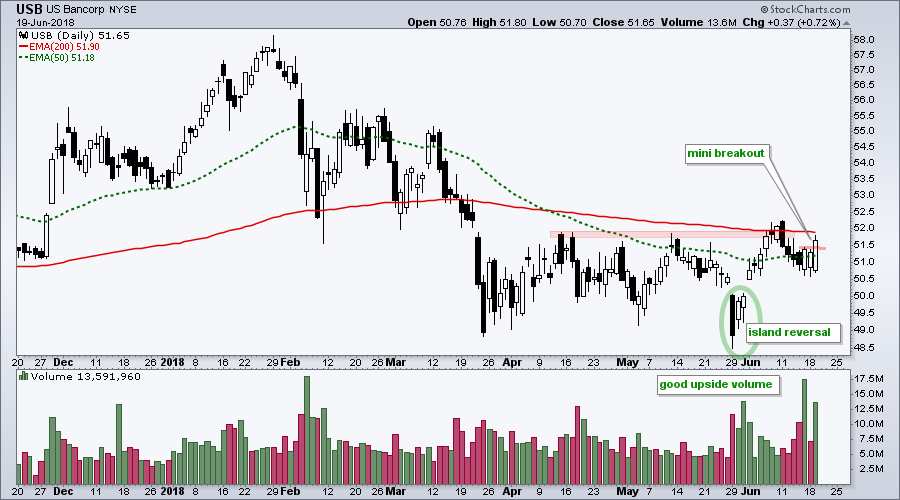
I don't usually pay attention to stocks in long-term downtrends, but US Bancorp (USB) is showing some bullish price action with good upside volume. The long-term trend is down because the 50-day EMA is below the 200-day EMA and price is below the 200-day.
Short-term, the stock forged an island reversal in late May and early June. USB also exceeded the April-May highs in early June. The stock fell back to the 51 area and formed three hollow (white) candlesticks in a row. This means the open is near the low and the close is near the high. Buying pressure also looks strong because upside volume is outpacing downside volume.
Biotech ETFs Breakout
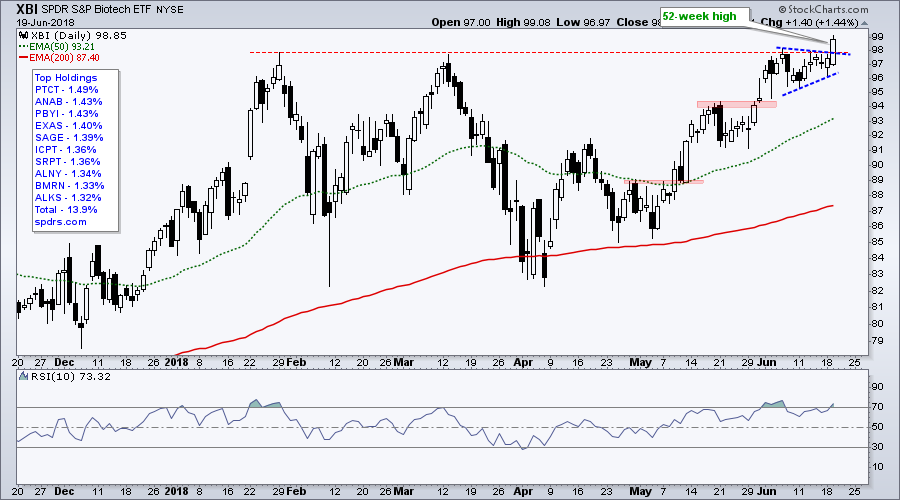
The Biotech SPDR (XBI) is leading the market with a pennant breakout and 52-week high. The chart shows XBI advancing from 86 in early May to the 98 area in early June. A small triangle (pennant) formed and this is a bullish continuation pattern. The breakout signals a continuation of the prior advance and the new high puts XBI on the leader board.
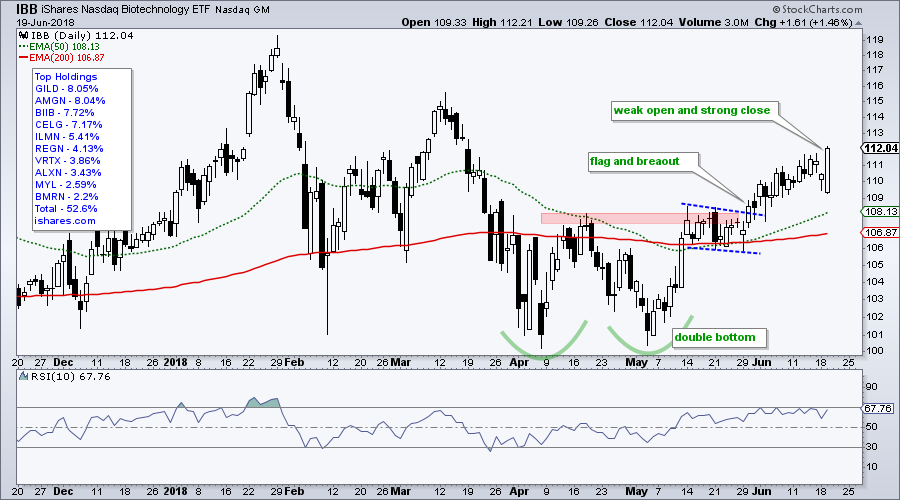
 The next chart shows the Biotech iShares (IBB) breaking out of a flag and double bottom in early June. The ETF opened weak on Tuesday, but closed strong and filled the opening gap.
Note the difference between the holdings for these two ETFs. IBB is dominated by large-cap biotechs with the top six stocks accounting for around 40% of the ETF. XBI is more representative of the "average" biotech. There are over 100 stocks in this ETF and the top ten account for less than 14%. You can find the holdings at ishares.com and SPDRs.com
4 Healthcare Stocks to Watch
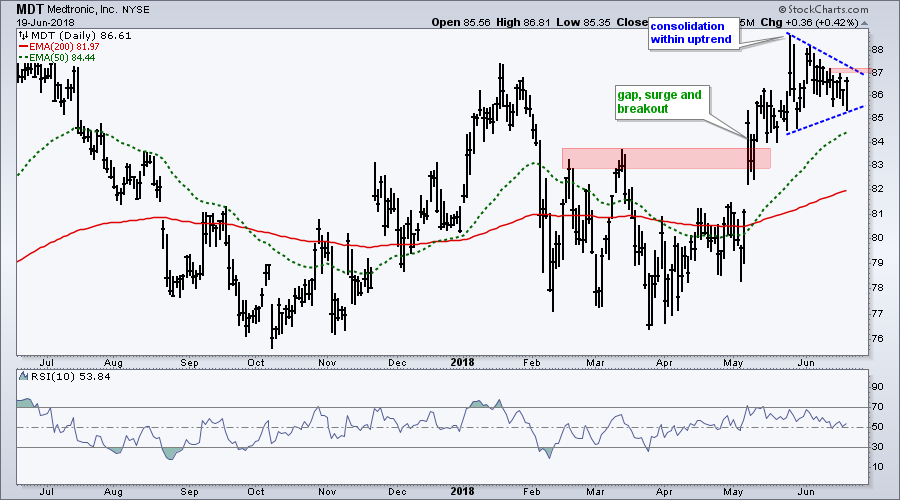
Medtronic (MDT) is still consolidating after a big surge from 79 to 88. Watch for a breakout at 87.2 to signal a continuation higher.
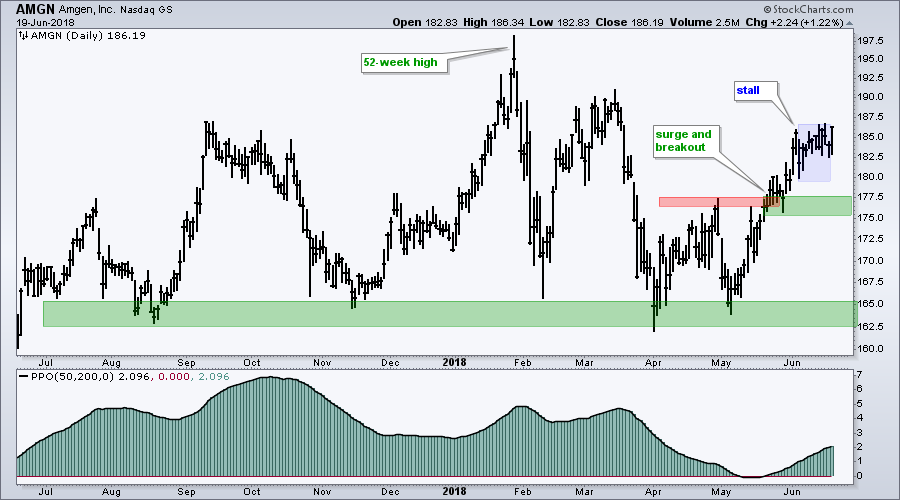
Amgen (AMGN) broke out with a surge from 165 to 185 and then stalled for two weeks. It is not a picture-perfect flag, wedge or pennant, but it is a consolidation after a big move. This means a continuation breakout is expected.
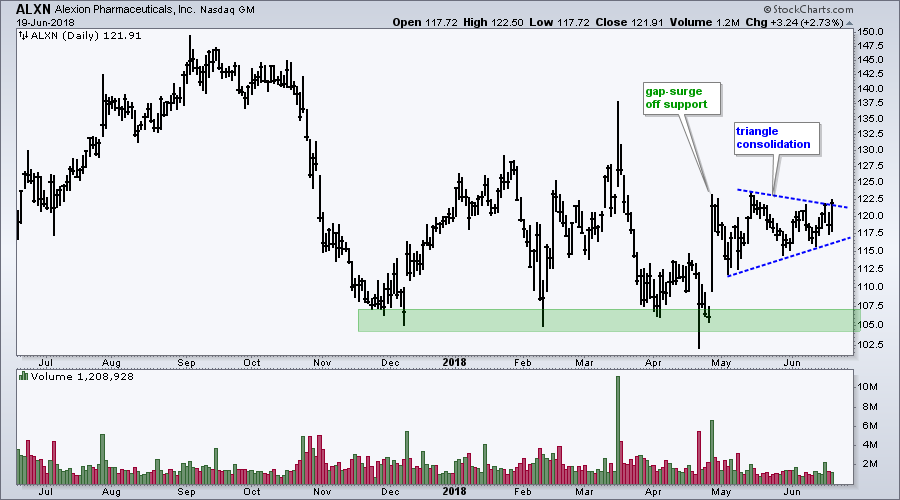
Alexion (ALXN) is not a "normal" setup for me because the stock is not "On Trend". However, the stock did surge off a well-defined support zone with big volume and then formed a triangle. ALXN is breaking above the triangle line with Tuesday's surge.
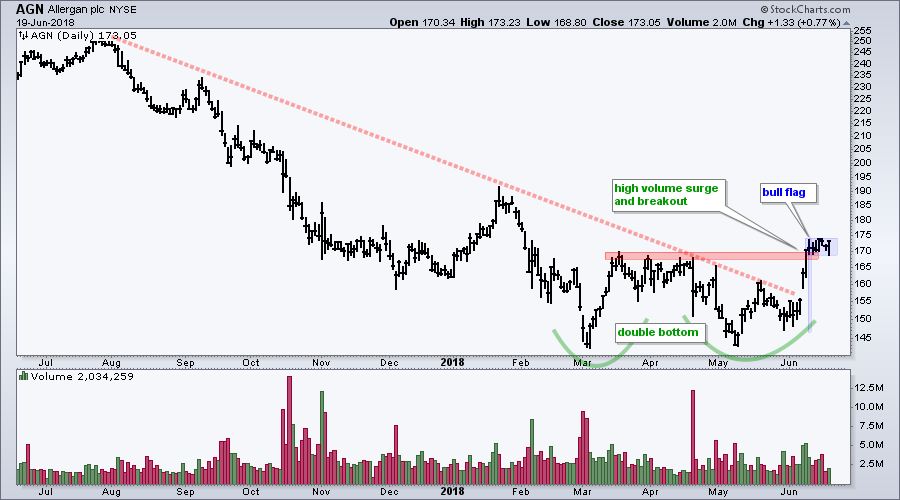
Allergan (AGN) is another atypical setup, but the downtrend appears to be reversing with the double bottom breakout. AGN surged on high volume and then formed a tight consolidation (bull flag). Watch for a flag breakout to signal a continuation higher.
On Trend on Youtube
Available to everyone On Trend with Arthur Hill airs Tuesdays at 10:30AM ET on StockCharts TV and repeats throughout the week at the same time. Each show is then archived on our Youtube channel.
Topics for June 19th
- The Single Biggest Influence on Individual Stocks
- Seasonality and Sector Divisions (XLI, XLF)
- Watching Two Risk-Off Assets
- HON and UTX Stall as CAT Breakout Fails
- Tech Leaders (PFPT, ADSK, ACN, ADI)
- Exchange Leaders (NDAQ, CME, CBRE, ICE)
- Click here to Watch on Youtube
Questions, Comments or Feedback?
I cannot promise to response to all correspondence, but I will read it and take into under consideration. I greatly appreciate all feedback because it helps me improve the commentary and provides ideas for the future. Sorry, I do not take symbol requests.

Plan Your Trade and Trade Your Plan.
- Arthur Hill, CMT
Senior Technical Analyst, StockCharts.com
Book: Define the Trend and Trade the Trend
Twitter: Follow @ArthurHill

