- The Big Drivers in the S&P 500.
- Industrials SPDR Breaks Out of Massive Wedge.
- Boeing Leads XLI with New High.
- Healthcare Holds Support and Breaks Out.
- Blame J&J and Celgene.
- Pfizer, Merck and Amgen hold Breakouts.
- XLF Remains within Corrective Pattern.
- Questions, Comments or Feedback?
 Large-caps have been lagging over the last few months, but that may be about to change as two big sectors break out and one bounces off support.
The S&P 500 can be divided into ten sectors and the top five sectors account for 77% of the index. These are: technology (26.37%), financials (14.09%), healthcare (13.89%), consumer discretionary (12.96%) and industrials (9.86%). While the other five sectors clearly have their place in the market, they influence on the S&P 500 is marginalized by the dominance of the big five.
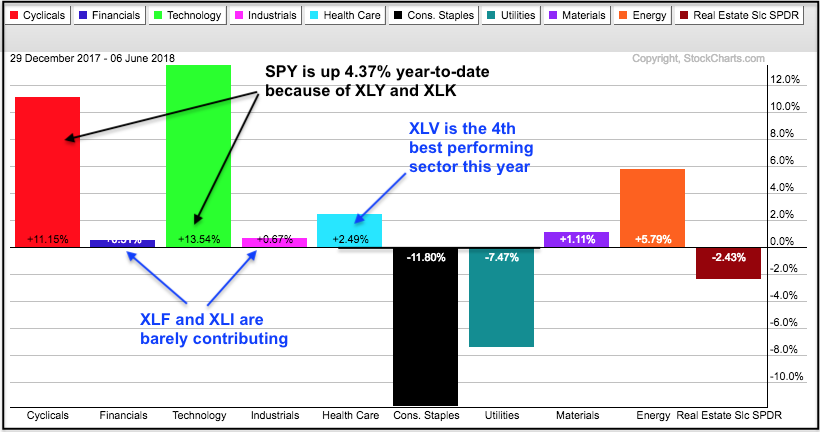
We already know that the Technology SPDR (XLK) and the Consumer Discretionary SPDR (XLY) are strong because both hit 52-week highs this week. Strength in large-caps is now broadening because the Industrials SPDR (XLI) broke out of a bull flag and the Health Care SPDR (XLV) broke resistance. The Financials SPDR (XLF) also got into the act and filled the gap from May 29th, which was that risk-off day driven by the Italian election.
Industrials SPDR Breaks Out of Massive Wedge
The first chart shows weekly candlesticks for XLI and StochRSI. The big trend is clearly up and this year's falling wedge is a big correction after a huge advance. XLI broke out of the wedge with a surge in May and this signals a continuation of the bigger uptrend. Given the long-term uptrend and wedge breakout, I would expect new highs in XLI.
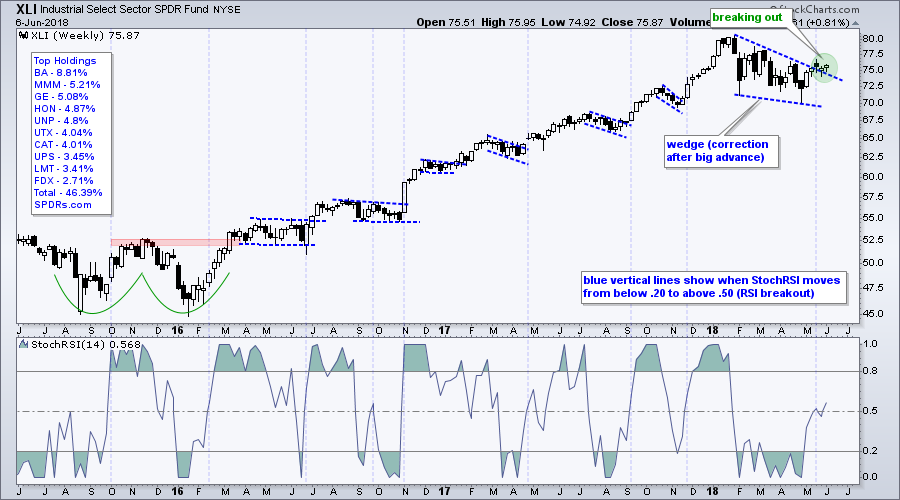
The indicator window shows StochRSI, which was developed by Tushar Chande and Stanley Kroll. You can follow Tushar Chande in his blog here at StockCharts. StochRSI is the Stochastic Oscillator applied to RSI. RSI does not always generate overbought/oversold signals and StochRSI is designed to put a little caffeine into RSI. I use it to define oversold readings and bounces from oversold levels. StochRSI becomes oversold below .20 and a pop back above .50 signals a momentum breakout. Such moves often coincide with price breakouts on the chart.
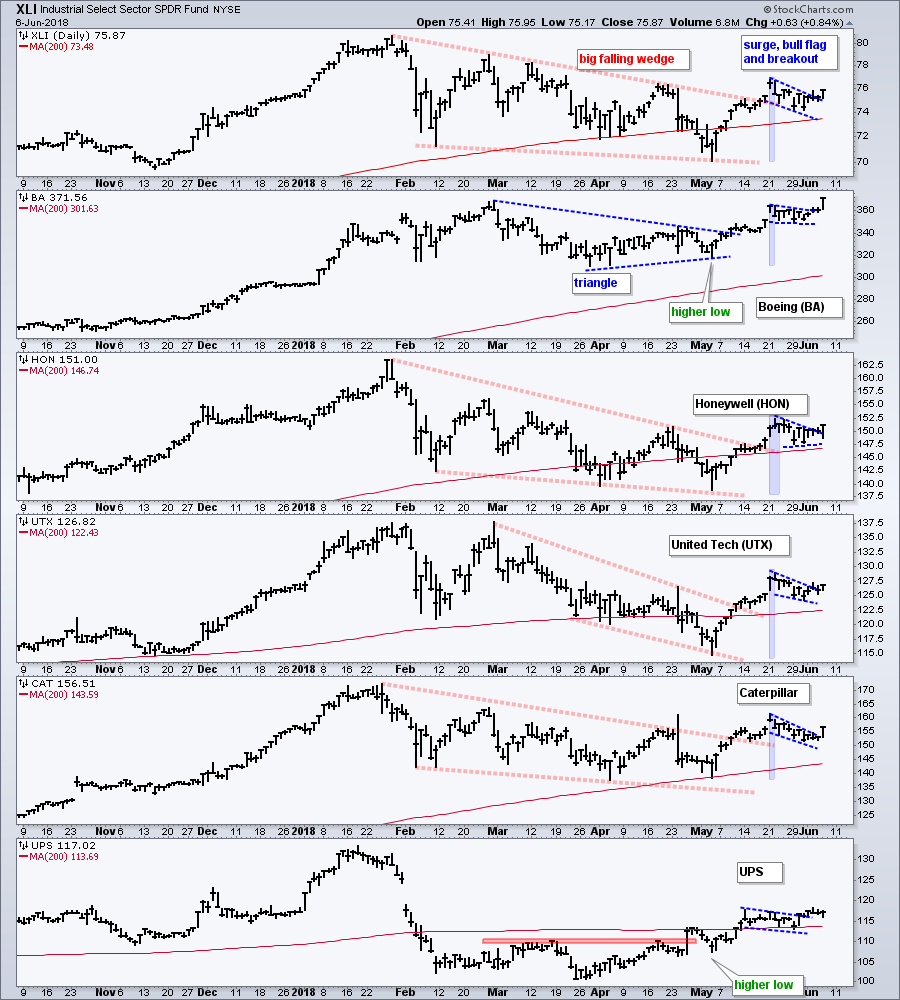
Boeing Leads XLI with New High
The next chart is an update on Monday's commentary. XLI broke out of its bull flag with gains the last two days. Boeing led the group higher with a flag breakout and new high. We are also seeing consolidation breakouts in Honeywell, United Technologies, Caterpillar and UPS.
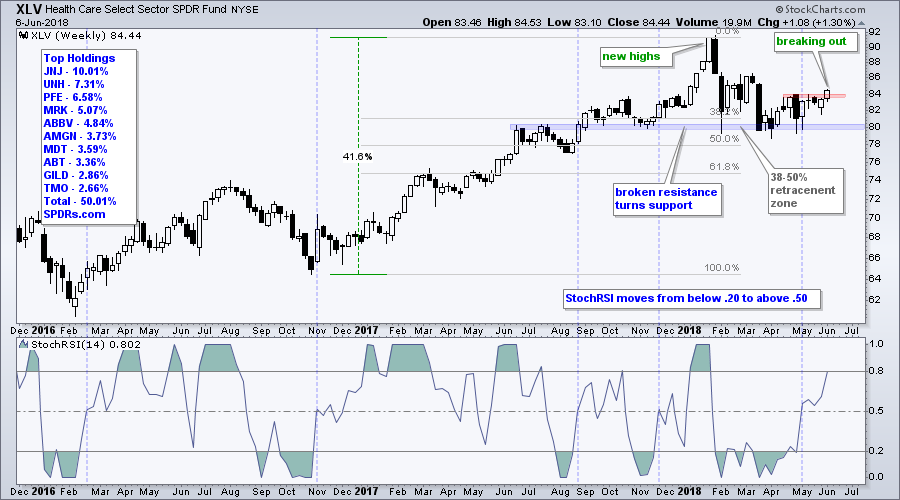
Healthcare Holds Support and Breaks Out
The next chart shows weekly candlesticks for XLV and StochRSI. XLV was leading the market in December-January and then fell sharply in late January and early February. Even though a nice falling wedge did not form, the retracement amount (38-50%) is normal for a correction within an uptrend. Also notice that XLV found support near broken resistance in the 80 area. Healthcare has been lagging for a few weeks, but this may be about to change as XLV joins the rally with a break above the April high.
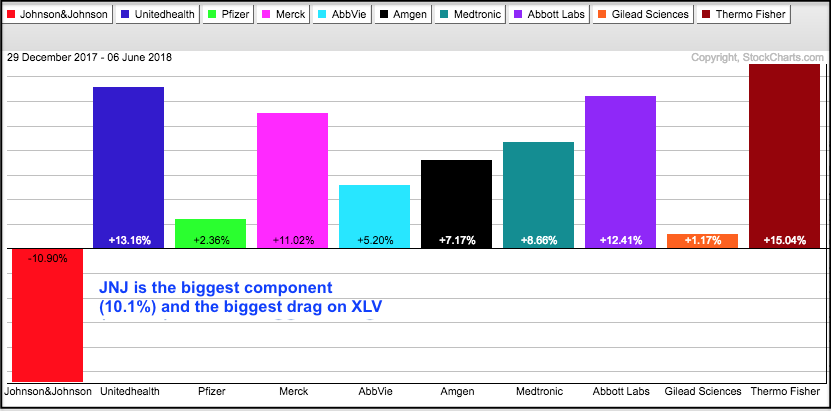
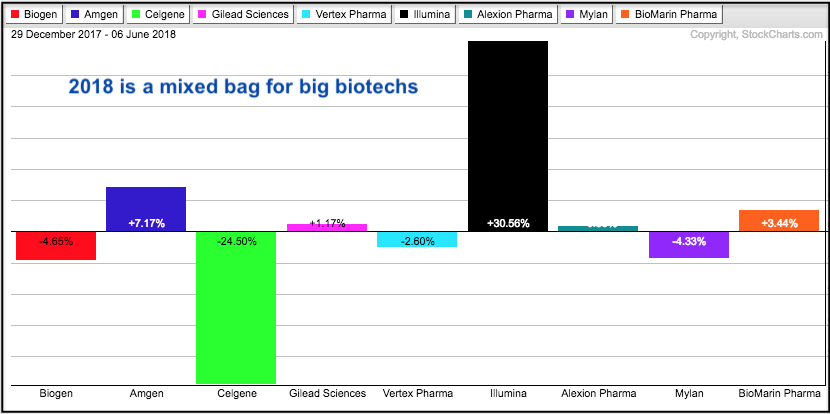
Blame J&J and Celgene
Note that weakness in XLV stems from ONE big pharmaceutical and some big biotech stocks. JNJ is down 11% year-to-date, while Pfizer and Gilead are barely positive this year. Among the big biotechs, Celgene is down 24.5% this year, Vertex is down 2.6% and Mylan is down 4.33%. The PerfCharts below show year-to-date performance for the 10 ten holds for XLV and IBB.
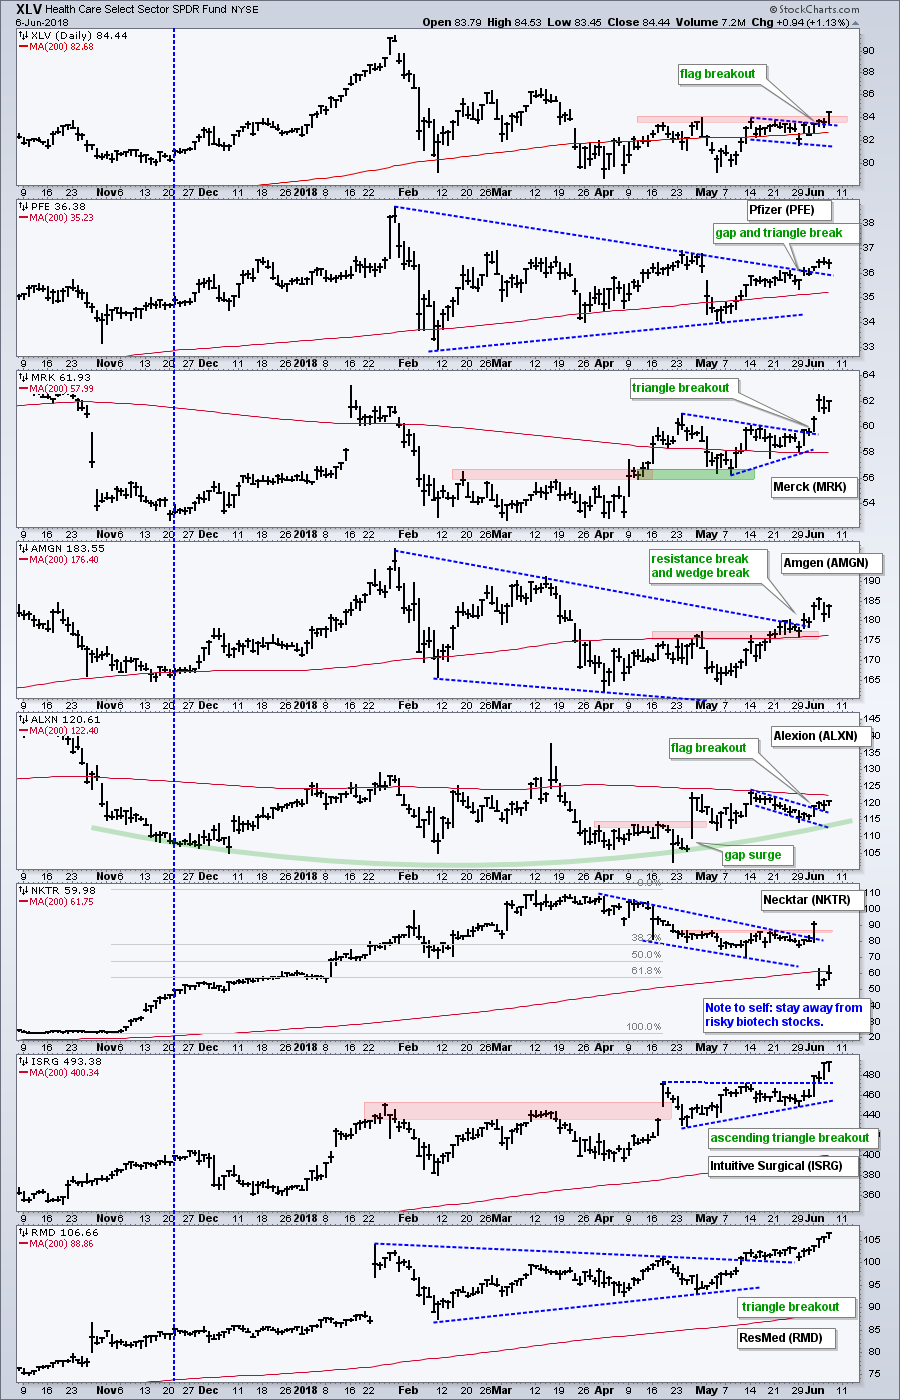
Pfizer, Merck and Amgen hold Breakouts
The next chart is an update from Monday’s commentary. XLV broke out of the falling flag. Pfizer, Merck and Amgen are holding their breakouts and this is bullish. Alexion broke out of a falling flag. Necktar, a wild biotech, lived up to its volatile nature by gapping down as soon as I featured it.
XLF Remains within Corrective Pattern
The first question I ask myself when I look at a chart is: what is the direction of the big trend? The chart below is a weekly chart and the big trend is up. The answer to this question dictates my bias when looking at the smaller patterns at work. A falling wedge formed in 2018 and I view this as a correction because the bigger trend is up. This means I err on the side of the bigger trend and a breakout would signal a continuation of this bigger uptrend.
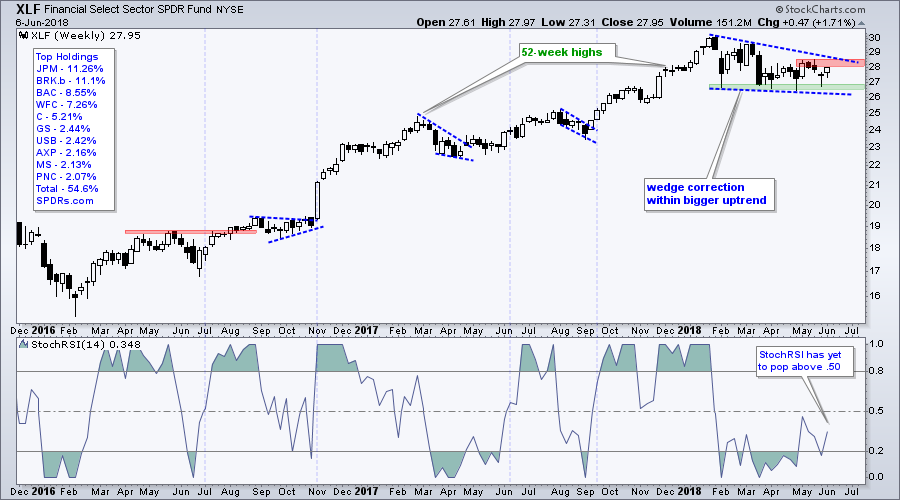
XLF is still the weakest of the big sectors because it remains short of a breakout on the price chart and with StochRSI. A break above the May highs is needed to reverse the falling wedge. A break above .50 is needed to trigger a bullish signal from StochRSI.
Questions, Comments or Feedback?
I cannot promise to response to all correspondence, but I will read it and take into under consideration. I greatly appreciate all feedback because it helps me improve the commentary and provides ideas for future commentary.

Plan Your Trade and Trade Your Plan.
- Arthur Hill, CMT
Senior Technical Analyst, StockCharts.com
Book: Define the Trend and Trade the Trend
Twitter: Follow @ArthurHill
