- Broad Strength in the Nasdaq 100.
- Nvdia and Netflix Lead the Top 10.
- Google Gets its Mojo Back.
- Lots of Bull Flags within XLI.
- Merck and Pfizer Break Out of Triangles.
- Questions, Comments or Feedback?
 The Nasdaq 100 and big techs led the market higher in 2017 and they continue to lead here in 2018. This is positive overall because the technology sector accounts for 26% of the S&P 500.
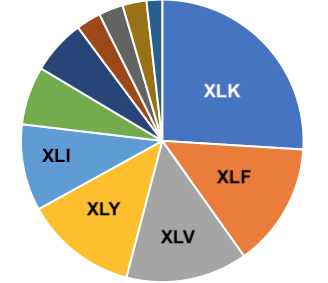
There are, of course, other key sectors and I am focused on industrials and healthcare this week. The Industrials SPDR (XLI) accounts for around 10% of the S&P 500, while the Health Care SPDR (XLV) weighs in at 13.93%.
XLI has a bull flag working the last two weeks and XLV is challenging a resistance zone. Breakouts in these two would signal expanding strength and this would be further bullish for the broader market. Today I will look at QQQ, XLI, XLV and the setups in some key components stocks.
Broad Strength in QQQ
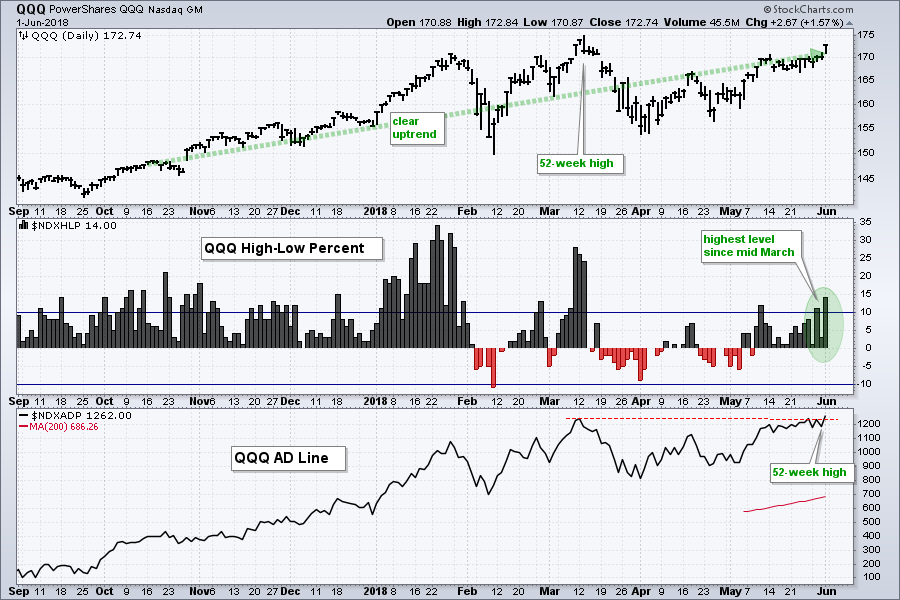
The Nasdaq 100 ETF (QQQ) shows broad strength with several key components hitting 52-week highs. The chart below shows QQQ in an uptrend and within spitting distance of its March high, which is a 52-week high. The middle window shows High-Low Percent moving to its highest level since mid March and this shows an expansion of new highs. The lower window shows the QQQ AD Line hitting a new high last week and this reflects broad participation within the Nasdaq 100.
Nvdia and Netflix Lead the Top 10
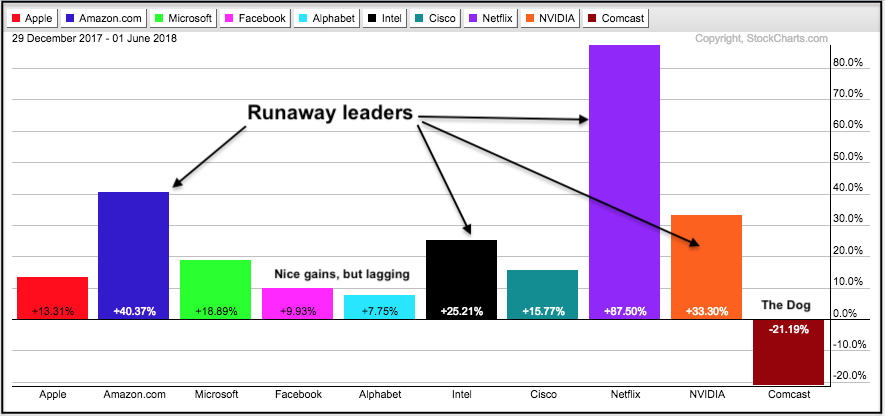
Outside of Comcast (CMCSA), which is down 21% year-to-date, Alphabet (GOOGL) is the least strong of the top ten stocks in QQQ. The PerfChart below shows year-to-date performance for the top ten stocks. Netflix, Amazon, Nvidia and Intel are leading with gains greater than 25%. Microsoft, Apple and Cisco show respectable gains in the 13-19% range, but Facebook and Alphabet are the laggards with gains less than 10%. This is really hard to believe! The laggards are up significantly, just not as much as the others.
Google Gets its Mojo Back
Even though Microsoft, Apple and Intel are lagging the high flyers, they are certainly not weak and their charts are strong. The chart below shows QQQ and seven top components. First, QQQ broke out of a pennant and is near a new high. Second, notice that the top two stocks also broke out of pennants and hit new highs on Friday. Microsoft, the third biggest weighting, extended its steady uptrend and hit a new high.
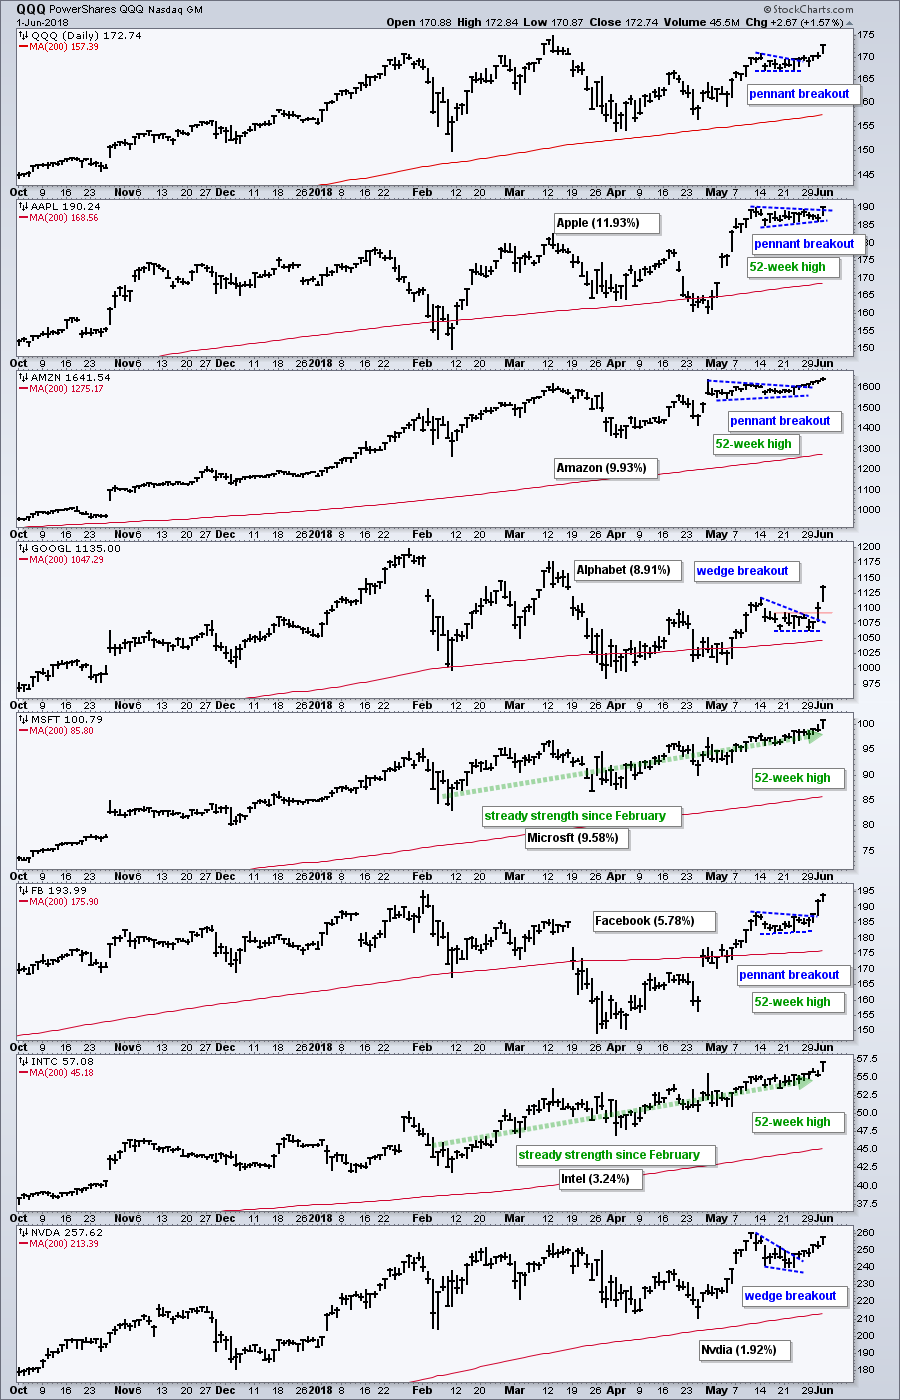
Elsewhere, note the steady uptrend in Intel, the wedge breakouts in Alphabet and Nvdia, and the pennant breakout in Facebook. I am especially impressed with Alphabet because this stock was lagging somewhat and regained its mojo with the wedge breakout.
Lots of Bull Flags within XLI
My eyes are on the Industrials SPDR (XLI) as the ETF forms a bull flag after the May surge. The chart shows XLI surging some 7% in May and then correcting with a pullback into early June. This pullback looks like a bull flag and a breakout would signal a continuation higher. Note that there is also a bigger falling wedge breakout in play. This falling wedge represent a big correction after the big advance from November 2016 to January 2018. Thus, a falling wedge breakout would project a move to new highs.
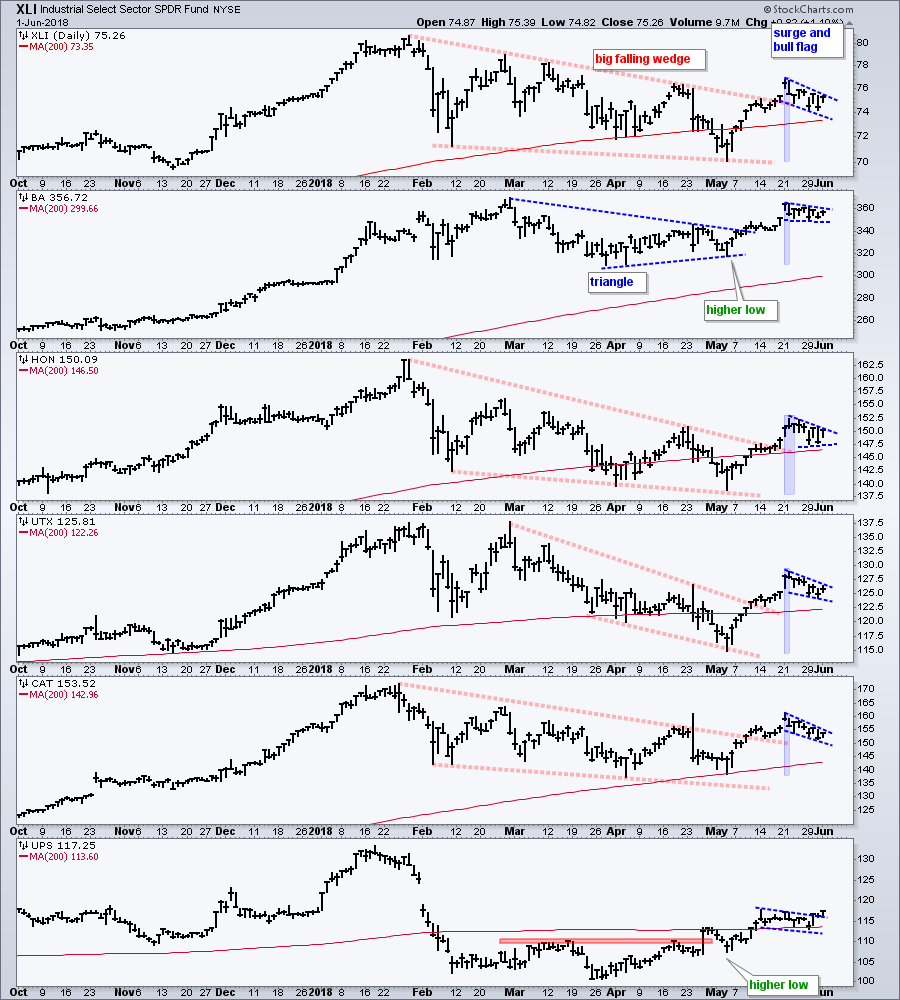
The other windows show key components with flags and pennants working. Boeing (BA) and UPS showed some relative strength from late March to early May as they formed higher lows. In contrast, XLI, SPY and the others formed lower lows. BA has a bull flag/pennant working and UPS broke out of its consolidation on Friday.
Merck and Pfizer Break Out of Triangles
The Health Care SPDR (XLV) is lagging the broader market because it has yet to break above its late April high (red resistance zone). A breakout at 84 is needed to put the third biggest sector in the S&P 500 back on the bullish track.
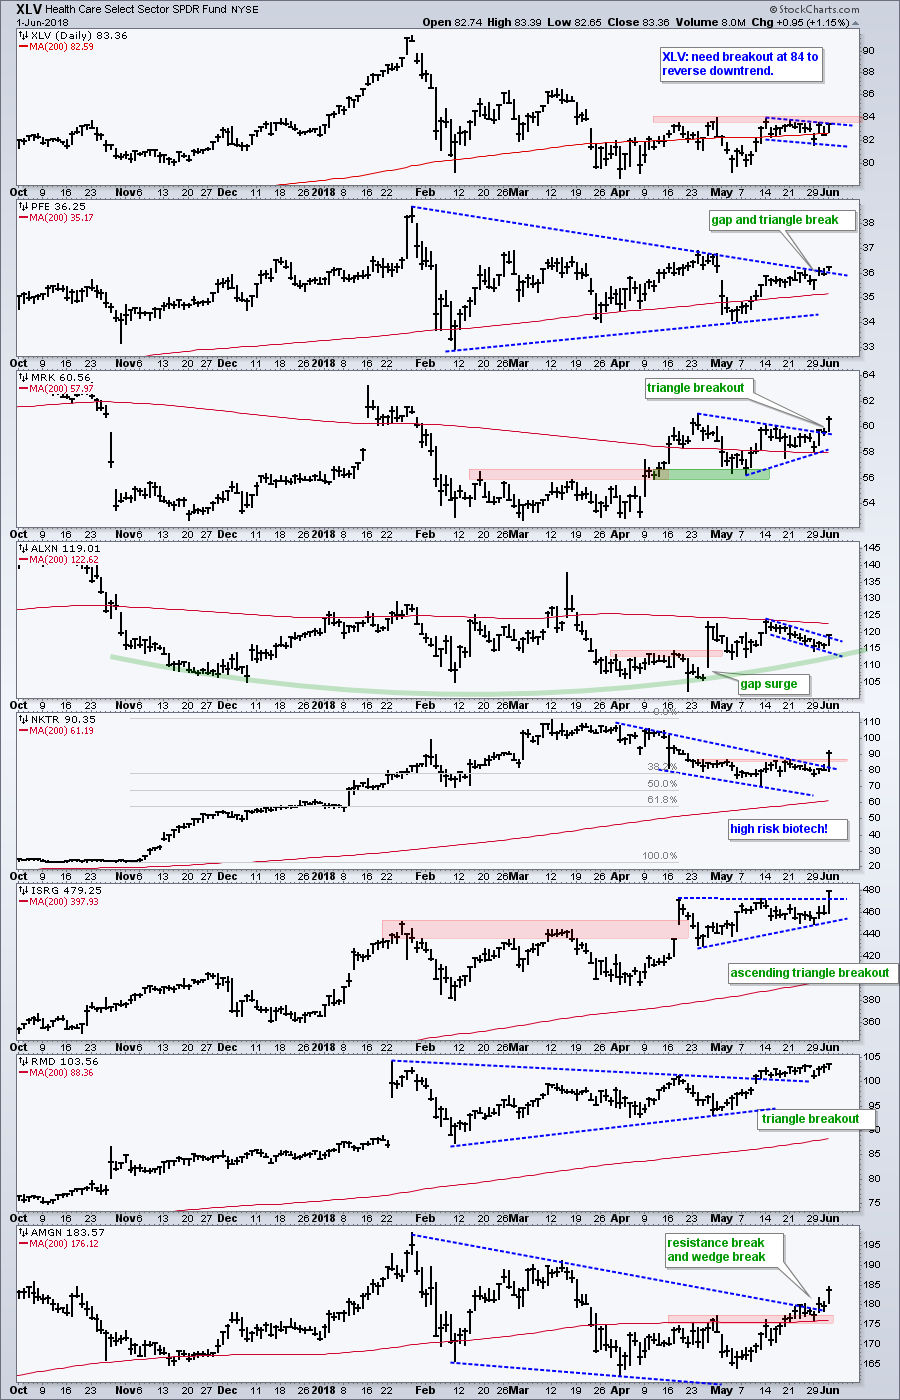
Within the sector, I am noticing bullish price action in Pfizer (PFE) with a gap on Wednesday and break above the triangle line on Friday. Merck (MRK) really came to life the last three days by breaking out of a five week consolidation. This signals a continuation of the April surge. Elsewhere, I noted last week that IBB formed a bull flag and the XBI surged off support in mid May.
Questions, Comments or Feedback?
I cannot promise to response to all correspondence, but I will read it and take into under consideration. I greatly appreciate all feedback because it helps me improve the commentary and provides ideas for the future. Cheers!

Plan Your Trade and Trade Your Plan.
- Arthur Hill, CMT
Senior Technical Analyst, StockCharts.com
Book: Define the Trend and Trade the Trend
Twitter: Follow @ArthurHill


