- Long-term Trend for Oil is Clearly Up.
- RSI Dips into "Oversold" Zone.
- Confirming with Nearby Futures.
- Finding Futures Symbols.
- Oil & Gas Equip & Services SPDR Lags Oil.
- XES Tests Bullish Resolve.
 ...Long-term Trend for Oil is Up
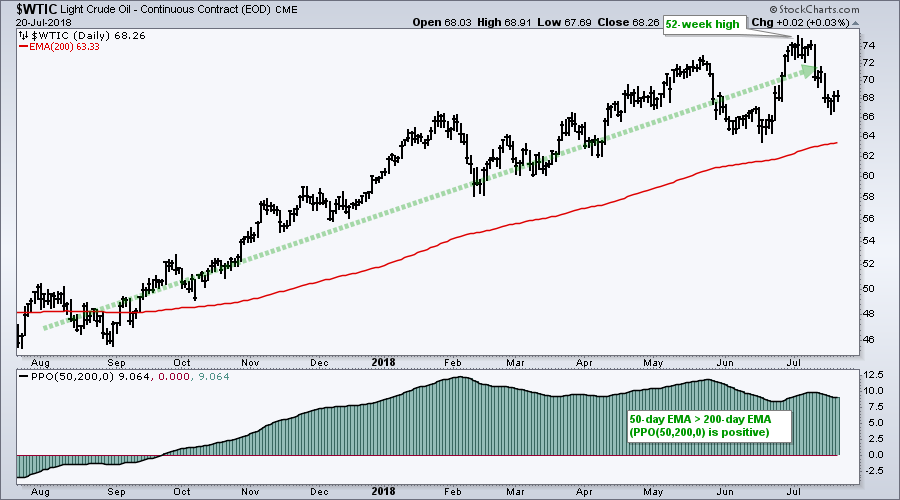
...Oil pulled back over the last few weeks with a decline of around 10% from high to low. A 10% decline may seem large, but it is still within the context of a bigger uptrend. Keep in mind that oil hit a 52-week high in early July, the 50-day EMA is above the 200-day EMA and price is well above the rising 200-day EMA.
The first chart shows daily bars over the past year for the Light Crude Continuous Contract ($WTIC) with the indicators described above. Notice that the 50-day EMA has been above the 200-day EMA since late September, which is when the PPO(50,200,0) crossed into positive territory.
RSI Dips into "Oversold" Zone
The next chart shows the USO Oil Fund (USO) with 10-period RSI to identify short-term pullbacks within the bigger uptrend. Ideally, RSI dips below 30 to become short-term oversold and then moves above 30 for a mean-reversion signal. Prior signals occurred in mid February and early June (blue vertical lines).
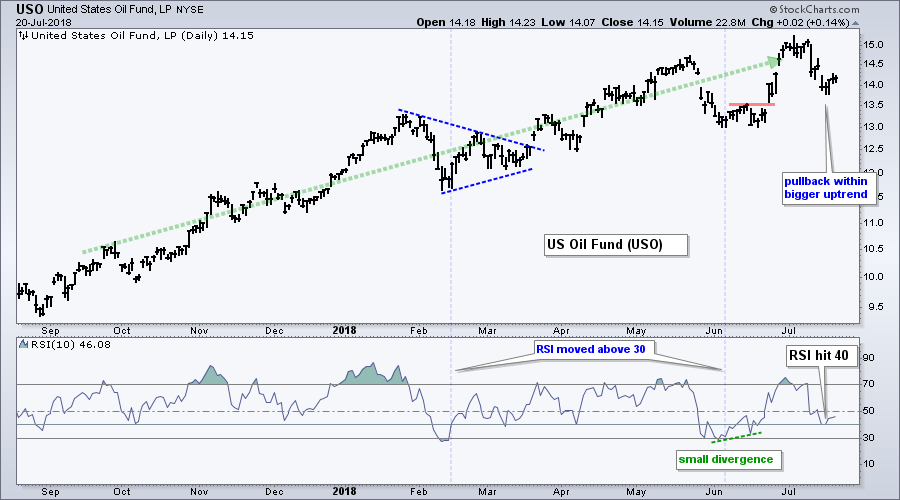
RSI dipped below 40 last week and we do not have an "ideal" setup (dip below 30). Markets are not always ideal and sometimes we must allow for some flexibility in our analysis. I often use an oversold zone for RSI and go on mean-reversion alert when RSI dips into the 20-40 zone. This means I am on alert for an upturn in prices and a reversion back to the bigger trend.
Confirming with Nearby Futures
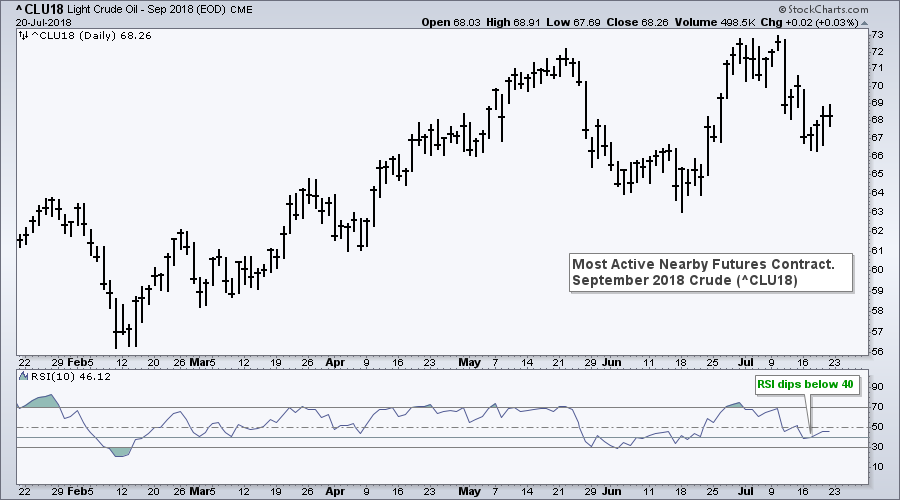
StockCharts users can also chart the nearby futures contracts for oil and several other commodities. This is end-of-day (EOD) data so the charts do not update until after the close. The chart below shows September Crude Futures (^CLU18) falling from the 73 area to the 67 area in mid July. RSI dipped below 40 with as oil fell below 67 last Monday and then edged above 40 as oil moved back above 68.
Finding Futures Symbols
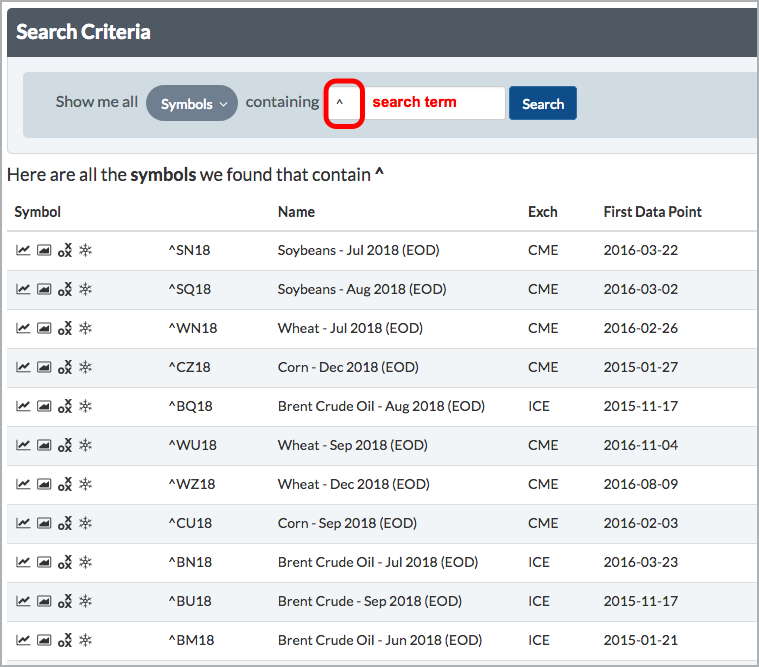
Even if you do not trade futures contracts, it is helpful to know what is happening with the nearby contract for a commodity because the price action of these contracts usually drives the value of the ETF. Chartists can find futures symbols by searching for a caret (^) because these symbols all begin with a caret. The table below shows the first 11 results for reference.
Oil & Gas Equip & Services SPDR Lags Oil
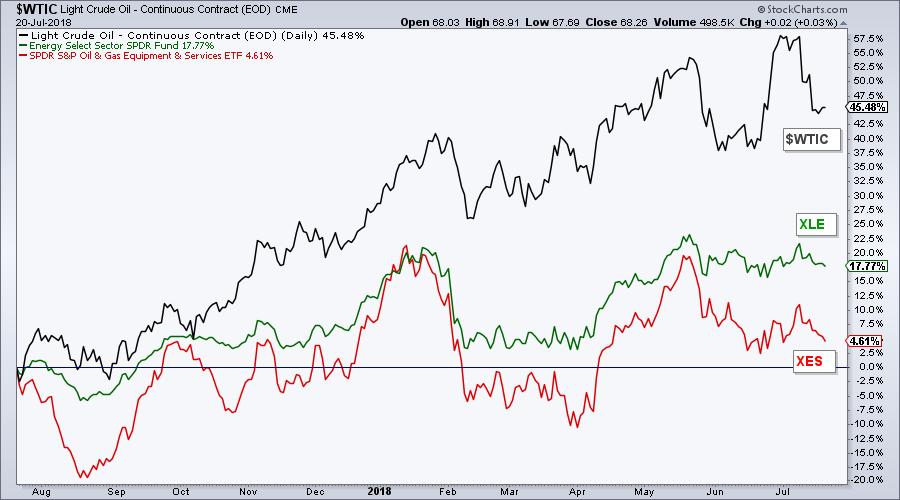
The Oil & Gas Equip & Services SPDR (XES) continues to struggle relative to oil. Note that oil is up around 45% over the past year, but the Oil & Gas Equip & Services SPDR (XES) is up less than 5% since July 2017. For reference, the Energy SPDR (XLE) is up 17.7% over the past year.
XES Tests Bullish Resolve
The Oil & Gas Equip & Services SPDR is in a slight uptrend overall, but there was not follow through to the mid-July breakout as the ETF fell back the last two weeks. Overall, I would consider the long-term trend slighty up because the 50-day EMA is above the 200-day EMA (not shown), XES is up over the past year and the ETF did record a 52-week high in January.
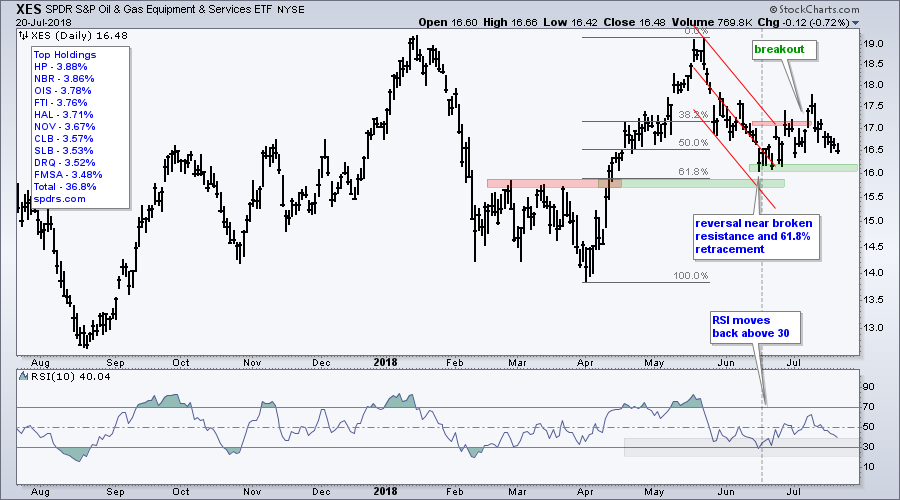
The May-June decline looked like a correction after a sharp advance and the ETF reversed near broken resistance and the 61.8% retracement. This is where one would normally expect a reversal. The breakout in mid July looked pretty good, but there was no follow through as XES fell back to the 16.5 area. Despite this post-breakout decline, I am not ready to turn bearish on XES. There is clear support at 16 and a close below this level would argue for a reassessment.
Questions, Comments or Feedback?
I cannot promise to response to all correspondence, but I will read it and take into under consideration. I greatly appreciate all feedback because it helps me improve the commentary and provides ideas for the future. Sorry, I do not take symbol requests.

Plan Your Trade and Trade Your Plan.
- Arthur Hill, CMT
Senior Technical Analyst, StockCharts.com
Book: Define the Trend and Trade the Trend
Twitter: Follow @ArthurHill


