- Breaking Down the Materials Sector.
- Materials SPDR Battles Wedge Breakout.
- Small-cap Materials Sector Leads XLB.
- Establishing an Analytical Bias First.
- Steel ETF Surges off Support.
- Three International Mining/Steel Stocks.
- Three US-Based Steel Stocks.
 ... Today we are going to dive into the materials sector. I will start by comparing the cap-weighted Materials SPDR (XLB) with the EW Materials ETF (RTM) and the SmallCap Materials ETF (PSCM). I will then break down the sector by looking at the Metals & Mining SPDR (XME) and the Steel ETF (SLX). The Industrials SPDR (XLI) made a move in July and steel stocks are perking up. This combination could bode well for the materials sector. Note that I am not going to cover the Gold Miners ETF (GDX) because it is near a 52-week low and the Copper Miners ETF (COPX) because it recorded a 52-week low. Why mess with laggards and downtrends!
Materials SPDR Battles Wedge Breakout
The first chart shows the Materials SPDR (XLB) battling to hold its wedge breakout. Before analyzing the chart, note that XLB is largely weighted by market-cap with DowDupont (DWDP) accounting for a whopping 22.8% of the ETF. XLB is clearly dominated by large-caps with the top six stocks accounting for over 50%.
On the price chart, the long-term trend is up because the ETF recorded a 52-week high in January and the PPO(10,40,0) is positive, which means the 10-week EMA is above the 40-week EMA. After hitting the 52-week high, XLB corrected with a falling wedge that retraced 38-50% of the prior advance. Both the retracement amount and the pattern are typical for corrections within a bigger uptrend. Also keep in mind that XLB advanced over 40% from October 2016 to January 2018 so it was clearly entitled to a correction or rest.
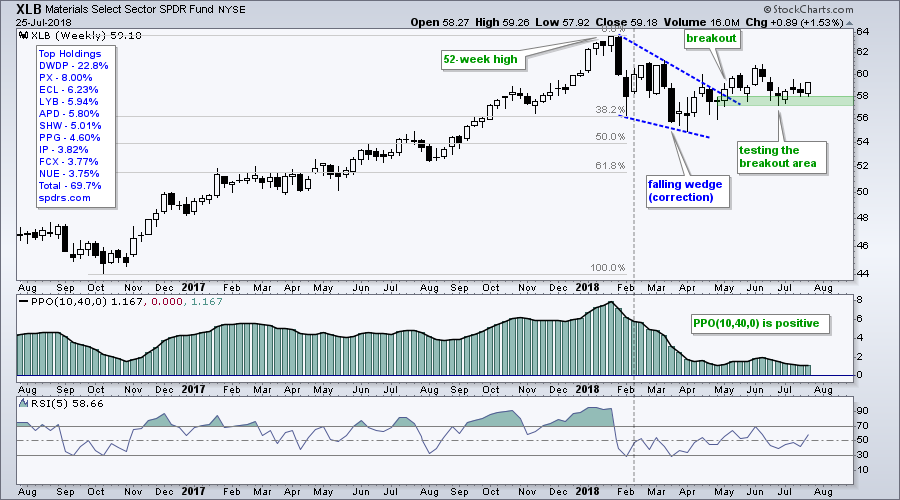
What now? The wedge breakout is holding for the most part, but XLB is lagging the broader market in 2018. The S&P 500 is near its January high and XLB remains well below this high. Nevertheless, the wedge breakout is bullish until proven otherwise and I will expect higher prices until the evidence changes. A weekly close below 57 would negate the breakout and call for a reassessment.
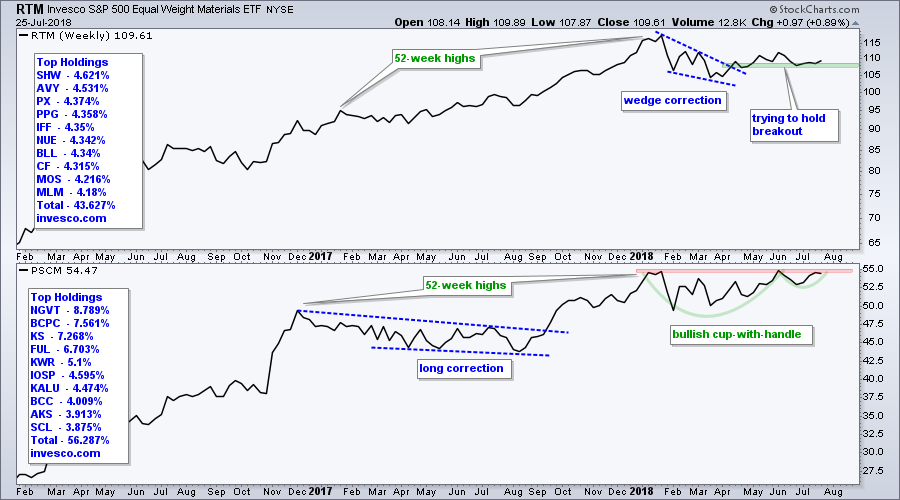
Small-cap Materials Sector Leads XLB
Even though volume is too low to trade the Equal-Weight Materials ETF (RTM) and the SmallCap Materials ETF (PSCM), they can still be used for analysis. I prefer ETFs for sector and industry group analysis because it is relatively easy to identify the components and component weightings. Just go to the provider's website, which is Invesco.com in this case.
The EW Materials ETF reflects the performance of the "average" stock in the sector, while the SmallCap Materials ETF reflects the performance of small-cap materials stocks. The RTM chart is quite similar to the XLB chart, but PSCM is much stronger because it is close to a 52-week high. In fact, a bullish cup-with-handle pattern is taking shape.
Establishing an Analytical Bias
When looking at a chart, the first order of business is to establish your analytical bias: bullish or bearish. I usually look at the long-term trend to establish this bias (52-week highs/lows, long-term EMAs, peak-trough analysis). My analytical bias is bullish when the long-term trend is up and bearish when the long-term trend is down.
When my analytical bias is bullish, I ignore bearish patterns and focus on bullish setups or outcomes. My assumption here is that the bigger trend is the dominant force and it will continue, not reverse. Sure, there will be a reversal at some point, but there are often more continuations before the trend actually reverses.
XME is not a leading ETF at the moment, but the long-term trend is up and this means my analytical bias is bullish. The ETF broke out of a wedge in May and fell back to the 35 area in June. XME got a bounce over the last four weeks and this establishes the first support level to watch. The wedge breakout is bullish and this means I expect new highs in the coming weeks or months. A close below the June low would call for a re-evaluation.
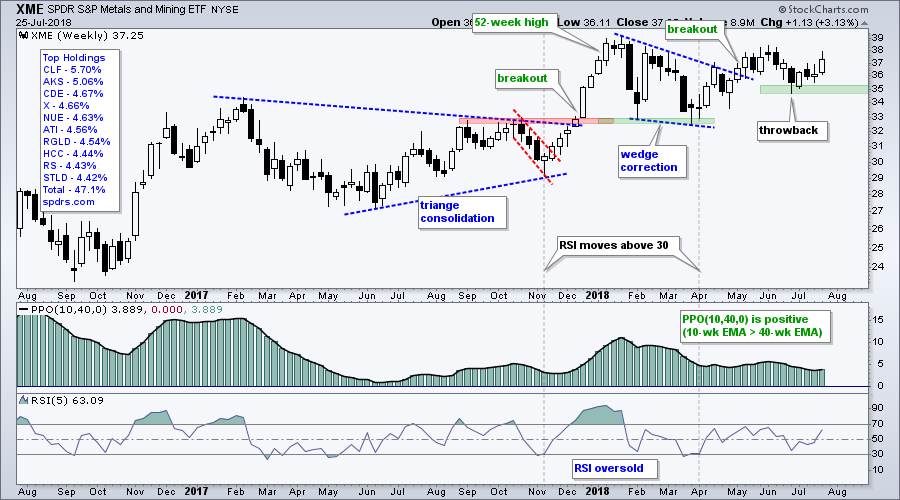
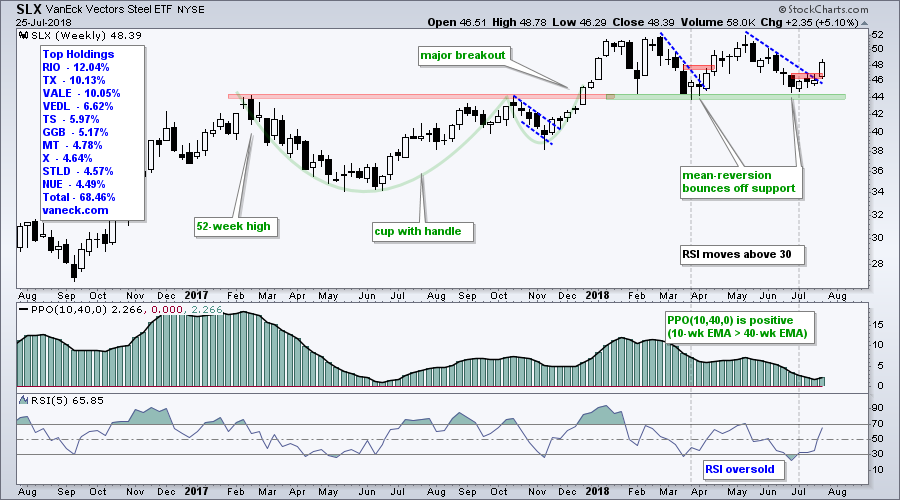
Steel ETF Surges off Support
The Metals & Mining SPDR (XME) is heavily weighted to the steel industry (53%) and most of these are US based steel stocks. The Steel ETF (SLX), in contrast, is heavily weighted toward foreign steel and mining stocks. The top seven stocks are non-US and account for around 55% of the ETF. Keep this in mind if choosing between the two.
SLX is also in an uptrend because it recorded a 52-week high in February and the PPO(10,40,0) is positive. The stock fell back to support from the 2018 lows in June and surged off these lows the last four weeks. Also notice that RSI became oversold in June and moved above 30 just before prices turned back up.
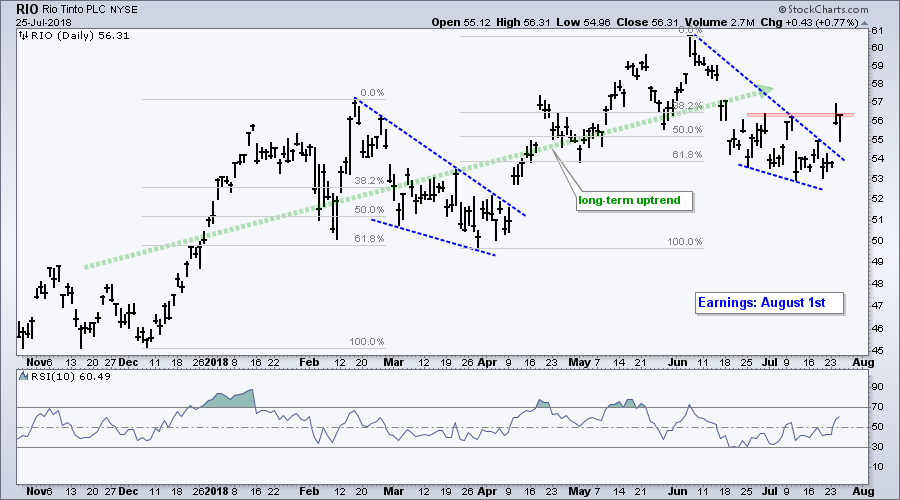
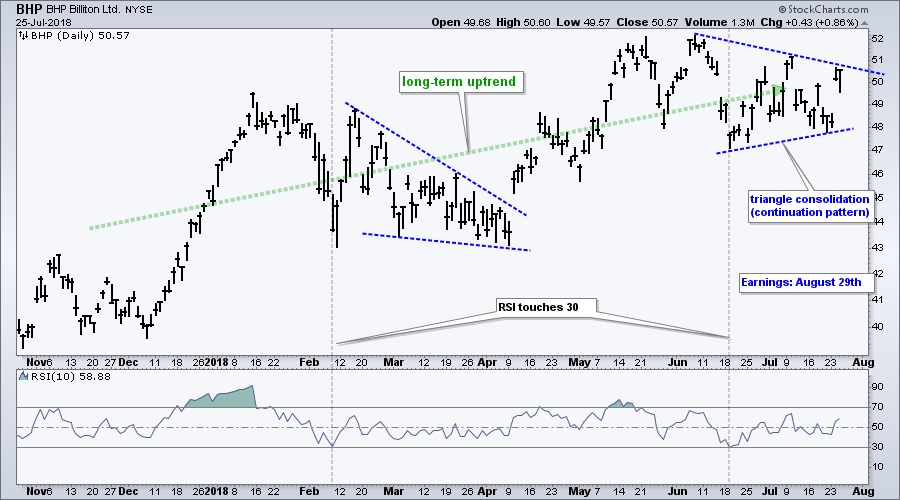
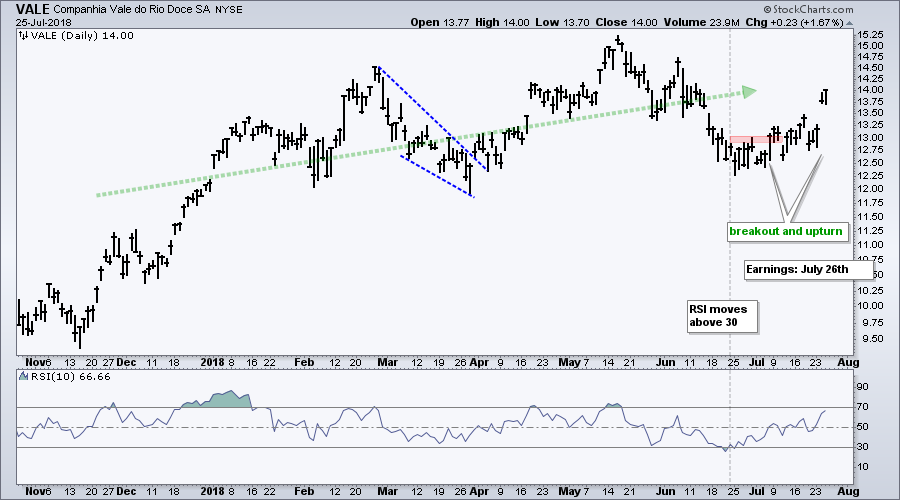
Three International Mining/Steel Stocks
The first chart shows RIO Tinto (RIO) with a wedge pullback into July and a surge to first resistance over the last two days. Note that the earnings dates are shown on the charts.
The second chart shows BHP Billiton (BHP) with a triangle consolidation and a long-term uptrend. A consolidation within an uptrend is typically a bullish continuation pattern so a breakout is expected.
The third chart shows Companhia Vale (VALE) becoming oversold in late June and turning up in early July. The stock extended this upturn with a surge the last two days.
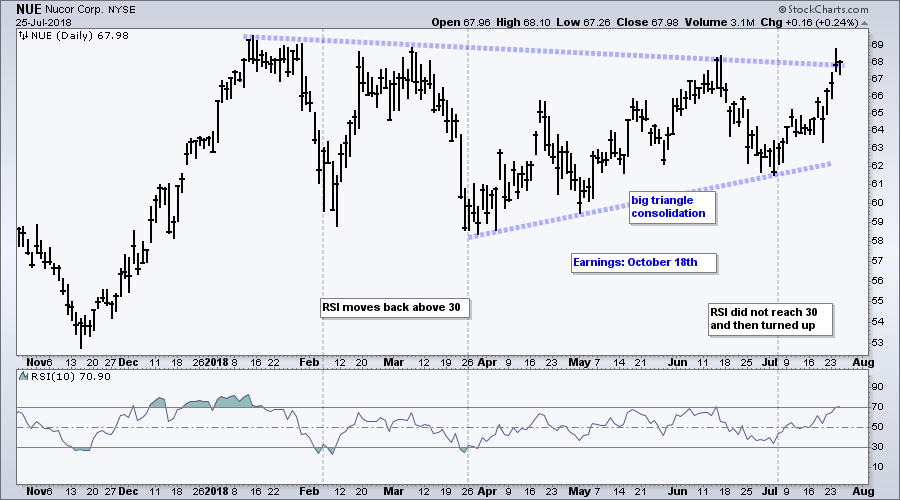
Three US Based Steel Stocks
The first chart shows Nucor (NUE) with a massive triangle that extends from January to July. The stock surged in July and is on the verge of breaking the upper trend line.
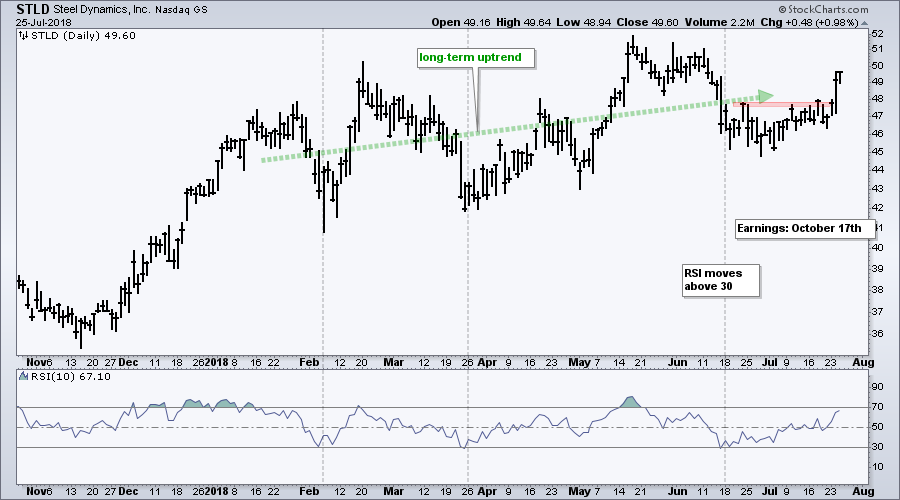
The second chart shows Steel Dynamics (STLD) with a series of rising peaks and rising troughs this year. The long-term trend is clearly up and the stock broke short-term resistance with a surge the last two days.
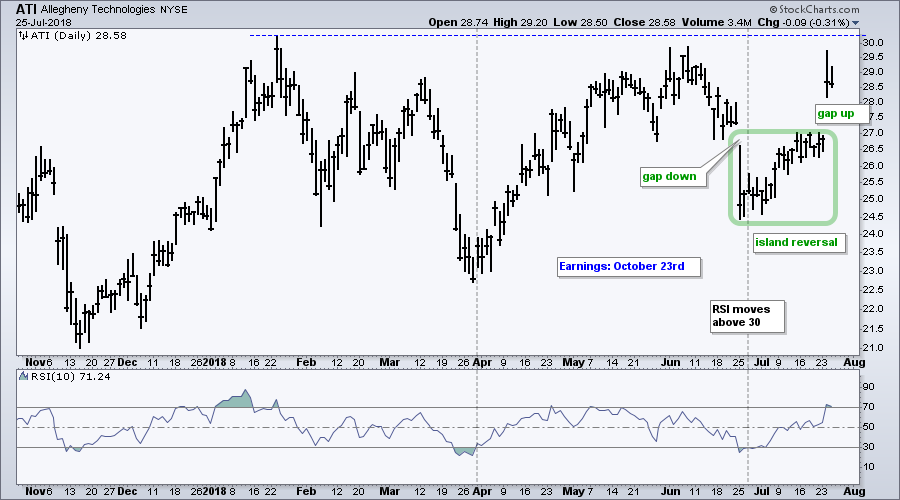
The third chart shows Allegheny Technologies (ATI) forging an island reversal with a gap below 27 and a gap above 27. The stock is very close to a 52-week high.
Questions, Comments or Feedback?
I cannot promise to response to all correspondence, but I will read it and take into under consideration. I greatly appreciate all feedback because it helps me improve the commentary and provides ideas for the future. Sorry, I do not take symbol requests.

Plan Your Trade and Trade Your Plan.
- Arthur Hill, CMT
Senior Technical Analyst, StockCharts.com
Book: Define the Trend and Trade the Trend
Twitter: Follow @ArthurHill


