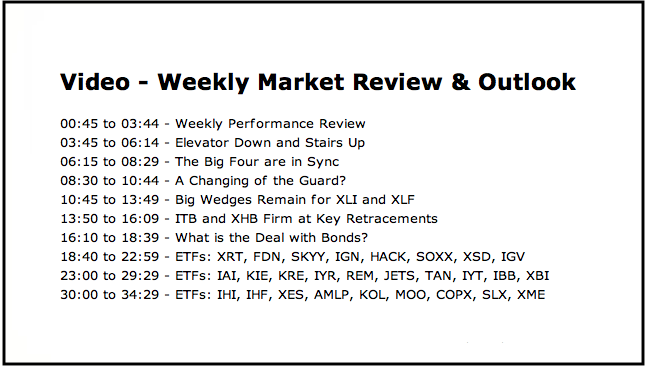
- Weekly Performance Review.
- Elevator Down and Stairs Up.
- The Big Four are in Sync.
- A Changing of the Guard?
- Big Wedges Remain for XLI and XLF.
- ITB and XHB Firm at Key Retracements.
- What is the Deal with Bonds?
- Notes from the Art's Charts ChartList.
 ...There is an old saying on Wall Street that stocks take the elevator down and the stairs up. This suggests that declines are often sharp and swift, while advances are rather laborious affairs that occur in stair-step fashion.
This elevator-stairs scenario fits for most of 2018. The S&P 500 took the elevator down with a ten day 10% decline from late January to early February. A volatile bounce and retest of the early February low followed and the index then began its stair-step higher.
As the chart below shows, this benchmark index has been working its way higher since early April and exceeded its March high in mid July. Even though the index has yet to record a new high, the higher highs continue and the index is around 2.5% from a new high.
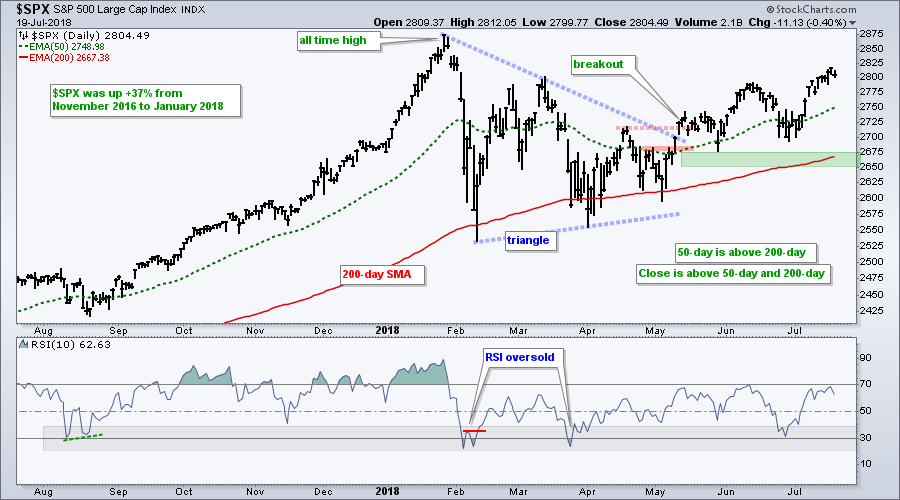
I will refrain from speculating on resistance from the January high or the possibility of a failed breakout at the March high. The trend is up and we should not be concerned with resistance levels in an uptrend. Also note that the 50-day EMA is above the 200-day EMA, price is above the 200-day EMA and the 200-day EMA is rising.
Resistance does not matter because higher highs are expected in an uptrend. Support is what really matters because support holds the true key to the uptrend. The May low and rising 200-day EMA mark my key support zone in the 2650-2675 area.
The Big Four are in Sync
Even though the S&P 500 and the S&P 500 SPDR (SPY) are my main benchmarks for the stock market, note that the Nasdaq 100 ETF (QQQ), S&P SmallCap iShares (IJR) and S&P MidCap SPDR (MDY) recorded fresh 52-week highs this month. These ETFs represent around 2/3 of the S&P 1500 and their new highs are clearly positive for the broader market.
The chart below shows year-to-date closing prices and four key points. First (red 1), IJR had the smallest decline of the four and was one of the first to reclaim its 52-week high (March 12th). Second, IJR and QQQ both hit new highs on March 12th and these two showed the most chart strength after the plunge.
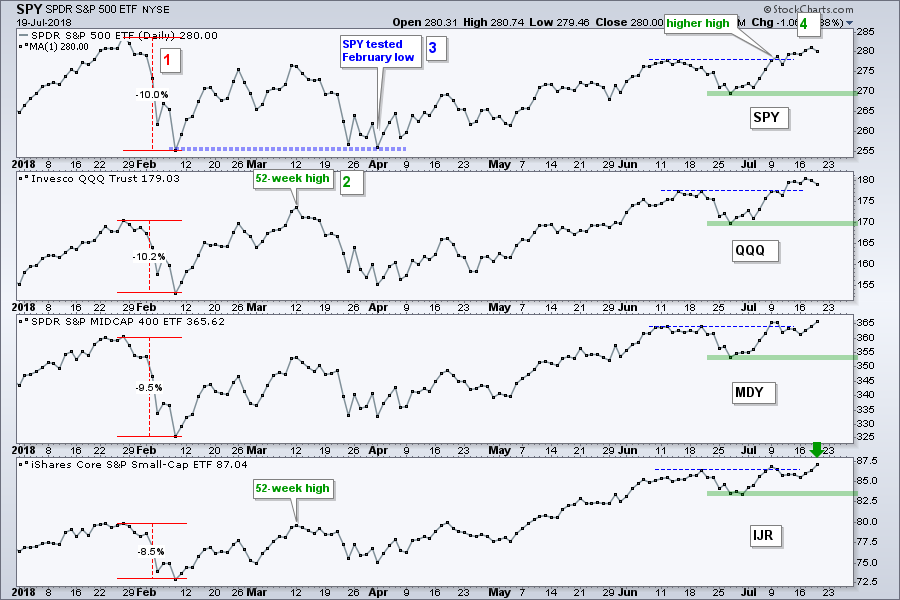
Third, SPY tested its February low in early April, but IJR and QQQ held well above this low. This was a sign of relative "chart" strength and these two show the biggest gains since early April (~15%). Fourth, all four ETFs exceeded their June highs and forged higher highs this month. This means all four are in sync.
The green lines mark first support at the late June low. The bears do not have a leg to stand on until these lows are broken.
A Changing of the Guard?
July has been an interesting month because we saw several lagging groups suddenly lead the market. Note that the Financials SPDR (XLF), Industrials SPDR (XLI), Homebuilders SPDR (XHB), Home Construction iShares (ITB) and Airline ETF (JETS) are down year-to-date and were down between 4 and 12.5% at the end of June.
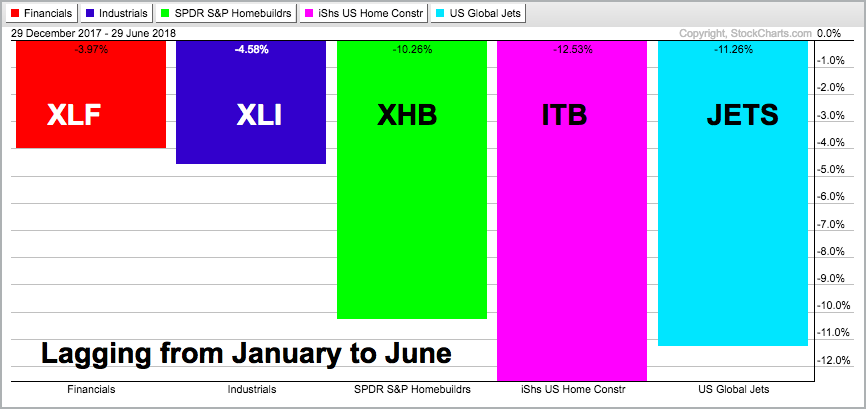
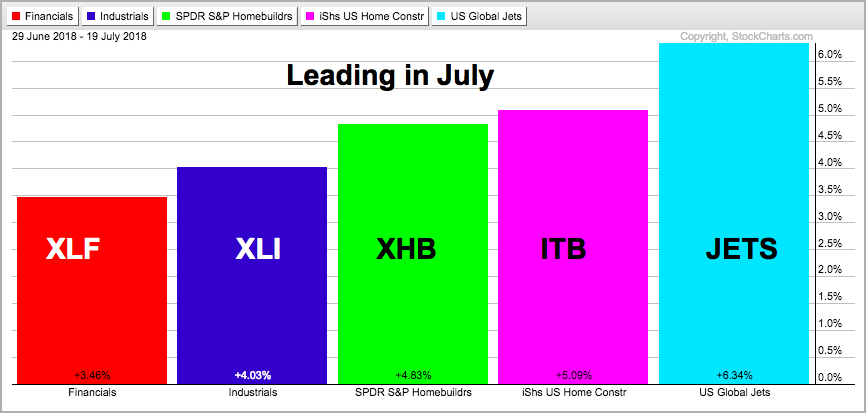
These five turned around and led the market in July with gains ranging from 3.5% for XLF and 6.83% for JETS. The July gains are impressive, but they do not tell us about the overall trend. As always, we need a price chart to put this performance into perspective.
Big Wedges Remain for XLI and XLF
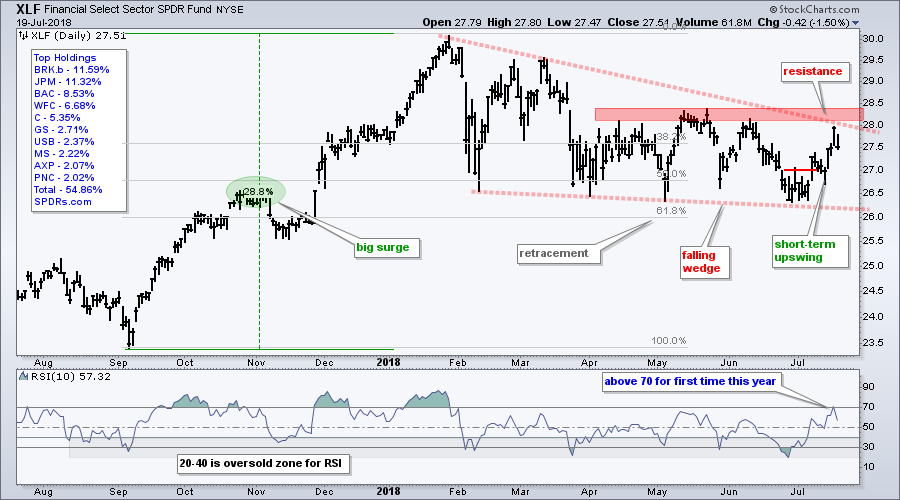
Let's start with XLI and XLF because breakouts in these two sectors would be very positive for the broader market. Note that I covered these two on Monday as they bounced off their May lows. I did some redrawing on the charts and both remain in downtrends since late January. The July surges represent short-term uptrends within these bigger downtrends.
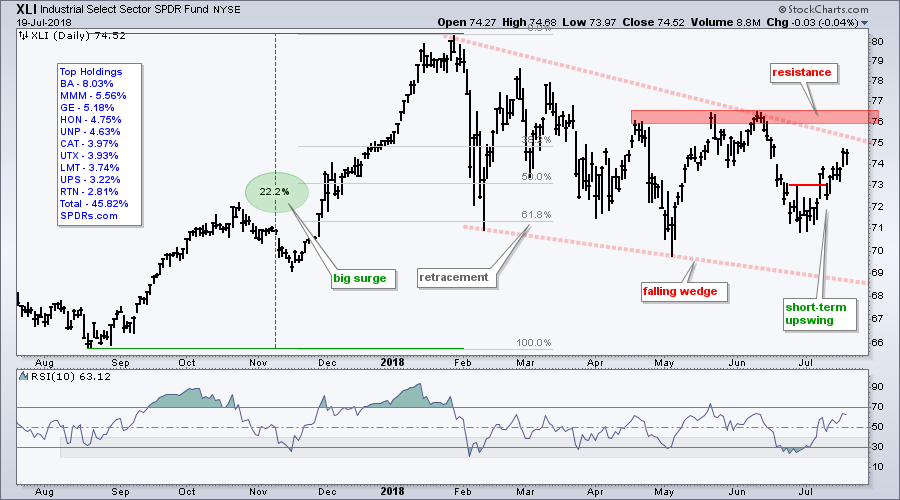 Truth-be-told, not much has changed regarding the bigger picture. Both ETFs surged into January with big gains and then declined into June with falling wedges that retraced around 61.8%, give or take a few points. A falling wedge after a big advance is typically a corrective pattern and a break above the spring highs would end this correction. Long-term, this is what we need to watch going forward.
ITB and XHB Firm at Key Retracements
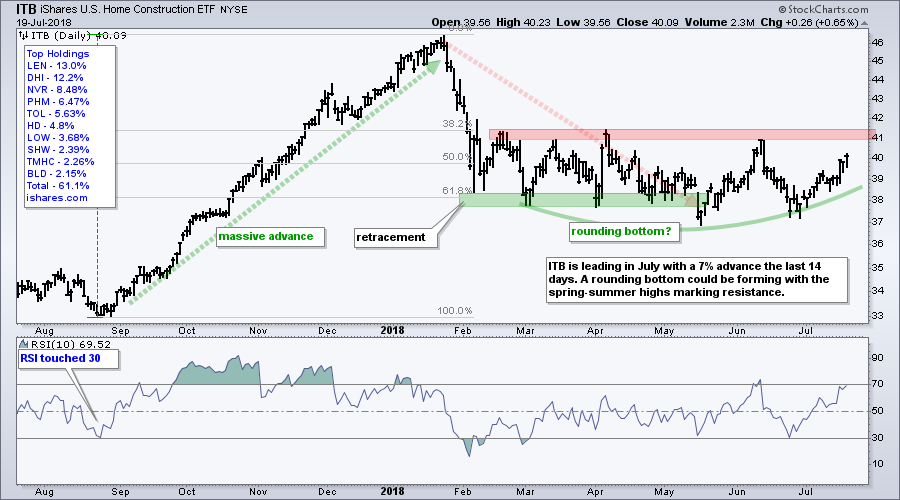
The Home Construction iShares (ITB) and Home Builders SPDR (XHB) hit new highs in January, corrected hard into early February and then worked their way lower into May-June. They overshot the 61.8% and 2/3 retracements, but rounding bottoms of sorts could be taking shape the last few months. The spring-summer highs mark key resistance and breakouts are needed to fully reverse the downtrends.
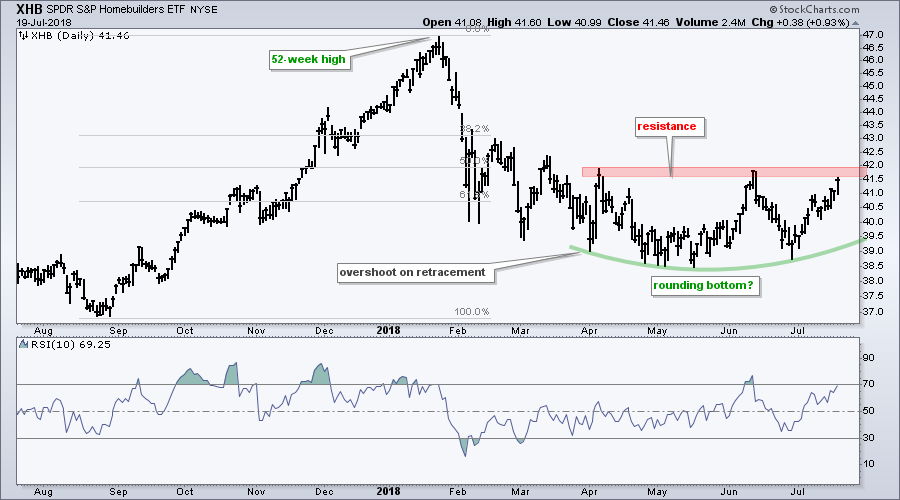 Before getting excited about ETFs and stocks that suddenly show leadership in July, keep in mind that we have yet to see actual trend reversals and these groups are still lagging year-to-date. They are clearly not "On Trend" because they remain below their mid June highs. My preference would be to wait for a breakout and then look for a pullback or short-term oversold condition after the breakout.
What is the Deal with Bonds?
The 7-10 YR T-Bond ETF (IEF) and the 20+ YR T-Bond ETF (TLT) are tracing out bullish reversal patterns. IEF has an inverse head-and-shoulders working and TLT has a double bottom. TLT is on the verge of a breakout, while IEF remains just shy of resistance.
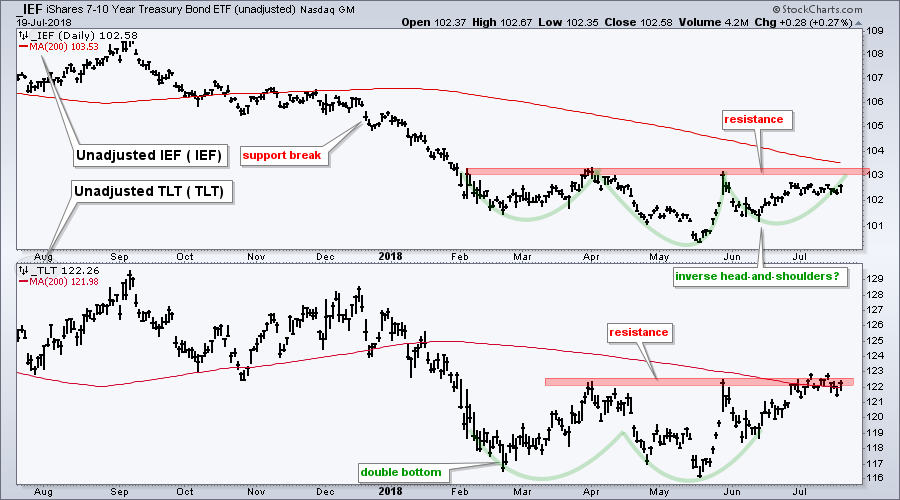 Further upside would be quite bullish for bonds and point to lower Treasury yields. This would be positive for bond proxies, such as utilities and REITs, but possibly negative for banks.
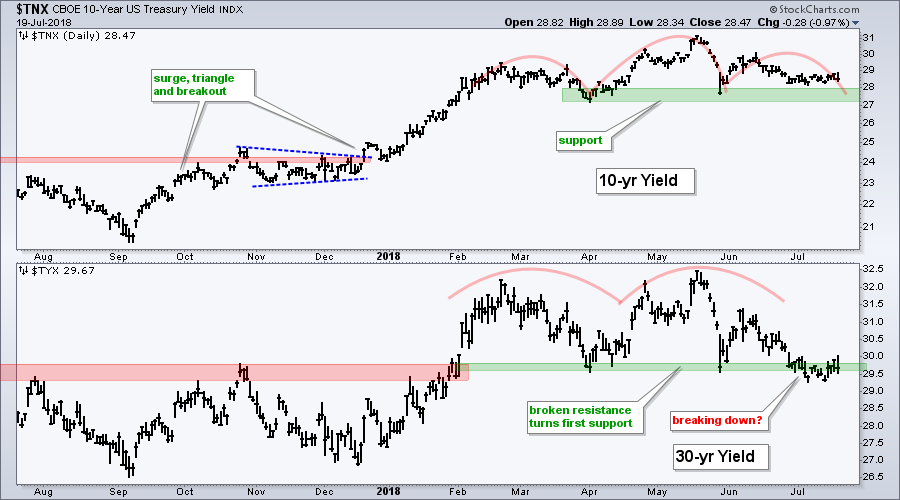 I am a bit perplexed by the strength in bonds because bonds typically rise for two reasons: absence of inflationary pressures and/or slower economic growth. Reading into the reasons is a dangerous game because nobody knows the true reason until after the fact.
It is also dangerous to make correlation inferences because relationships can change. Therefore, let's watch bonds and accept the price action without bias. The same holds for banking stocks, the stock market and bond proxies. Watch their charts and make your judgement based on their price charts, not the chart of another asset.
Notes from the Art's Charts ChartList
- The Home Construction iShares (ITB) is leading in July and could be forming a rounding bottom.
- The Retail SPDR (XRT) turned up the last two weeks and is close to a 52-week high.
- The Cloud Computing ETF (SKYY), Cyber Security ETF (HACK), Internet ETF (FDN) and Software iShares (IGV) dipped into late June and rebounded to new highs in mid July.
- The Semiconductor iShares (SOXX) has a mean-reversion bounce working as the ETF reversed near the 61.8% retracement and RSI moved above 30 (Ditto for XSD).
- RSI moved back above 30 for the Broker-Dealer iShares (IAI) and the Regional Bank SPDR (KRE). Mean-reversion bounces are underway.
- The Biotech iShares (IBB) and Biotech SPDR (XBI) surged and then formed flag flags.
- The Alerian MLP ETF (AMJ) broke out of a wedge in early July and surged the last two days.
- Click here for the Art's Charts ChartList
Questions, Comments or Feedback?
I cannot promise to response to all correspondence, but I will read it and take into under consideration. I greatly appreciate all feedback because it helps me improve the commentary and provides ideas for the future. Sorry, I do not take symbol requests.

Plan Your Trade and Trade Your Plan.
- Arthur Hill, CMT
Senior Technical Analyst, StockCharts.com
Book: Define the Trend and Trade the Trend
Twitter: Follow @ArthurHill


