- Oil Surges back above $70.
- XLE Turns Up within Range.
- XES Surges off Support.
- Chevron Bounces on Big Volume.
- Halliburton versus Baker Hughes.
 ... Oil Surges back above $70
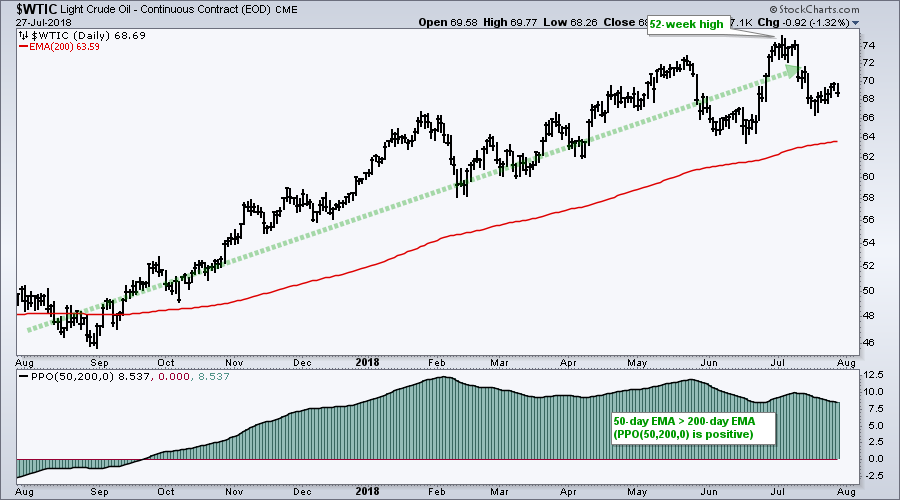
... Oil fell on Friday and rebounded on Monday to keep its mean-reversion bounce alive. I highlighted oil, XLE and the Oil & Gas Equip & Services SPDR (XES) last week as a mean-reversion setup took shape in oil. To recap: the long-term trend is up for oil and RSI dipped below 40 in mid July. An RSI dip below 30 would provide an ideal mean-reversion setup, but sometimes dips are shallower and we must make a judgement call.
The chart below shows the Light Crude Continuous Contract ($WTIC) hitting a new high in early July and the 50-day EMA above the 200-day EMA because the PPO(50,200,0) is positive. Oil is clearly in a long-term uptrend. Data on this chart will be updated after the close, but oil is up around 2% in early trading and back above $70.
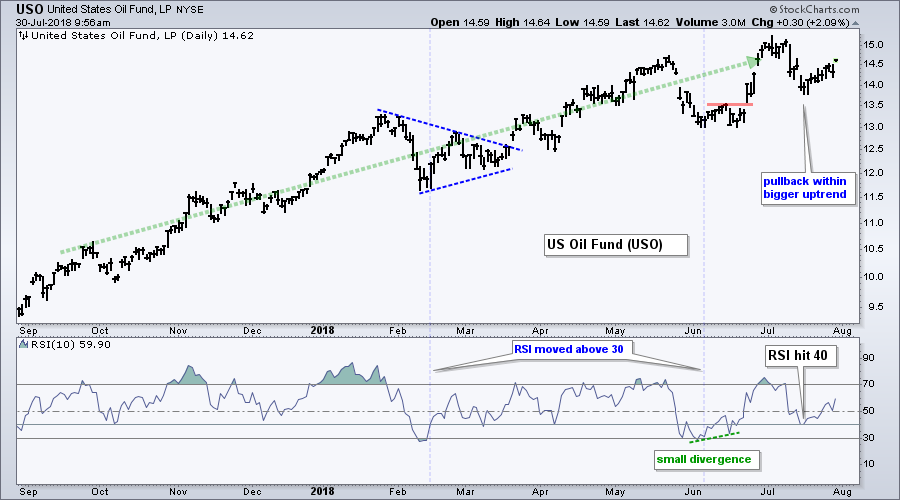
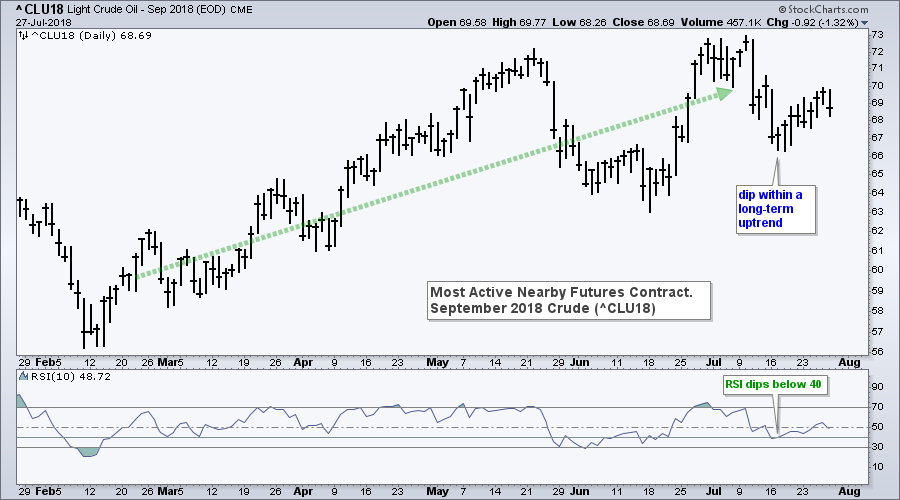
The next two charts show RSI dipping below 40 for the USO Oil Fund (USO) and September Crude Futures (^CL18). This dip below 40 created mild oversold conditions and oil bounced over the last nine days.
XLE Turns Up within Range
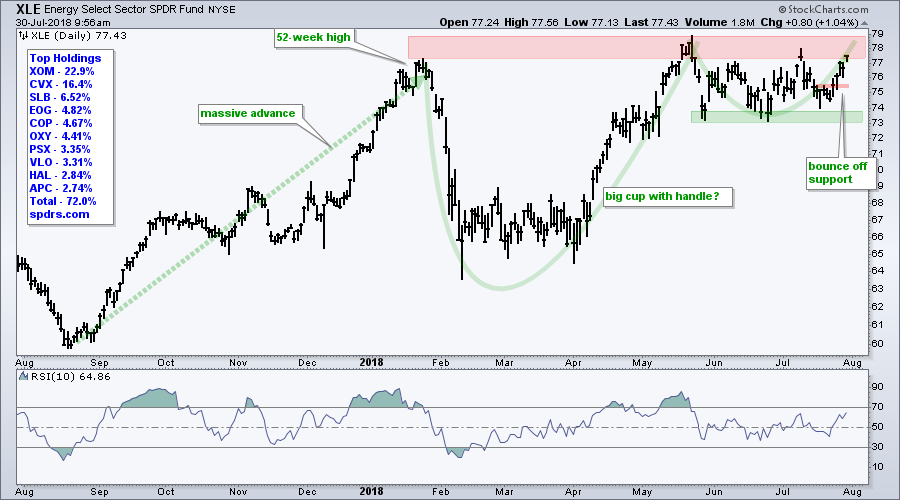
A bounce in oil could benefit the Energy SPDR (XLE) and the Oil & Gas Equip & Services SPDR (XES). The next chart shows XLE with a large cup-with-handle taking shape in 2018. This is a bullish continuation pattern that was popularized by William O'Neil of IBD. The breakout within the pattern is short-term bullish and a break above rim resistance would be long-term bullish.
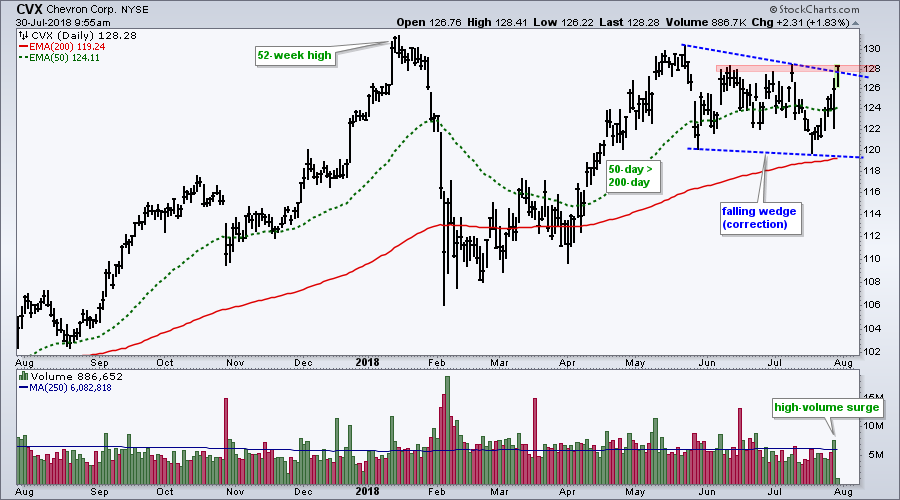
Chevron Bounces on Big Volume
Chevron (CVX) is the second largest holding in XLE and the stock surged on big volume Friday. Overall, the stock advanced from February to May and then corrected with a falling wedge into July. A break above resistance from the June-July highs would signal a continuation of the February-May advance and open the door to new highs.
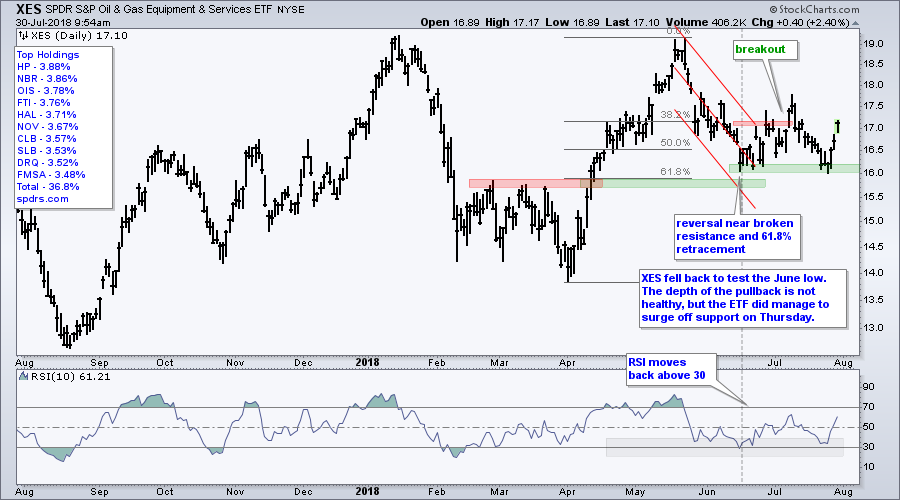
XES Bounces off Support
The next chart shows the Oil & Gas Equip & Services SPDR (XES) bouncing off support from the June low. This ETF appeared to break out in mid July, but fell all the way back to the June lows (16 area). This support zone is holding with the bounce over the last few days and 16 is the level to watch going forward. A close below 16 would negate the bounce and be negative.
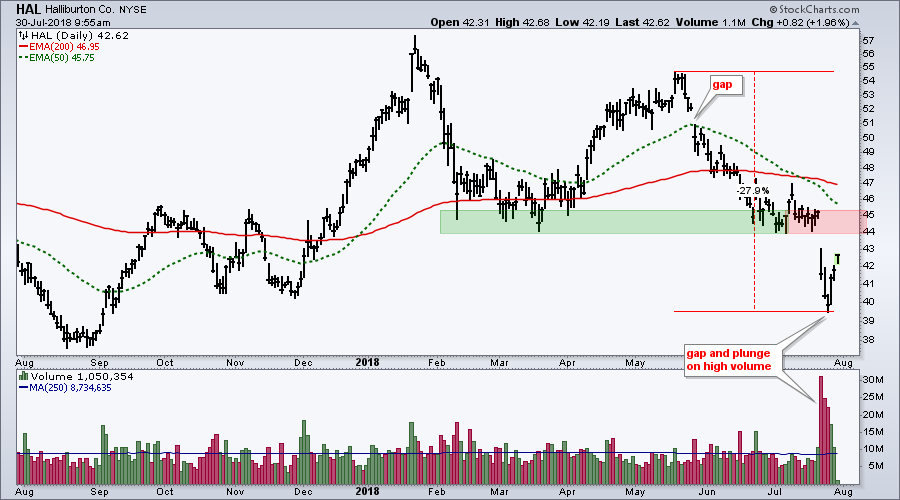
Halliburton versus Baker Hughes
Not all stocks in the Oil & Gas Equip & Services SPDR are on the same page and this is contributing to lackluster performance from the ETF. The next charts show two of the bigger players in the industry. Halliburton (HAL) gapped down in late May and fell over 25% from high to low. The stock gapped down again in late July and fell on high volume for three days last week. This looks like a selling climax that could give way to a bounce back to broken support in the 44-45 area.
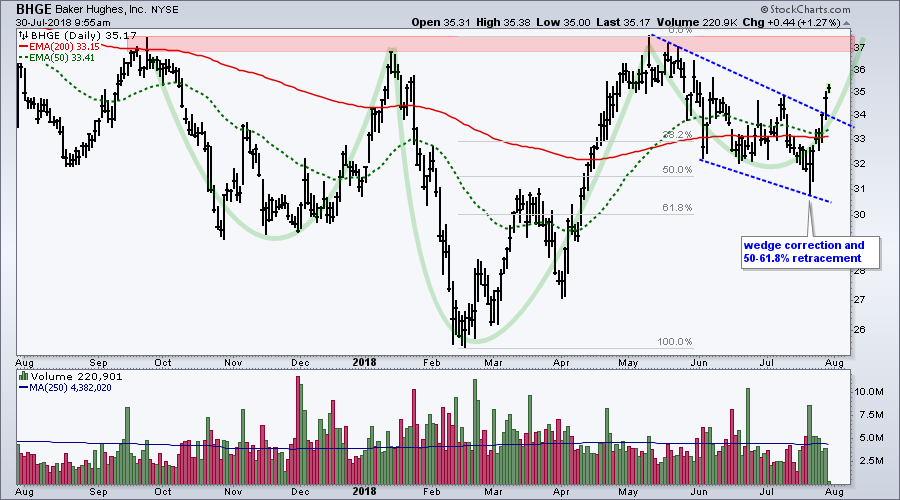
Baker Hughes (BHGE), which has been range bound since 2011, sports a large inverse head-and-shoulders pattern in 2018. Note that the stock has traded between 25 and 50 since 2011, and fell from 46 in December 2016 to 25 in January 2018. The right shoulder formed a falling wedge that retraced 50-61.8% of the February-May advance. This is normal for a correction after an advance. More importantly, the stock broke out of its wedge by advancing six days straight and this means a neckline challenge is next.
Questions, Comments or Feedback?
I cannot promise to response to all correspondence, but I will read it and take into under consideration. I greatly appreciate all feedback because it helps me improve the commentary and provides ideas for the future. Sorry, I do not take symbol requests.

Plan Your Trade and Trade Your Plan.
- Arthur Hill, CMT
Senior Technical Analyst, StockCharts.com
Book: Define the Trend and Trade the Trend
Twitter: Follow @ArthurHill


