- Pick your Timeframe to Suit your Message.
- Aroons Signal Consolidation in XLU.
- XLRE Breaks Out of Flag.
- REITs, Utilities and the 10-year Correlation.
- HACK Becomes Oversold in an Uptrend.
- The Dreaded Double Dip in RSI.
 .... Timeframe and Message
... The Utilities SPDR (XLU), the Energy SPDR (XLE) and the Real Estate SPDR (XLRE) are the strongest sectors in the market, when measured from mid February to early August. The PerfChart below shows XLE with a 12.63% gain, XLU with a 9.73% and XLRE with a 12.18%. These three sectors are even outperforming the Technology SPDR (XLK) during this timeframe.

The next performance picture looks a lot different when I change the timeframe to year-to-date. Notice that the Consumer Discretionary SPDR (XLY), XLK and Health Care SPDR (XLV) are leading in 2018. XLU and XLRE are still up this year, but up much less than the others.
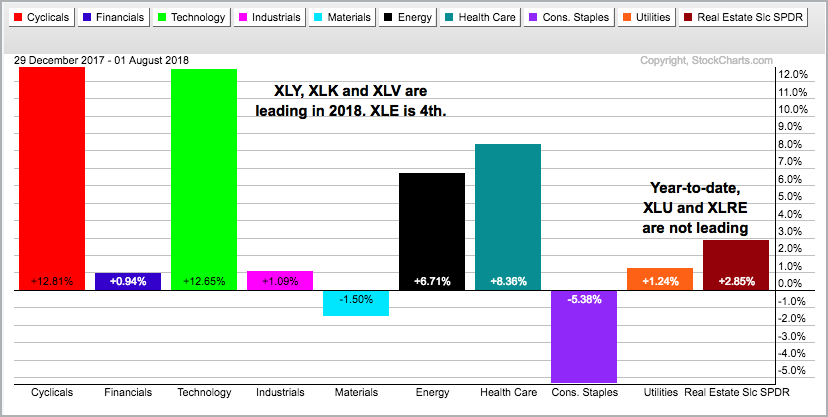
What are we to believe? Technical analysis is part objective and part subjective. We can often change the timeframe to suit our message. If you want to be bullish, simply pick the timeframe and indicators that line up bullish. If you want to be bearish, simply change the timeframe and indicators until they align negatively.
Personally, I think it is important to be consistent with our timeframes and indicator settings. Try too see what is really there on the chart, not what you want to see.
Regardless of the Performance differences, some of the best performing groups of the last few months weakened over the last two weeks and the broader market environment could be turning defensive. This means the broader market could be hitting a soft patch (correction). Corrections are normal after sizable gains and could provide us with next setups.
Aroons Signal Consolidation in XLU
The next chart shows the Utilities SPDR with the Aroon indicators, which were developed by one of our blog authors, Tushar Chande. The chart shows XLU moving above its April high and then consolidating with a small triangle. An upside breakout would be bullish and target a move towards the 2017 highs.
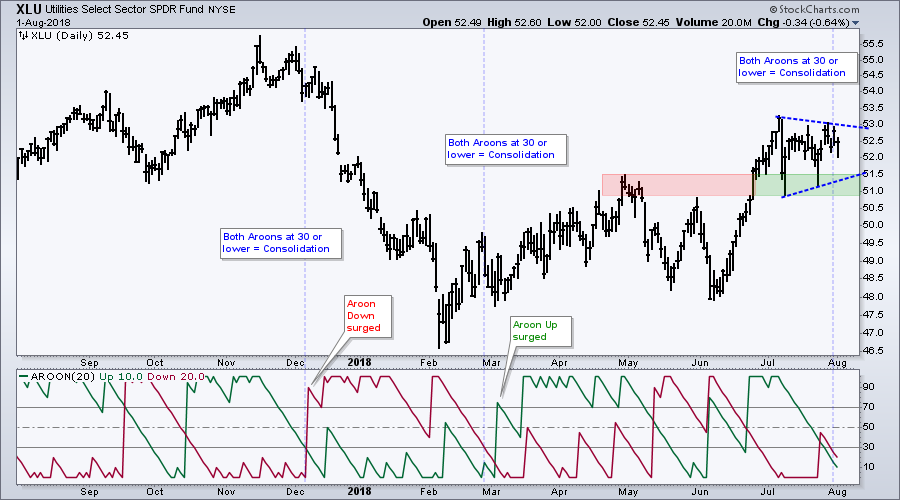
The indicator window shows both Aroons moving below 30. This occurs during a consolidation because it means there is little downside movement (Aroon Down) and little upside movement (Aroon Up). The first to break above 70 will trigger the next directional signal. For reference, the prior two signals are shown on the chart.
XLRE Breaks Out of Flag
The Real Estate SPDR (XLRE) surged and broke out of a bull flag over the last few days. The chart shows XLRE bottoming in early February and advancing over 15% from February to July. Wow. Keep in mind that this advance includes dividends because I am using dividend-adjusted data. Precede the symbol with an underscore to see unadjusted data (_XLRE).
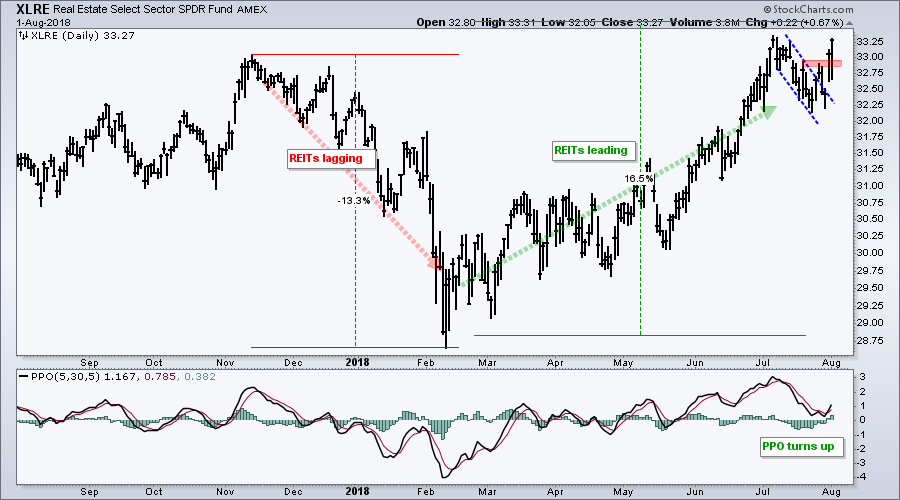
The flag breakout is bullish and signals a continuation of the bigger uptrend. The indicator window shows the PPO (5,30,5) moving below 1% and turning up over the last three days. This indicator moved above its signal line and this is a bullish momentum signal.
REITs, Utilities and the 10-year Correlation
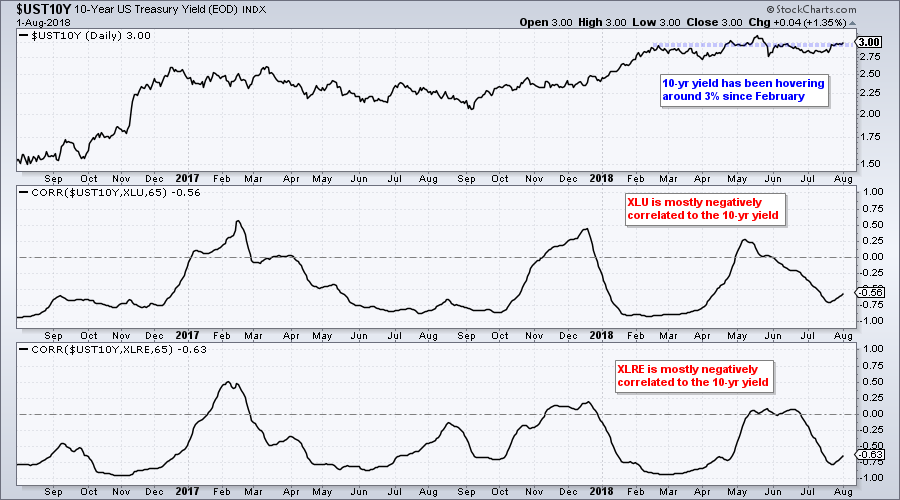
The next chart shows the 10-yr T-Yield ($UST10Y) and its correlation with the Utilities SPDR and Real Estate SPDR. This is a daily chart with 65-day Correlation Coefficients (~3 months). First, notice that the 10-yr yield has been flat since February, which is when XLU and XLRE bottomed. Second, notice that both are negatively correlated to the 10-yr yield, which means they tend to move in the opposite direction. Strength in the 10-yr yield, therefore, could be negative for XLU and XLRE. A decline in the 10-yr yield, on the other hand, could be positive.
HACK Becomes Oversold in an Uptrend
Several leading industry-group ETFs were hit hard over the last 1-2 weeks and some are near oversold levels (RSI(10) below 30). Here are the RSI levels for a few: SKYY (32.63), HACK (27.85) and FDN (34.2). SKYY and FDN hit new highs in July, while HACK hit a new high in June. The long-term trends are up and this means an RSI move below 30 would set up a mean-reversion trade. The chart below shows HACK falling to the top of a potential support zone and RSI moving below 30.
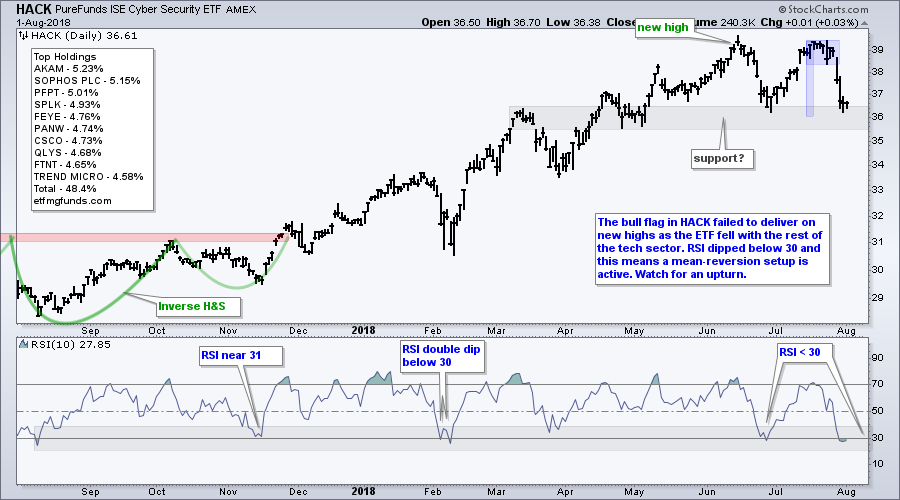
An RSI move back above 30 would trigger a short-term bullish signal. Such a signal, however, does not preclude HACK from moving lower. The market is looking a bit soft and the leaders are correcting. This means the market may need some time to settle before a decent mean-reversion bounce takes hold. This is purely a judgement call. Mean-reversion systems, which do not use judgement, would simply buy when RSI moves above 30, set a profit target and wait for a bounce, which may come in one week or one month. The key is to plan your trade and trade your plan. Get a strategy and apply it!
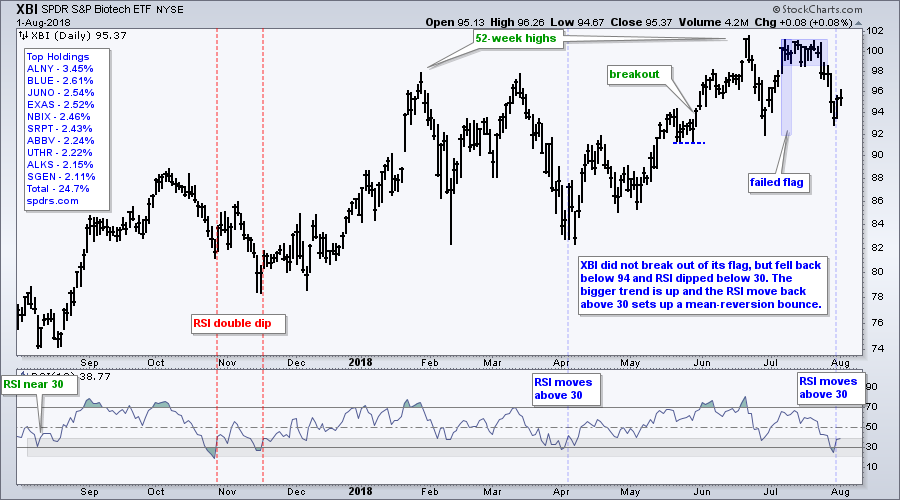
The Dreaded Double Dip in RSI
The next chart shows the Biotech SPDR (XBI) with RSI moving above 30. The long-term trend is up and this RSI move signals that a mean-reversion bounce could unfold. The April signal worked quite well as XBI bounced off support from the February low. The signal in late October, however, did not work so well as XBI moved lower into mid November. RSI did the double dip below 30 and the second signal turned out well. We never know how these signals will turn out, but a broad market correction or trading range over the next few weeks could produce the dreaded double dip.
On Trend on Youtube
Available to everyone On Trend with Arthur Hill airs Tuesdays at 10:30AM ET on StockCharts TV and repeats throughout the week at the same time. Each show is then archived on our Youtube channel.
Topics for Tuesday, July 30th:
- Customizing CandleGlance Lists.
- Revisiting XLF and the Big Banks.
- Charts: JPM, BAC, AXP, C, USB, GS
- XLV and Big Pharma Lead
- Charts: JNJ, PFE, MRK, LLY, GILD, AMGN, BMY, ABBV, UNH, REGN, ANTM
- Performance Disparities within SOXX..
- Stocks to Watch: ALL, AGN, DG, KSS, WMT.
- Click here to Watch
Plan Your Trade and Trade Your Plan.
- Arthur Hill, CMT
Senior Technical Analyst, StockCharts.com
Book: Define the Trend and Trade the Trend
Twitter: Follow @ArthurHill


