- Weekly Performance Review.
- Large-caps Show Leadership in July.
- New Highs Expand in S&P 500.
- Nasdaq 100 Still the Strongest.
- Internal Improvements in Industrials and Finance.
- XLF and XLI Challenge Spring Highs.
- TLT and IEF Fail at Resistance.
- This Week in Art's Charts.
- Notes from the Art's Charts ChartList.
 Large-caps Show Leadership in July
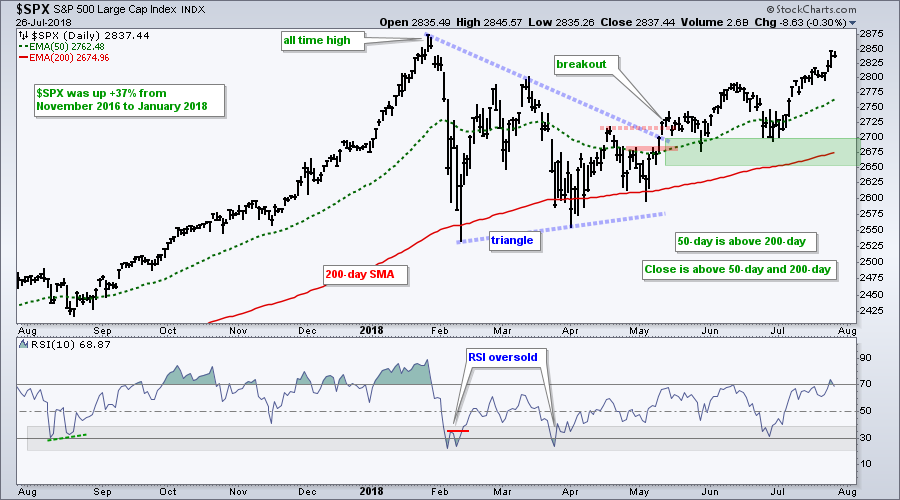
The changing of the guard continues in July with the S&P 500 SPDR (SPY) showing upside leadership this month. Month-to-date, SPY is up 4.45%, the S&P SmallCap iShares (IJR) is up 4.29%, the Russell 2000 iShares (IWM) is up 3.2% and the S&P MidCap SPDR (MDY) is up 2.37%. Small-caps are still leading year-to-date with IJR and IWM up double digits. SPY is up 7% year-to-date, which ain't too shabby.
Despite leading in July, the S&P 500 is still around 1.25% short of a 52-week high. The S&P SmallCap 600, S&P MidCap 400 and Nasdaq 100 hit new highs in June and July. I am not concerned by this "non-confirmation" because the bulk of the evidence is bullish for the S&P 500 and the broader market. The triangle breakout in May is the dominant chart signal, the 50-day EMA is above the 200-day EMA and prices are well above the rising 200-day EMA.
New Highs Expand in S&P 500
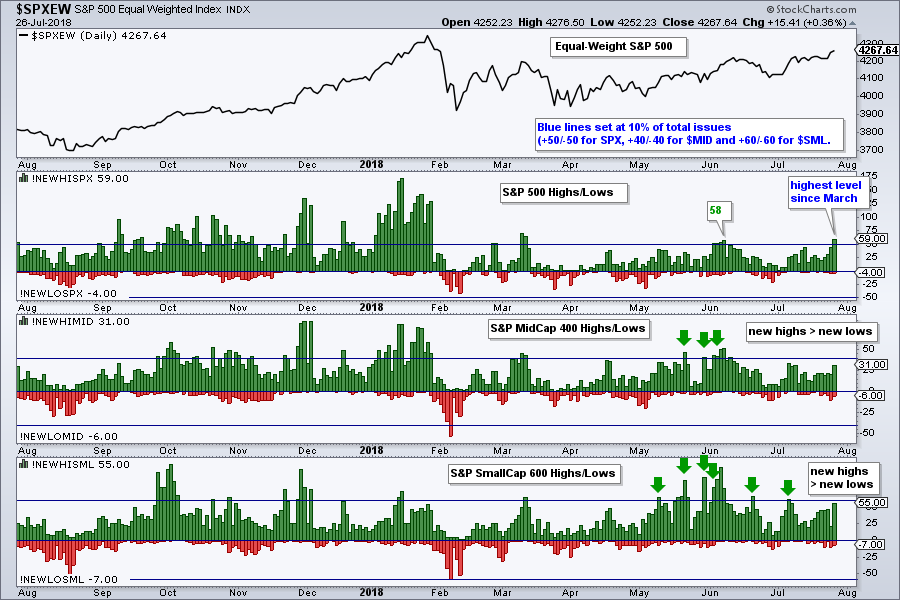
The next chart shows the high-low pairs for the S&P 500, S&P Mid-Cap 400 and S&P Small-Cap 600. First, notice that new highs exceeded the 10% threshold for $SPX, but did not for $SML and $MID. The 10% threshold is 50 for $SPX, 40 for MID and 60 for SML. As a percentage of total issues, new highs in $SPX are outpacing new highs in $MID and $SML. This shows more upside leadership (strong uptrends) within the S&P 500.
Nasdaq 100 Still the Strongest
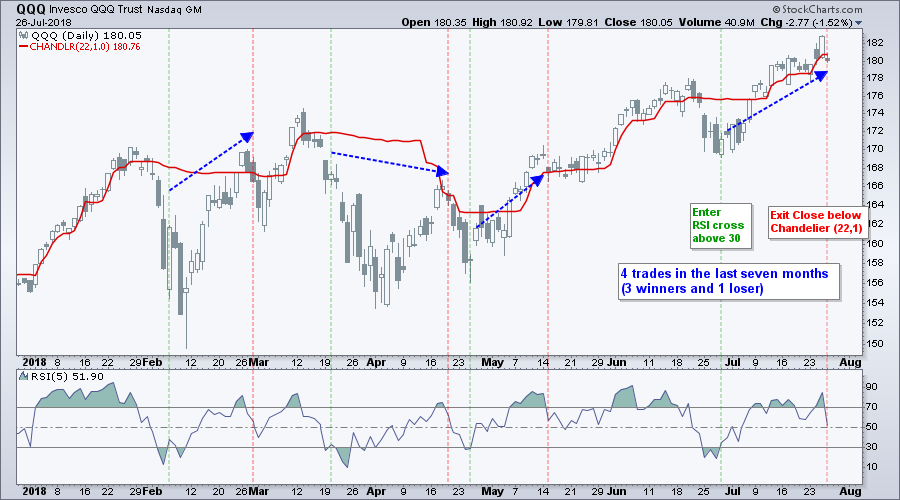
Facebook whiffed and QQQ fell around 1.5% on Thursday. This decline occurred after a 52-week high and is not enough to affect the long-term uptrend. Note that QQQ is still up 16% year-to-date and 4.89% in July, and leading the major index ETFs. Short-term, we could see some corrective action, but I do not see a long-term top or reasons to be overly concerned. A pullback and RSI dip below 30 would set up another mean-reversion opportunity. Note that QQQ closed below the Chandelier Exit (22,1) on Thursday. Thus, this ends the mean-reversion trade that was triggered in late June. Here is an article explaining the system in detail.
Internal Improvements in Industrials and Finance
The next chart shows the percentage of stocks above the 200-day EMA for the S&P 500 and the nine sector SPDRs with the sectors ranked by this value. Utilities, technology, energy and healthcare are at the top (~80% or greater). Note that S&P 500 %Above 200-day EMA (!GT200SPX) has been above 50% since November 2016 and Tech %Above 200-day EMA (!GT200XLK) has been above 60% since June 2016. How's that for a long trend?!
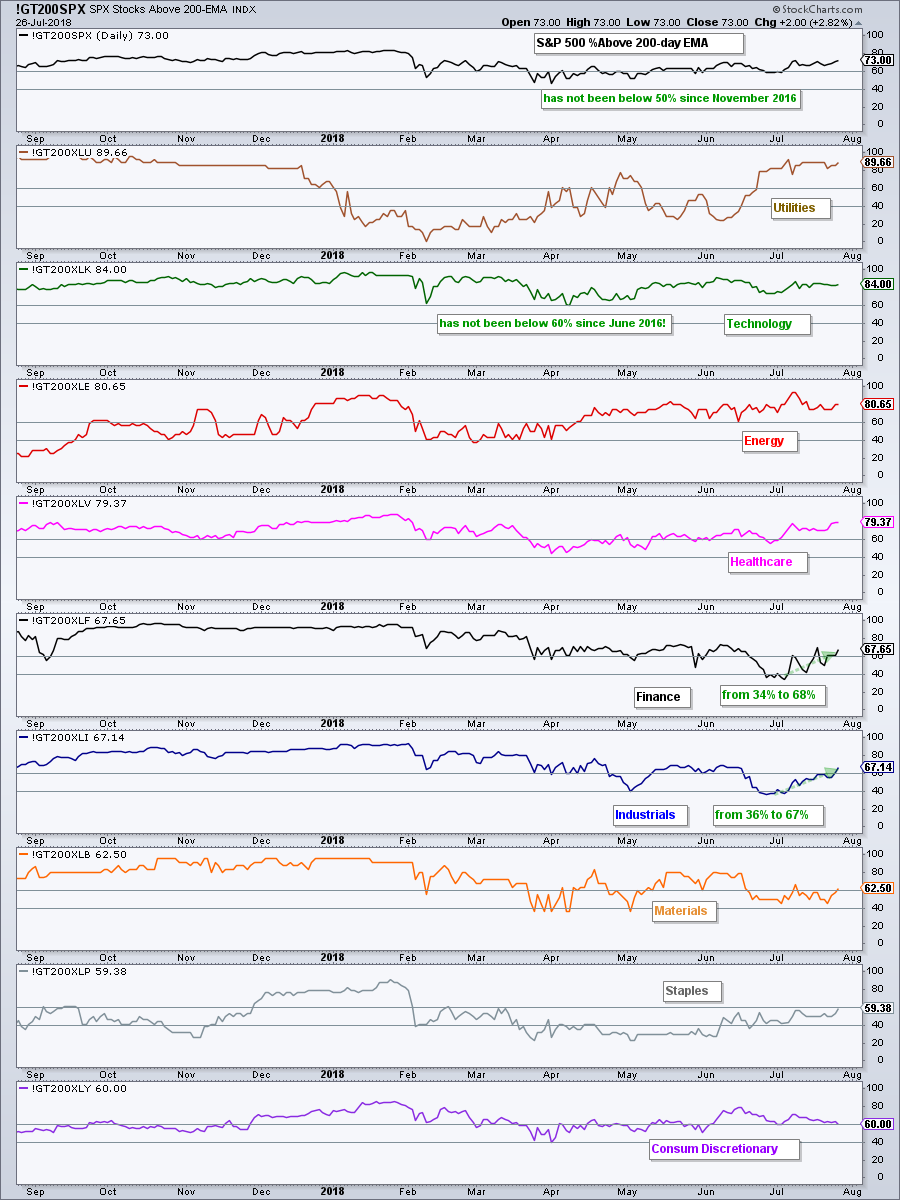
I am also impressed by the recent moves in the Finance %Above 200-day EMA (!GT200XLF) and the Industrials %Above 200-day EMA (!GT200XLI). Notice that both moved from around 35% to around 67% over the last few weeks. This brings them from bearish signals (<40%) to bullish signals (>60%). Using the 50% threshold results in too many whipsaws so I placed my bullish threshold at 60% and bearish threshold at 40%.
XLF and XLI Challenge Spring Highs
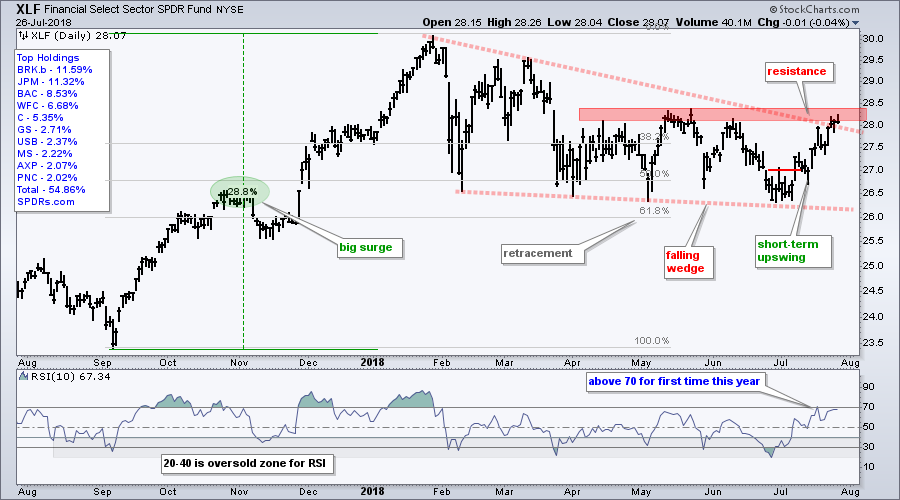
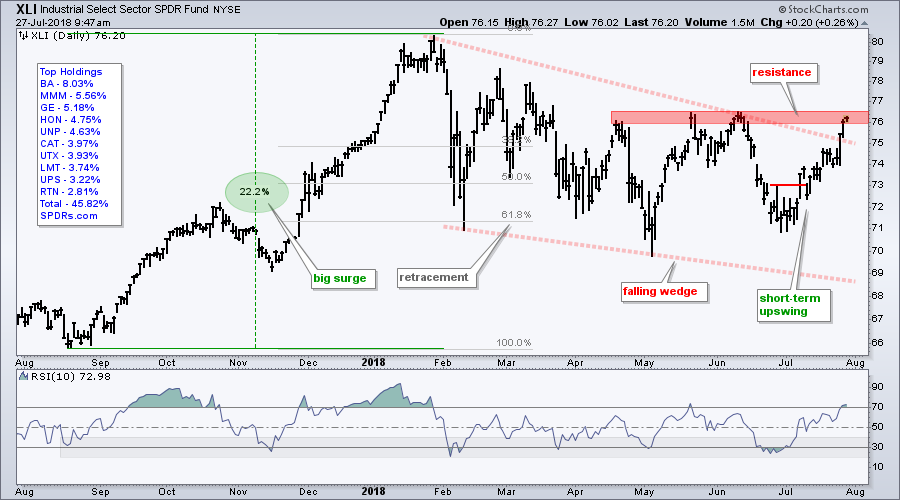
The Financials SPDR (+5.57%), the Industrials SPDR (6.10%) and Health Care SPDR (6.16%) are leading the sector SPDRs in July. The Technology SPDR (5.23%) is not far behind. Note that tech, healthcare and industrials are leading the new high list this week. These four sectors account for around 64% of the S&P 500 and this is more than enough to support a bull market.
The charts below show XLI an XLF surging to resistance from their spring highs. Both hit new highs in January, corrected with falling wedges and retraced around 61.8% of the advance from September to January. The wedge represents a big correction after a big advance and breakouts would signal an end to this corrective period. Finance and industrials were weighing on the market from January to June and are now leading, which is very positive.
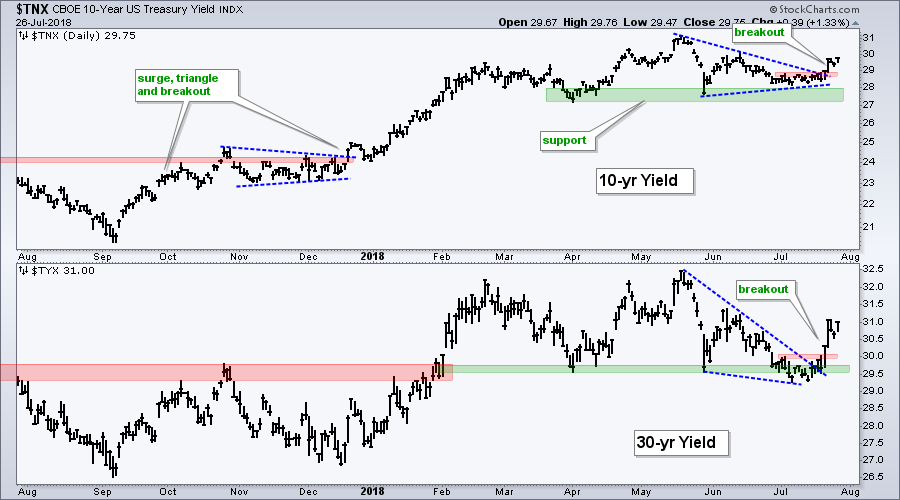
TLT and IEF Fail at Resistance
Last week I noted a bullish inverse head-and-shoulders in the 7-10 YR T-Bond ETF (IEF) and double bottom in the 20+ YR T-Bond ETF (TLT). Instead of breaking out and confirming these reversal patterns, bonds turned south and fell sharply the last five days. What went wrong?
As noted in Thursday's commentary, I think we need a process when analyzing charts. My process is to establish my trading bias first and then analyze based on this bias. The bigger trend on the chart is used to establish this bias.
Well.....I obviously deviated from my process last week. IEF and TLT were in long-term downtrends because both recorded 52-week lows in May. This means I should have had a bearish bias when looking at the charts. A bearish bias means I ignore bullish patterns and setups because I assume the bigger trend will ultimately prevail.
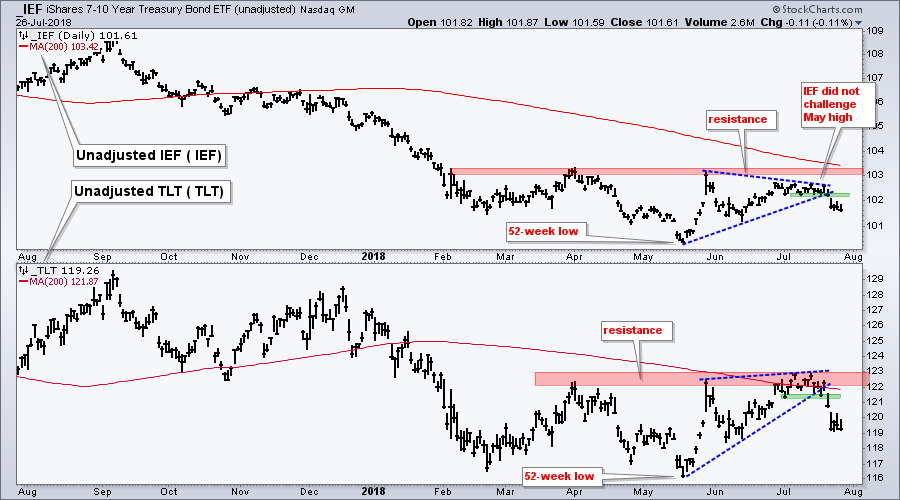
So with a little hindsight, I redrew the chart based on the bearish bias I should have had in the first place. IEF basically consolidated after the 52-week low in May and broke short-term support last Friday. TLT broke the March-May highs and 200-day SMA, but the hindsight pattern looks like a rising wedge and the ETF broke short-term support. These support breaks signal a continuation of the bigger downtrends and project new lows in the coming weeks or months. Such a move implies that yields will move higher. This could benefit banks, but could weigh on homebuilders and utilities.
Notes from the Art's Charts ChartList
- The Home Construction iShares (ITB) failed at resistance and recorded another lower low with a sharp decline. The ETF is down over 10% year-to-date.
- After hitting a 52-week high in June, the Retail SPDR (XRT) is consolidating with a triangle.
- The Semiconductor iShares (SOXX) surged on Thursday to extend its mean-reversion bounce.
- The Cloud Computing ETF (SKYY), Cyber Security ETF (HACK) and Software iShares (IGV) surged and formed bullish flags.
- The iShares Aerospace & Defense ETF (ITA) broke a triangle line and may be ending its long consolidation.
- The Coal ETF (KOL) sprang to life with a successful support test and resistance break.
- The Steel ETF (SLX) surged off support and the swing within the trading range is up.
- Click here for the Art's Charts ChartList
This Week in Art's Charts
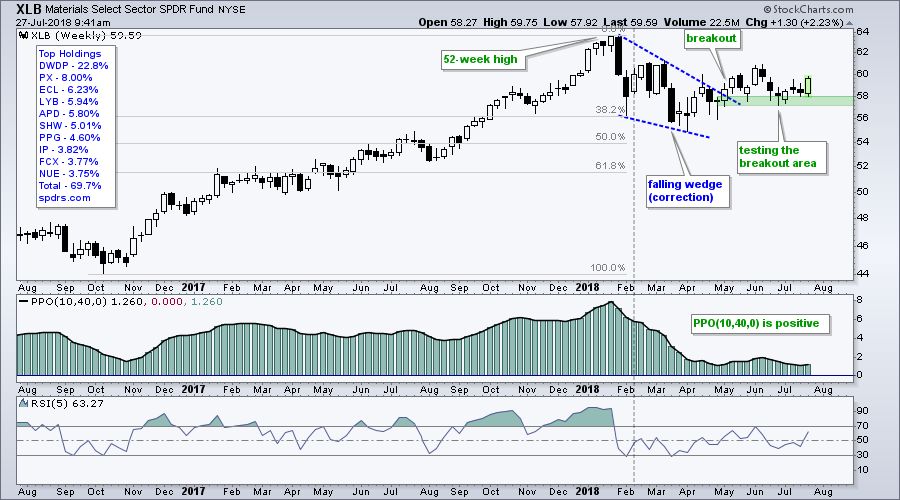
Thursday, July 26th: I had a rethink on the Materials SPDR (XLB), Metals & Mining SPDR (XME) and Steel ETF (SLX) by looking at some weekly charts, which are bullish. I also featured three US steel stocks and three international mining stocks.
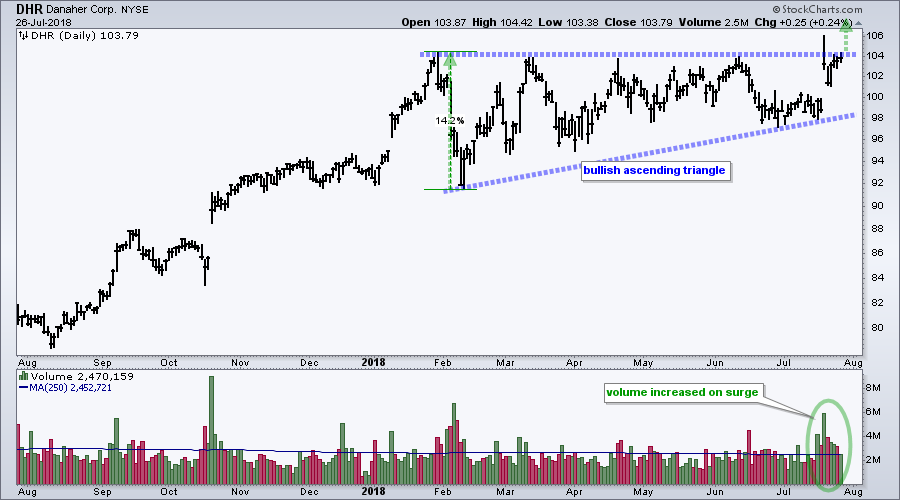
Danaher (DHI) was featured in DITC with a bullish ascending triangle on Wednesday and Honeywell (HON) was featured with a big wedge breakout on the weekly chart.
Tuesday, July 24th: On Trend (Youtube video) featured a segment on wedges, my own personal opinion. When should we ignore wedges and when should we pay attention? I also covered XLB, MOO, bull flags in some ETFs and six stock setups.
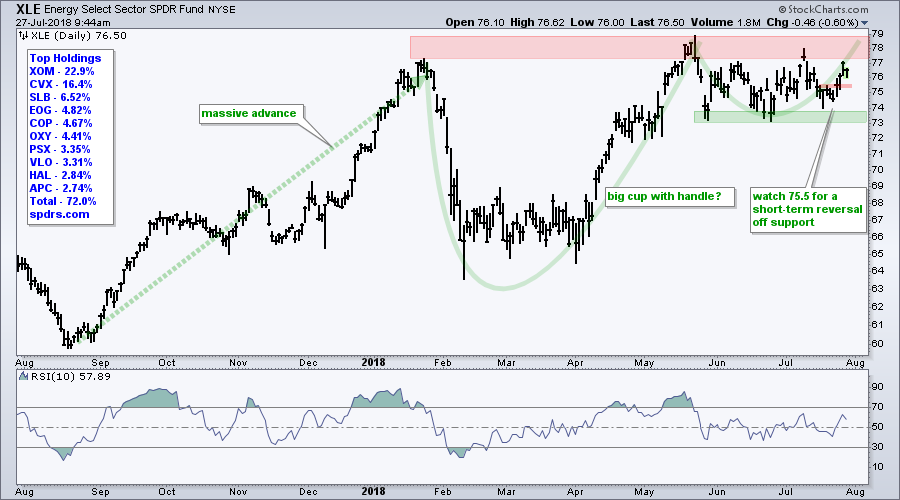
Monday, July 23rd: I focused on a mean-reversion opportunity in oil and showed the Light Crude futures contract. I also showed a bullish cup-with-handle in the Energy SPDR (XLE) and marked key support for the Oil & Gas Equip & Services SPDR (XES).
Questions, Comments or Feedback?
I cannot promise to response to all correspondence, but I will read it and take into under consideration. I greatly appreciate all feedback because it helps me improve the commentary and provides ideas for the future. Sorry, I do not take symbol requests.

Plan Your Trade and Trade Your Plan.
- Arthur Hill, CMT
Senior Technical Analyst, StockCharts.com
Book: Define the Trend and Trade the Trend
Twitter: Follow @ArthurHill


