- Weekly Performance Review.
- Changing of the Guard Continues
- S&P SmallCap iShares Outperforms Russell 2000 iShares
- S&P 500 is in a Bull Market
- High-Low Lines Continue to Rise
- QQQ Becomes Short-term Oversold
- IJR Consolidates Near Highs
- Measuring Trend Strength with Stochastics
- XLF and XLI Challenge Resistance
- This Week in Art's Charts (XES, BRK/B, HACK)
- Notes from the Art's Charts ChartList
 Changing of the Guard Continues
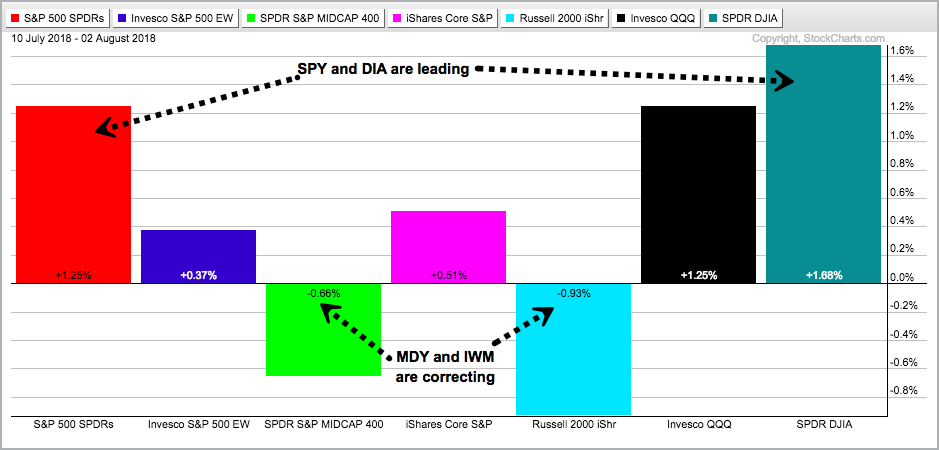
The stock market softened over the last four weeks, seventeen days to be exact, as small-caps, mid-caps, technology and consumer discretionary stalled. Why did I pick 17 days? Because this is when the S&P MidCap SPDR (MDY) and Russell 2000 iShares (IWM) started edging lower. I do mean edging because MDY is down just .66% since July 9th and IWM is down a staggering .93%. Large-caps held up quite well and continue to lead with SPY up 1.25% and DIA up 1.68% over the last 18 days.
S&P SmallCap iShares Outperforms Russell 2000 iShares
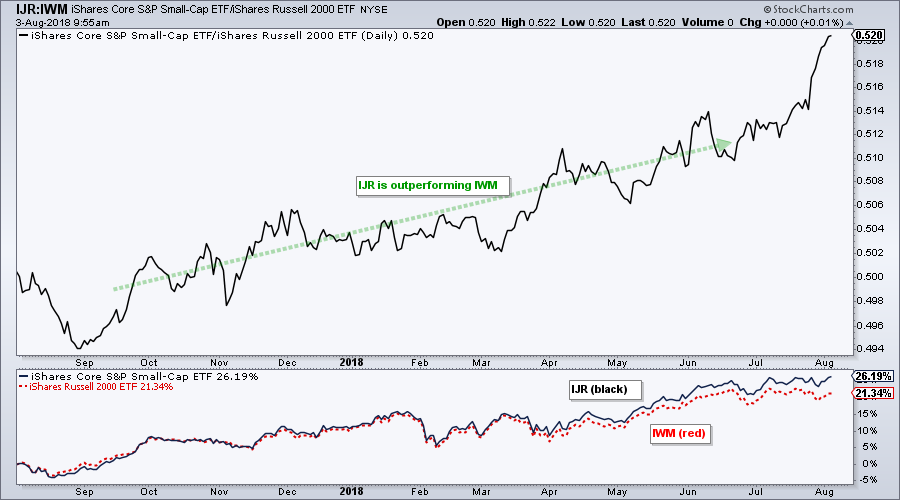
The S&P SmallCap iShares is outperforming the Russell 2000 iShares by a fairly wide margin over the last few weeks and over the past year. The chart below shows the price relative (IJR:IWM) ratio rising from late August 2017 to early August 2018. The bottom window shows IJR with a 25.51% gain over the past year and IWM with a 20.52% gain. IJR has clearly been the better choice when it comes to small-caps.
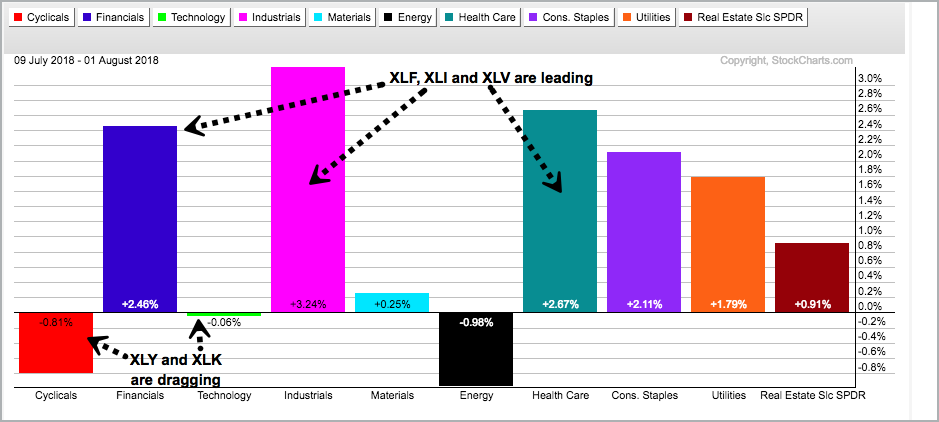
The sector SPDRs tell a rotation story with the Consumer Discretionary SPDR (XLY) falling .81% during this period and the Technology SPDR (XLK) down a fraction (.06%). In contrast, we are still seeing new leadership in the Financials SPDR (+2.46%), Industrials SPDR (+3.24%) and Health Care SPDR (+2.67%). This new leadership is not exactly new because it has been happening since early July. It is positive to see these three sectors pick up the slack. XLK and XLY led for a long time and both are ripe for either a slower advance or a correction of some sort.
Regional Banks Hold Up and Defense Leads
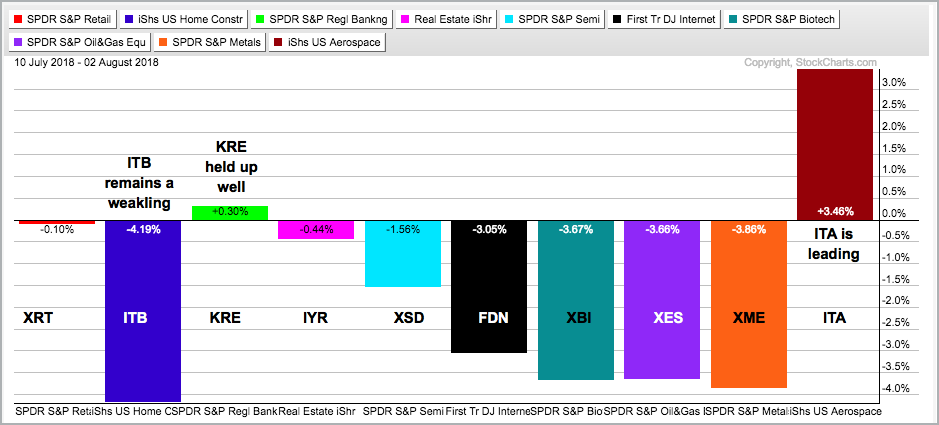
The next image is a PerfChart with 10 industry group ETFs over the last 17 days. Four groups stand out. First, the Regional Bank SPDR (KRE) held up pretty well and showed some relative strength. Second, the iShares Aerospace & Defense ETF (ITA) led with a 3.46% gain and this group is helping out the industrials sector. Third, the Home Construction iShares (ITB) has been one of the weakest groups this year and remains one of the weakest. And finally, the Metals & Mining SPDR (XME) gave up its prior gains and led the way lower.
S&P 500 is in a Bull Market
The song remains the same for the S&P 500: we are in a bull market. The index fell a whopping 1.53% over a three-day period towards the end of July (sarcasm alert). Keep in mind that this drastic pullback occurred after a 5% advance from June 27th to July 25th. This is hardly the stuff of bear markets or market tops.
Keep your eye on the structure of the move. First, the index surged 37% from November 2016 to January 2018. Second, a large triangle consolidation formed as the index digested this big advance (correction). Third, the index broke out in May. Fourth, the index forged higher highs and higher lows in June and July. Fifth, the 50-day EMA is above the 200-day EMA and the close is well above the rising 200-day EMA. Everything on this chart is bullish.
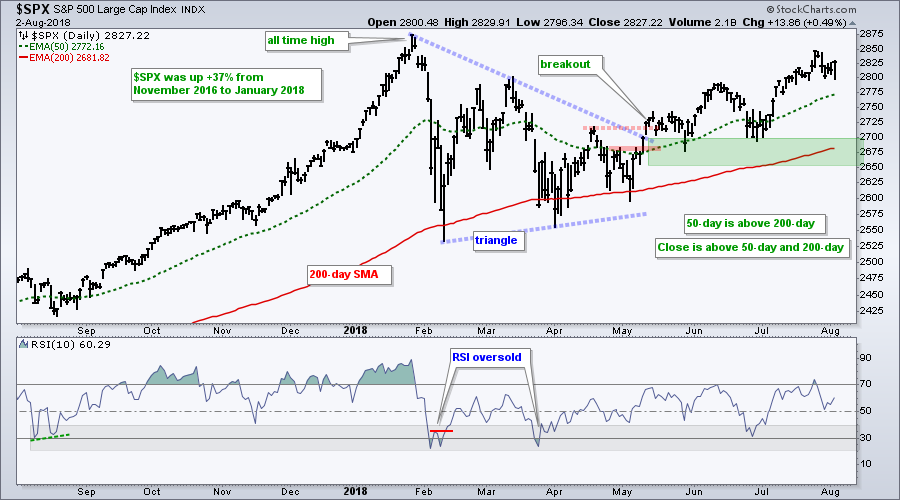
Note that I am NOT marking resistance at the January high. Why? Because the big trend is up and a trend in motion stays in motion. This implies that the trend will carry the index above the January high and a new high is expected. We should not call this a "break out" because the real breakout occurred in May when the index actually broke free of its triangle consolidation.
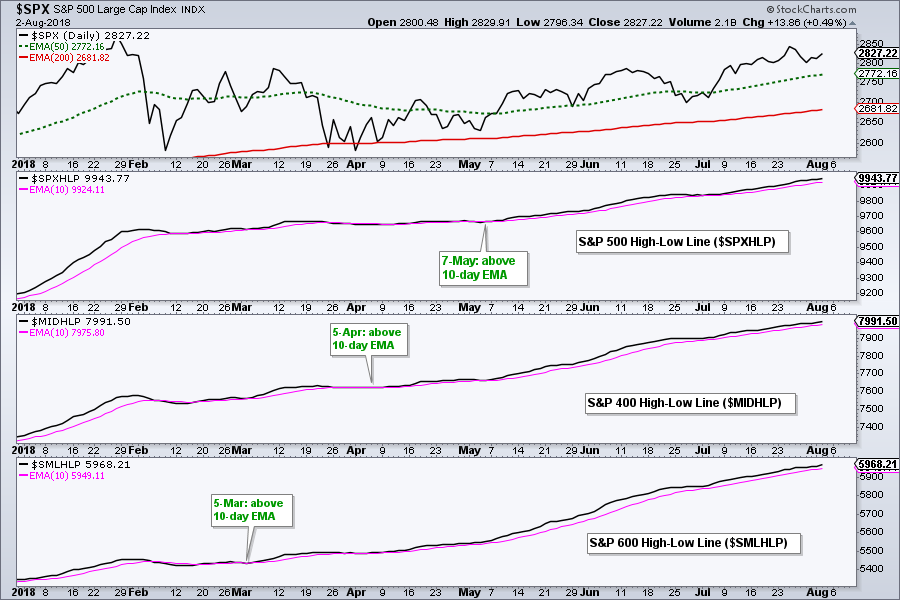
High-Low Lines Continue to Rise
The next chart shows the High-Low Lines for the S&P 500, S&P Mid-Cap 400 and S&P Small-Cap 600. All three are rising and above their 10-day EMAs. Small-caps were first as the High-Low Line turned up on March 5th, mid-caps followed with an upturn on April 5th and large-caps completed the hat-trick with an upturn on May 7th. I would not become concerned with a correction until two of the three move below their 10-day EMAs.
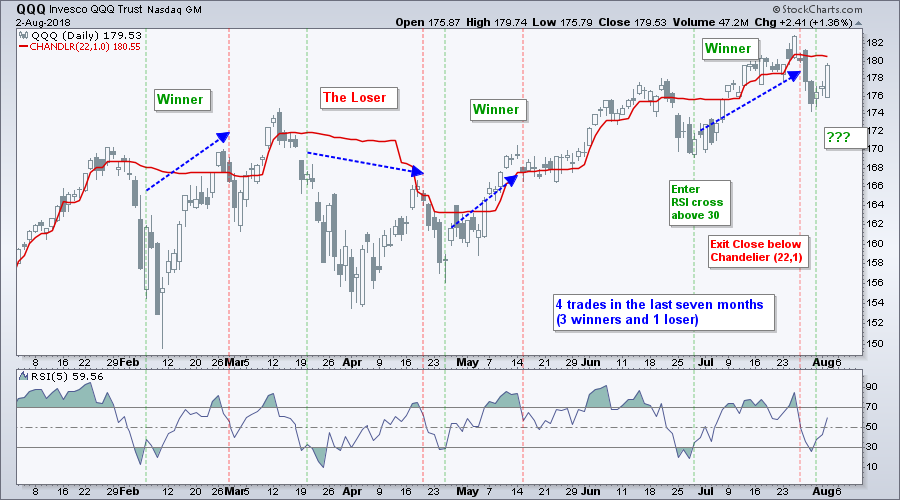
QQQ Becomes Short-term Oversold
The next chart shows QQQ hitting a new high in late July and falling below 176 with a sharp three day decline. This move pushed RSI(5) below 30 for an oversold reading, which is the fifth of the year (not counting multiple dips after the mid March dip). The green vertical lines show when RSI moved a back above 30 for a mean-reversion signal. You can read more about this system in this System Trader article.
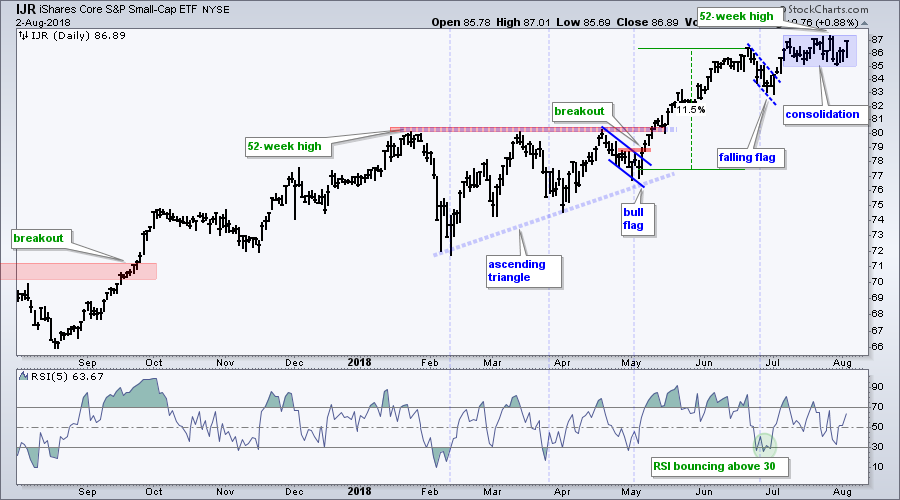
IJR Consolidates Near Highs
The next chart shows the S&P SmallCap iShares (IJR) hitting new highs in late July, but largely consolidating the last four weeks. There is no question that the big trend is up. The last pullback was the falling flag at the end of June, which formed after an 11.5% advance. It may seem abnormal for a consolidation so soon after the flag breakout, but this does not make it bearish. A consolidation simply reflects a stalemate between buying pressure and selling pressure. The big trend is up and this favors further gains at some point. I would not even consider a break below the consolidation lows as negative because a dip would set up the next mean-reversion trade.
Measuring Trend Strength with Stochastics
The next chart shows the Full Stochastics (148,1,1) for SPY and the nine sector SPDRs. I chose 148 days because this covers 2018. A 148 day Stochastic tells us where the current price is relative to the high-low range this year. Values above 80 indicate that prices are at the high end of this range and reflect a strong uptrend. Values below 20 indicate that prices are at the low end and the trend is down. Values near 50 indicate that prices are in the middle of this year's range. The values are highlighted on the left side of the chart and the table is sorted with the highest values at the top.
First and foremost, the Stochastic Oscillator for SPY is above 90 and the highest since January. This confirms the current uptrend in SPY and shows that it is near its highest level of the year. Second, the Utilities SPDR, Consumer Discretionary SPDR, Technology SPDR and Health Care SPDR are leading with values above 85 (green highlights). Notice that Healthcare made a big move the last five weeks. Third, the Energy SPDR is in fifth place with a value of 78.76 and the indicator has held above 50 since mid April. These five sectors account for 60% of the market and this is enough to power the S&P 500.
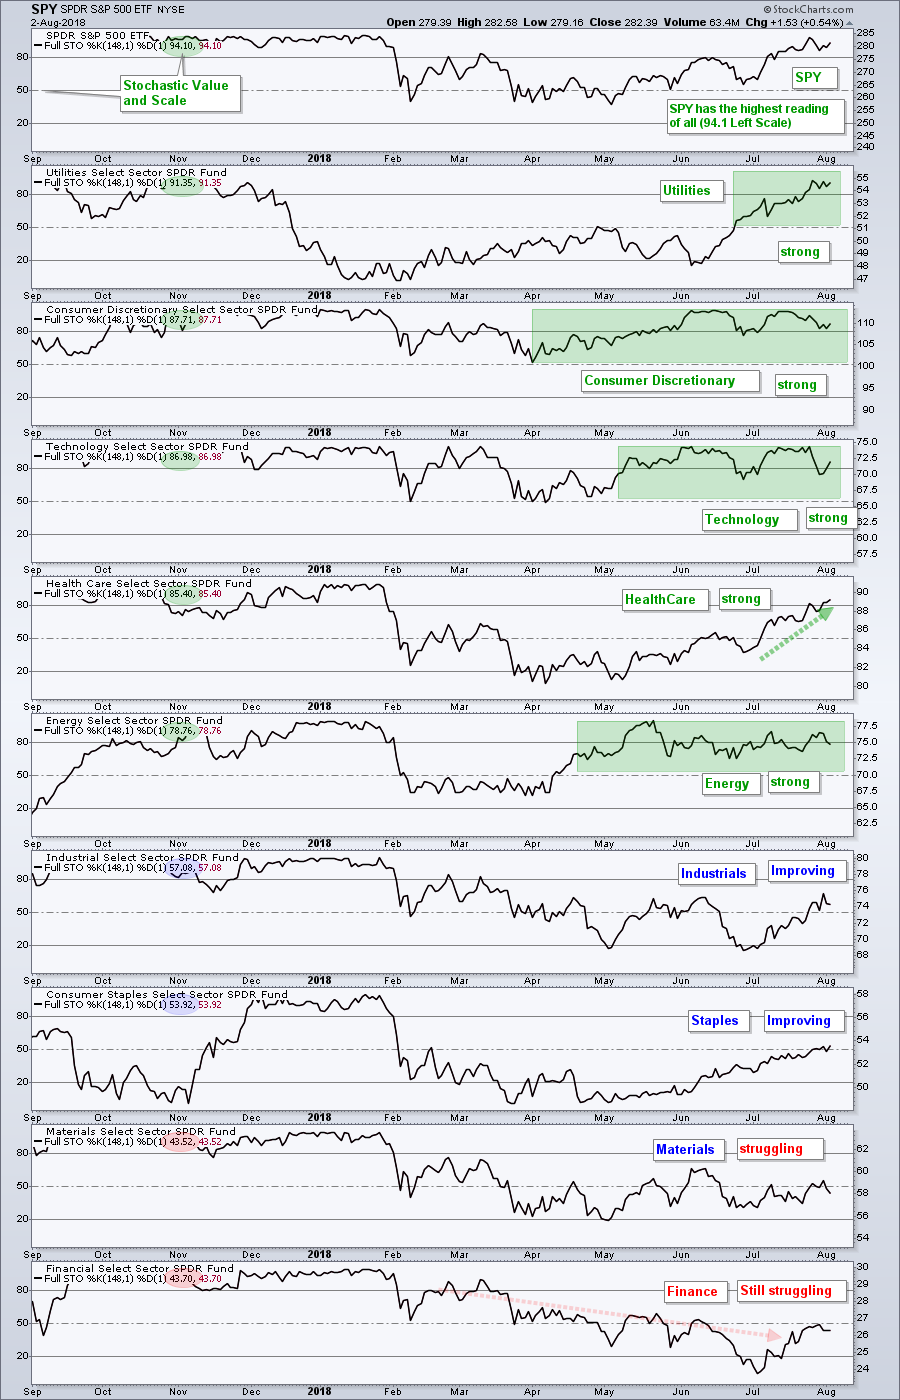
The Industrials SPDR (XLI) and Consumer Staples SPDR (XLP) are improving as their Stochastic Oscillators cross above 50. They are not quite out of the woods though. The Materials SPDR (XLB) and Financials SPDR (XLF) are struggling and below 50. This means they are in the bottom half of their 2018 price range. As the rankings reflect, these four sector show the weakest trends in 2018.
XLF and XLI Challenge Resistance
The next chart shows the Financials SPDR (XLF) with the Fibonacci Retracements Tool covering the 2018 price range. Notice that XLF is just below the 50% line, which indicates that it is in the lower half of its 2018 range. As noted above, the 148 day Stochastic is at 43.7 and confirms.
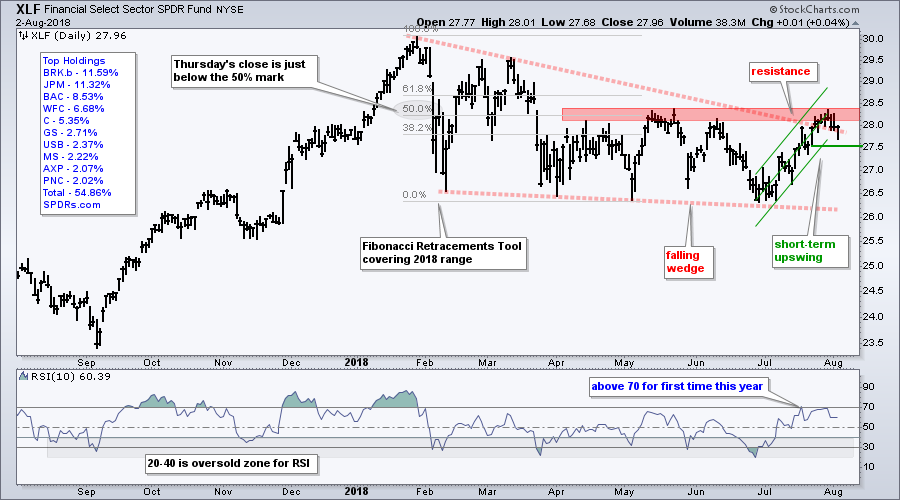
XLF is challenging resistance from the May highs after a strong bounce the last five weeks. A close above 28 would break resistance and propel XLF into the upper half of this year's range. The Raff Regression Channel marks the five week upswing with support set at 27.5. A close below this level would reverse the short-term upswing.
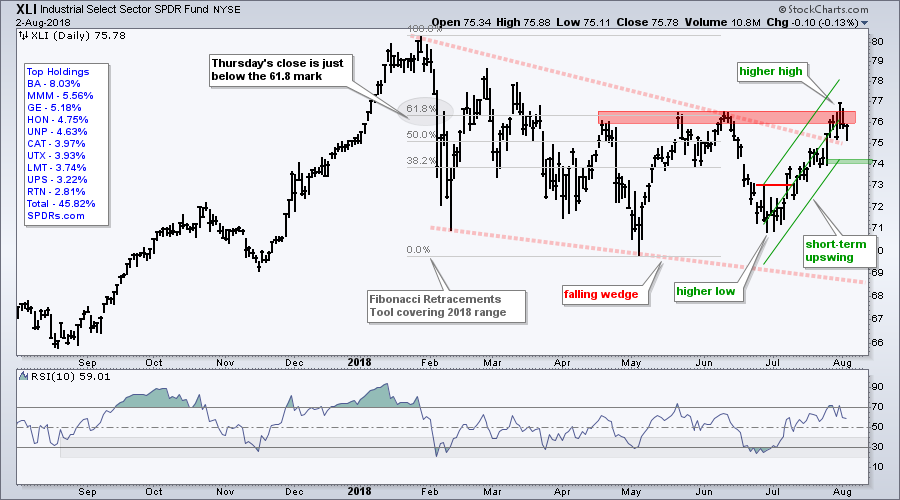
The next chart shows XLI breaking the wedge line in late July and actually exceeding the May-June highs for one day. The five week surge off the 71 area was quite strong as XLI led the market during this period. I think this chart is more bullish than bearish because of the higher high and strong surge. The green Raff Regression Channel defines the five week upswing with support marked a 74. A close below this level would call for a re-evaluation.
Notes from the Art's Charts ChartList
- The Home Construction iShares (ITB) is still one of the weakest industry group ETFs as it trades near its lows for 2018.
- The Cloud Computing ETF (SKYY) and Internet ETF (FDN) fell sharply and RSI moved into the low 30s. These two are in long-term uptrends and getting short-term oversold.
- The Cyber Security ETF (HACK) became short-term oversold this week and could be ripe for a bounce off the top of its support zone.
- The Semiconductor iShares (SOXX) held up well the last six days and remains within an upswing since early July.
- The Broker-Dealer iShares (IAI) reversed its three week upswing with a reversal this week. Overall, a lower high formed in June and this ETF is underperforming in 2018.
- The Regional Bank SPDR (KRE) is trying to keep its mean-reversion bounce alive.
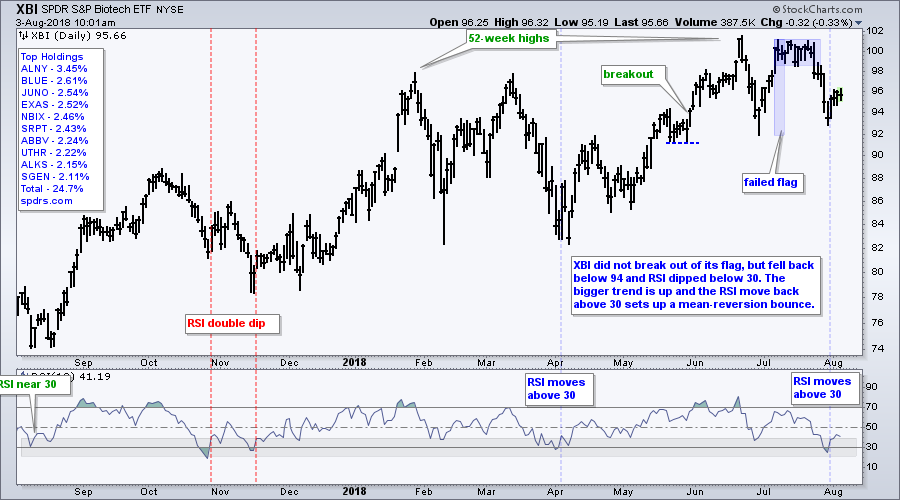
- The Biotech SPDR (XBI) became short-term oversold this week as RSI moved below 30 (and the long-term trend is up).
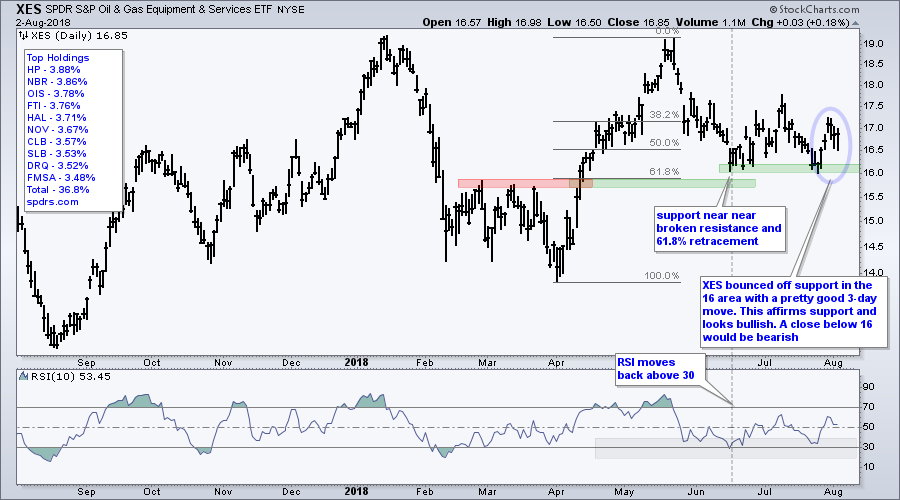
- Oil fell sharply on Tuesday-Wednesday, but XES held up pretty well and continues to bounce off support.
- The Metals & Mining SPDR (XME) and Steel ETF (SLX) fell sharply the last few days and these two groups are not showing enough leadership to warrant attention on the long side.
- Click here for the Art's Charts ChartList
This Week in Art's Charts
Thursday, August 2nd: RIET and Utility SPDRs form bullish continuation patterns. Watch the 10-year yield for clues on these two. The Cyber Security ETF (HACK) and Biotech SPDR (XBI) became short-term oversold as RSI(10) dipped below 30, but be careful of the dreaded double dip.
US Bancorp (USB) was featured in DITC as it broke above resistance and Waters Corporation (WAT) was highlighted with a large falling wedge. USB is one to watch for a throwback to the breakout zone, while WAT is one to watch for an upside breakout in the coming weeks, perhaps months.
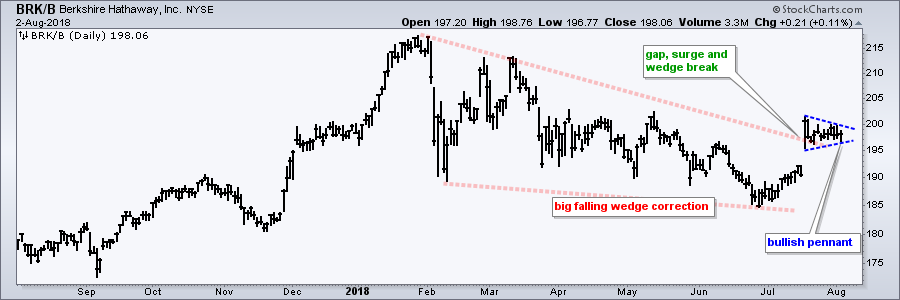
Tuesday, July 31st: On Trend on Youtube started with a segment on customizing CandleGlance charts I then covered XLF and some big banks, XLV and big pharma leadership, the disparities within the semiconductors group and some stocks to watch: ALL, AGN, DG, KSS, WMT. Berkshire was not covered, but the chart below shows a bullish pennant forming after the gap.
 Monday, July 30th: I focused on the bounce in oil, the cup-with-handle in Energy SPDR (XLE) and the bounce off support in the Oil & Gas Equip & Services SPDR (XES). Oil and XLE fell back, but XES held up quite well and showed some resilience.
Questions, Comments or Feedback?
I cannot promise to response to all correspondence, but I will read it and take into under consideration. I greatly appreciate all feedback because it helps me improve the commentary and provides ideas for the future. Sorry, I do not take symbol requests.

Plan Your Trade and Trade Your Plan.
- Arthur Hill, CMT
Senior Technical Analyst, StockCharts.com
Book: Define the Trend and Trade the Trend
Twitter: Follow @ArthurHill


