- Broadest Decline Since April.
- 16 Stocks Bucked the Selling Pressure.
- Scan Code for Advancing Issues.
- The Russell 2000 and Moving Averages.
- A Shift from Growth to Value?
 ... A Lopsided Move
... Chartists can measure participation using the AD Percent indicators. AD Percent equals the number of advances less the number of declines divided by the total number of issues. In the S&P 500 on Tuesday, there were 16 advancing stocks and 484 declining stocks for -468 Net Advances. AD Percent is Net Advances divided by total issues (-468/500 = -93.6%), and this is a very lopsided number.
Chartists can use AD Percent to compare participation levels among the indexes and compare current values against past values. The chart below shows AD Percent for the S&P 1500, S&P 500, S&P Mid-Cap 400 and S&P Small-Cap 600. The horizontal lines are set at +70% and -70%. A move above +70% shows strong upside participation, while a move below -70% shows strong downside participation. In S&P 500 terms, a move above +70% means more than 425 stocks advanced, while a move below -70% means more than 425 stocks declined.
The green vertical lines show when S&P 1500 AD Percent ($SUPADP) exceeded +70% and the red lines show when this indicator exceeded -70%. Notice that the indicator exceeded +70% four times in April and May, and reached 69.5% once in July and once in August. The green outline shows that the indicator did not dip below -70% once from April 10th until October 9th. This changed on October 11th as S&P 1500 AD Percent dipped to -87.50% and this shows the broadest selling pressure in six months.
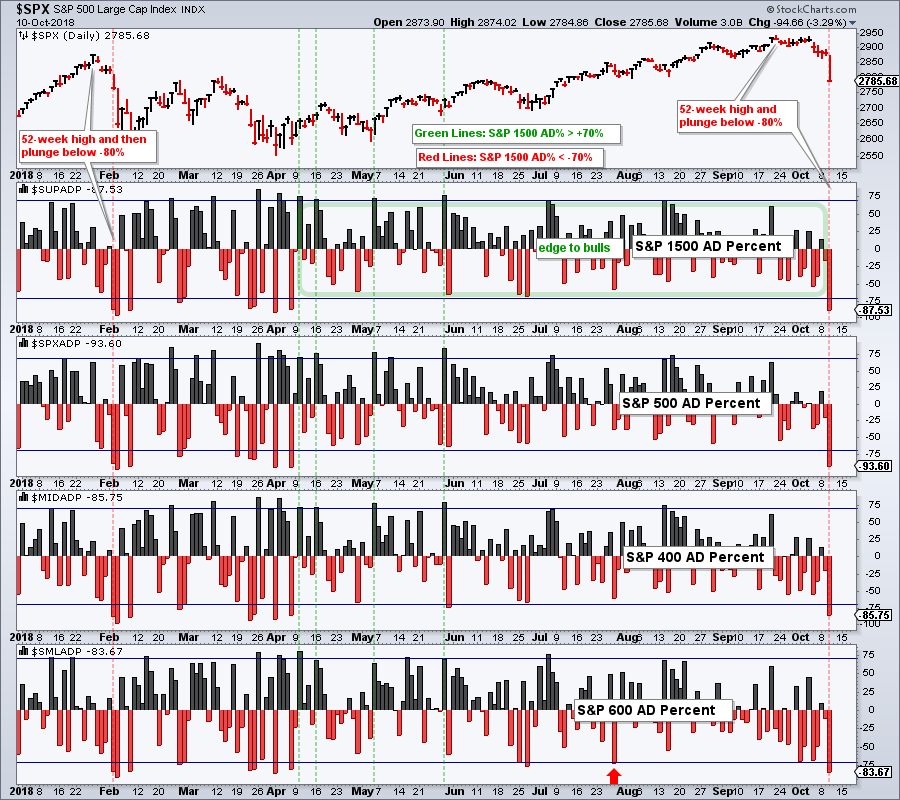 The lower windows break down S&P 1500 AD Percent into the S&P 500, S&P Mid-Cap 400 and S&P Small-Cap 600. Notice that downside participation was the greatest in the S&P 500 (-93.60% vs -85.75% and -83.67%). This is not much consolation because downside participation was the broadest since April for all three indexes.
The breadth indicators highlighted on Monday in Art's Charts have yet to trigger bearish signals, but I am concerned with the broadness of Tuesday's decline. Notice that the S&P 500 hit a new high in late January and AD Percent experienced a similar plunge five days later. Stocks declined another week and remained choppy the next three months.
The S&P 500 is also coming off of a new high recently and such broad selling pressure signals that something is amiss. At the very least, the bulls have been hit with a hard right hook by the bears. This is a destabilizing force and it may take some time for the bulls to find their footing again, similar to the February-April period.
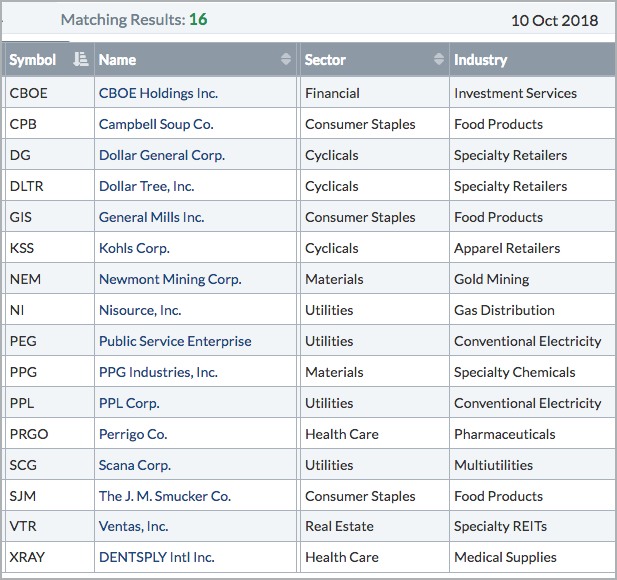
16 Stocks Buck the Selling Pressure
I ran a scan to find out which stocks in the S&P 500 were cheeky enough to advance in the face of broad selling. The table is shown below. Of note, the home of the S&P 500 Volatility Index ($VIX), CBOE, made the list. Perhaps the CBOE is benefitting from renewed attention in its hallmark index. PEG and PPL gained and even recorded new 52-week highs on Wednesday. XRAY hit a new 52-week low intraday and then recovered to close with a modest gain. Sorry XRAY, the 52-week low outweighs the modest advance.
Scan Code
Chartists can easily use our scan engine to find out which stocks advanced on Wednesday. The code below uses the S&P 500 [group is SP500], but can be changed to the S&P Small-Cap 600 [group is SP600], S&P Mid-Cap 400 [group is SP400] or Nasdaq 100 [group is NASDAQ 100].
[group is SP500]
and [ROC(1) > 0]
rank by ROC(1)
The Russell 2000 and Moving Averages
Katie Stockton of Fairlead Strategies made some interesting comments on moving averages and the Russell 2000. To quote: "We have to look at them (moving averages) as cushions, not precise points". She also points out how the Russell 2000 bottomed soon after piercing its 200-day SMA in the recent past.
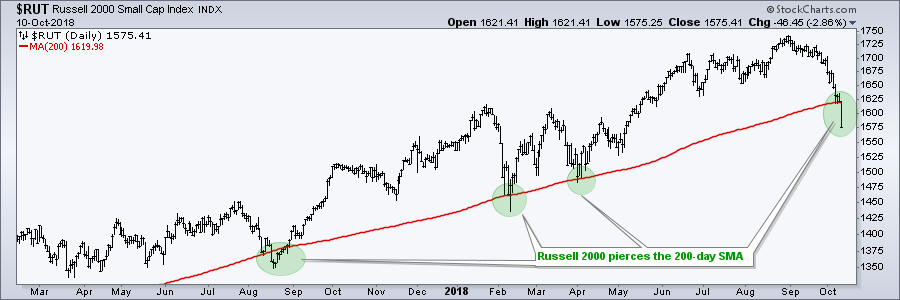
Art's Take: I use moving averages two ways. First, I will use a long moving average pair to gauge the long-term trend. For example, the long-term trend is up when the 50-day EMA is above the 200-day EMA. I also use a 25-day EMA (one month) and 125-day EMA (six months). Second, I use moving averages to compare performance. The Russell 2000 is below its 200-day SMA, but the S&P 500 is above. This suggests that the S&P 500 has a stronger chart.
A Shift from Growth to Value?
Tom Lee of Fundstrat thinks this is a correction within a bigger uptrend and he even expects the FANG stocks to rebound in the next two months. However, he sees a shift from growth to value in 2019 because of rising Treasury yields.
Art's Take: The chart below shows three ratio plots: the S&P 500 Value ETF relative to the S&P 500 Growth ETF (IVE:IVW), the S&P 500 High Beta ETF (SPHB) relative to the S&P 500 Low Volatility ETF (SPLV) and the S&P 500 High Beta ETF (SPHB) relative to the S&P 500 High Quality ETF (SPHQ).
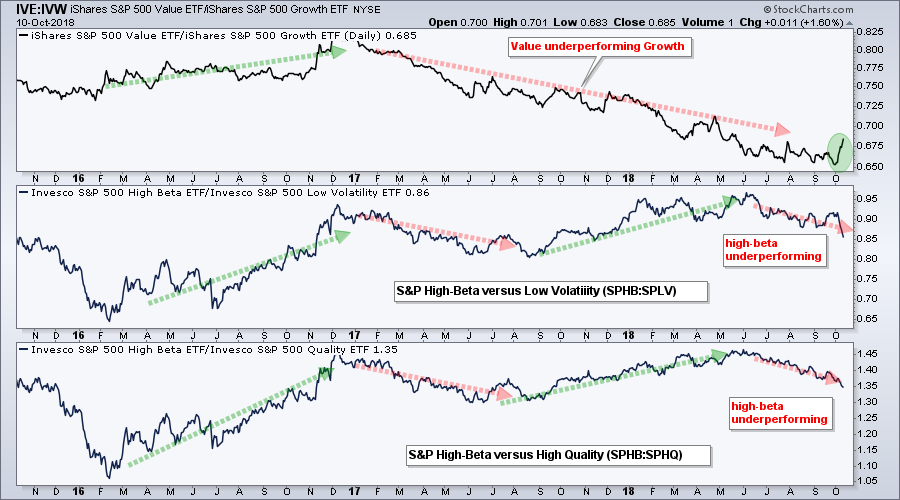
Value has been underperforming growth since January 2016. The IVE:IVW ratio surged in October as value outperformed growth this month. Don’t take this as absolute strength because both are down this month. IVE (value) is just down less than IVW (growth).
The lower two windows show the S&P 500 High Beta ETF underperforming the S&P 500 Low Volatility ETF and the S&P 500 High Quality ETF since June. This is like a risk on/off measure for stocks. The stock market is risk-on when high beta stocks are outperforming and risk-off when high beta stocks are underperforming. Looks like we are in risk-off mode right now.
Questions, Comments or Feedback?
I cannot promise to response to all correspondence, but I will read it and take into under consideration. I greatly appreciate all feedback because it helps me improve the commentary and provides ideas for the future. Sorry, I do not take symbol requests.

Plan Your Trade and Trade Your Plan.
- Arthur Hill, CMT
Senior Technical Analyst, StockCharts.com
Book: Define the Trend and Trade the Trend
Twitter: Follow @ArthurHill
