- XLF at Moment of Truth
- Three Stocks and a Third of XLF
- August-September Leaders are Oversold
- Understanding the Chandelier Exit
- SPY and QQQ Join Oversold Parade
- 9 Oversold Setups and 1 Example
- Stocks to Watch: HOLX, VRSK, AMJ, WMT
 ... The Financials SPDR (XLF) seems like a dangerous sector to be talking about now. Earnings season is underway and a whole slew of banks will be reporting in the next few days and weeks. I have no idea how earnings season will unfold for the big banks and the charts send a mixed message, surprise surprise.
The XLF message is mixed because the ETF is underperforming over the last nine months, but showing some strength over the last three months. XLF is around 6% below its January high and 7% above its late June low. The trend from January to June was down, but the trend from July to October appears to be up.
On the chart below, we can see XLF breaking out of a falling wedge and exceeding the May highs over the last few weeks. We can also see RSI moving above 70 three times and not dipping below 30. The ETF surged off support last week with a three day move and then edged lower the last three days. This three day pullback could be a bull flag and a breakout at 28.25 would be bullish.
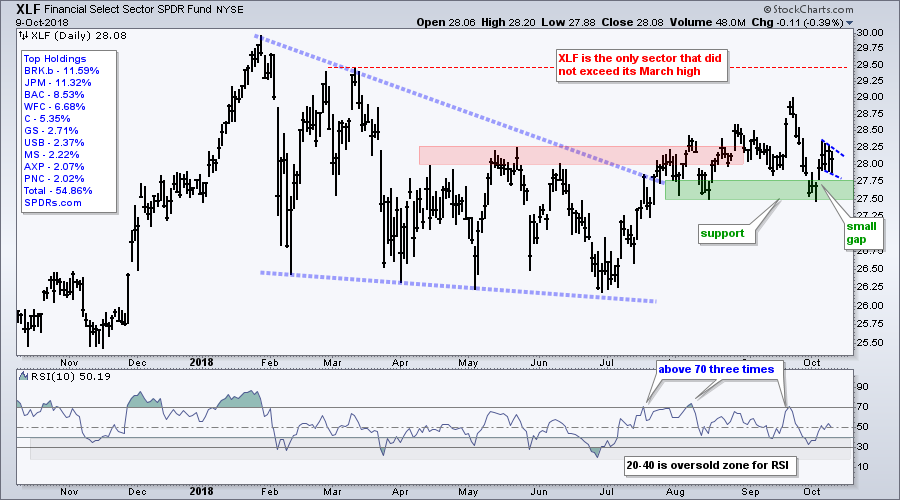
XLF is at a moment-of-truth because support is close at hand. A close below last week's low would break support and put XLF back in the bearish camp.
Three Stocks and a Third of XLF
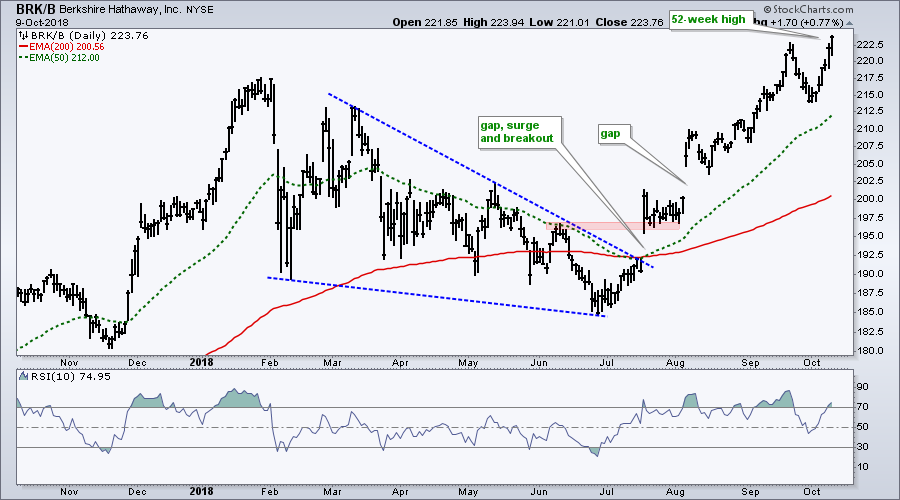
The top three stocks in XLF account for a third of the sector. Berkshire Hathaway (BRK.B), which accounts for 13.1% of the ETF, is not a bank or a pure insurance play. Nevertheless, the stock hit a 52-week high this week and is leading the sector. Berkshire reports on November 2nd.
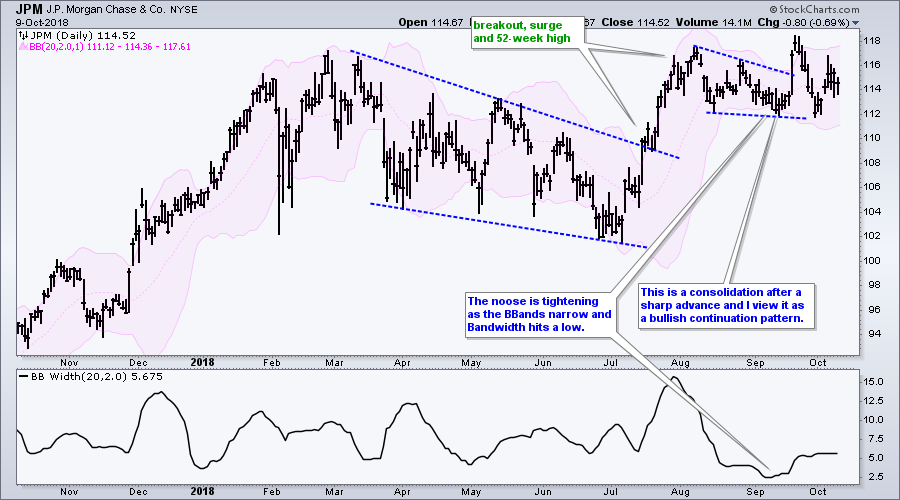
JP Morgan (JPM) is the second largest holding (11.5%) and this stock is one of the stronger banks. I featured JPM on September 19th before the market open as the Bollinger Bands contracted. The stock broke out with a big surge and hit a new high in the process. The breakout did not hold as the stock fell back, but I still think the chart is more bullish than bearish. The 52-week high is still there and the stock has yet to break support. A close below 112 would argue for a reassessment. JPM reports on October 12th - in two days!
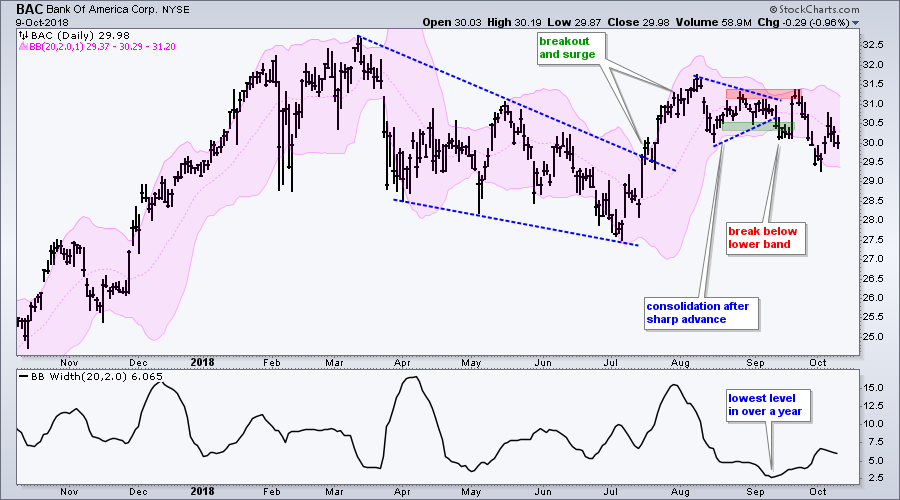
Bank of America (BAC) is the third largest holding (8.37%) and the stock broke the lower Bollinger Band after a squeeze. No wonder the market cannot get any traction! JPM breaks to the upside, while BAC breaks to the downside. A close above 31.5 is needed to reverse the break in BAC and turn bullish again. BAC reports on October 15th - next Monday.
August-September Leaders are Oversold
A number of ETFs that hit new highs in August and/or September are now short-term oversold. This means we have seen pullbacks within the bigger uptrend and there could be an opportunity. The basic trading strategy here is to enter when RSI moves above 30 and use the Chandelier Exit for an exit. Seems good in theory, but it does not always work in practice.
Before looking at some setups, let's review the strategy and the Chandelier Exit. The first chart shows IJR hitting a new high in late August, RSI moving below 30 on September 12th and RSI moving above 30 on September 13th for a bullish signal. Instead of bouncing, IJR continued lower and this trade is not working out.
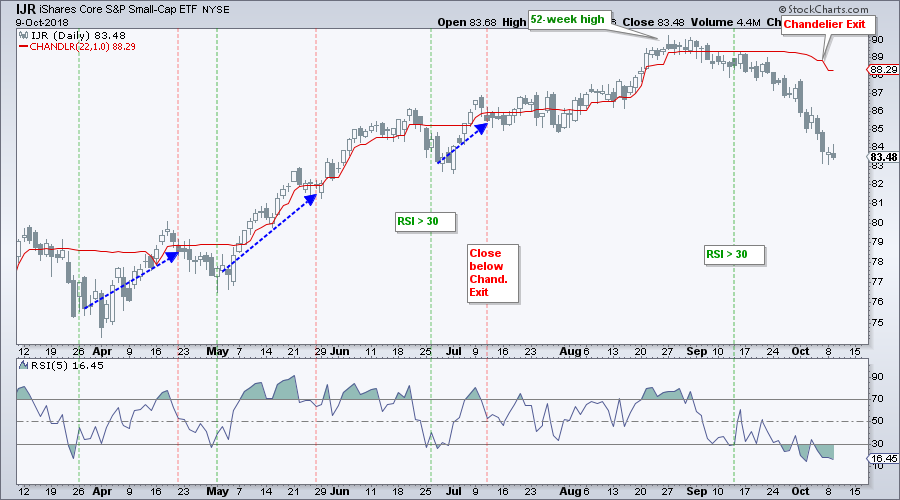
An exit signal triggers when price closes below the Chandelier Exit. Note that this indicator works as both an upside target and a trailing stop because the entry is almost always below the Chandelier Exit. This means price must move above the Chandelier Exit or the Chandelier Exit must move below price. Huh?
Understanding the Chandelier Exit
Note that I will be on MarketWatchers Live with Tom and Erin today (Wednesday) at 12PM ET. Among other things, I will explain the Chandelier Exit and how it works. I cannot emphasize enough how important it is to fully understand an indicator before you use it. Read the ChartSchool article, study the formula, chart the components when possible and analyze prior signals on the chart (with a magnifying glass).
The Chandelier Exit (22,1) equals the 22-day high less one ATR(22) value. In general, the indicator will fall when the 22-day high falls and rise when the 22-day high rises. On the IJR chart, we can see the 22-day high falling over the last two weeks and the Chandelier Exit also moving lower.
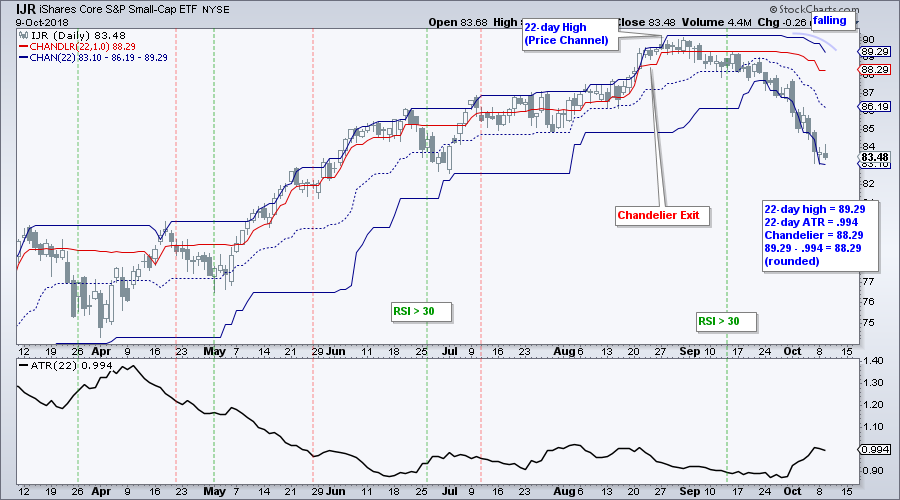
A rise in ATR(22) can also push the Chandelier Exit lower. Notice how ATR(22) moved from .871 to .994 over the last two weeks. The indicator subtracted .871 from the 22-day high two weeks ago and is now subtracting more (.994) from the 22-day high. This puts the Chandelier Exit further below the 22-day high.
Eventually, price will cross above the Chandelier Exit or the Chandelier Exit will cross below price. An exit setup will then materialize and an exit signal will trigger when price closes below the Chandelier Exit. Thus, the Chandelier Exit acts as a upside target when above price and as a trailing stop when above below price.
SPY and QQQ Join Oversold Parade
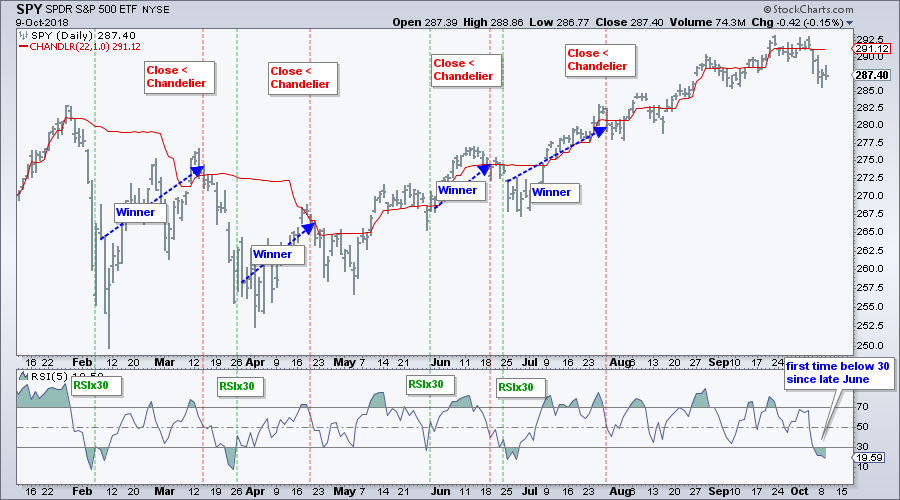
Returning to the oversold signals, note that RSI for IJR and MDY dipped below 30 a few times over the last few weeks as price continued lower after the initial signals. QQQ and SPY joined as RSI(5) moved below 30 last week. Similarly, the leveraged versions are also short-term oversold (SSD, UWM and QLD). See this article for system details and leverage.
9 Oversold Setups and 1 Example
I typically use 5-day RSI for the major index ETFs and 10-day RSI for industry-group ETFs and stocks. Major index ETFs are broader and less volatile than industry group ETFs and stocks. 5-day RSI is more sensitive so I use it with the less volatile names. 10-day RSI is less sensitive so I use it with the more volatile names.
The following industry group ETFs hit new highs in August and/or September and became short-term oversold over the last few days.
- Retail SPDR (XRT)
- Cloud Computing ETF (SKYY)
- Cyber Security ETF (HACK)
- Software iShares (IGV)
- Networking iShares (IGN)
- Mortgage REIT ETF (REM)
- REIT iShares (IYR)
- Transport iShares (IYT)
- Medical Devices ETF (IHI)
Note that I am not including the Internet ETF (FDN) in this list because it formed a lower high and broke the summer lows. Similarly, the Semiconductor iShares (SOXX) has been underperforming all year and the Semiconductor SPDR (XSD) broke below its summer lows.
Chartists looking to trade these setups must have a plan in force BEFORE initiating the trade. You know the drill: plan your trade and trade your plan.
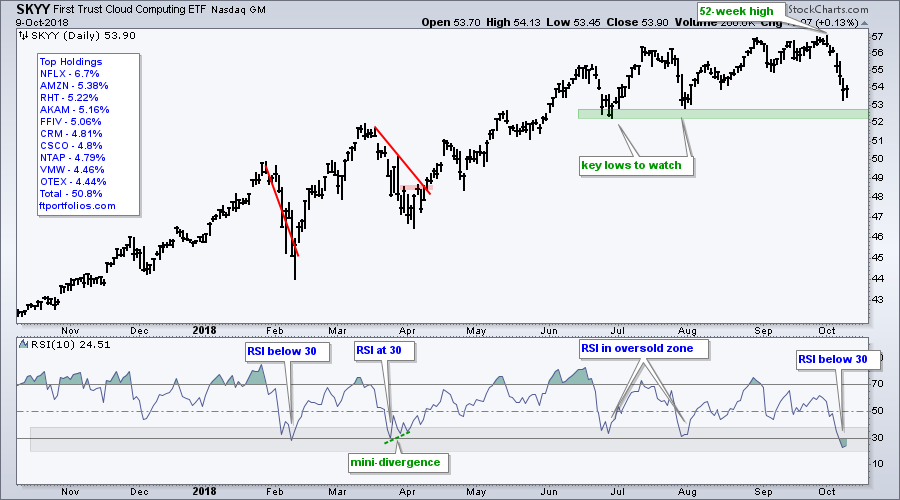
The chart below shows SKYY for an example and the summer lows are the benchmark lows to watch. Stocks or ETFs breaking below these lows are leading the way lower and should be avoided. Stocks and ETFs that recorded new highs in August-September and held above these lows still have their uptrends in place. SKYY is the most oversold in over year and just above the summer lows. The bigger trend is up and this condition could give way to a mean-reversion bounce.
Stocks to Watch: HOLX, VRSK, MA, AMJ, WMT
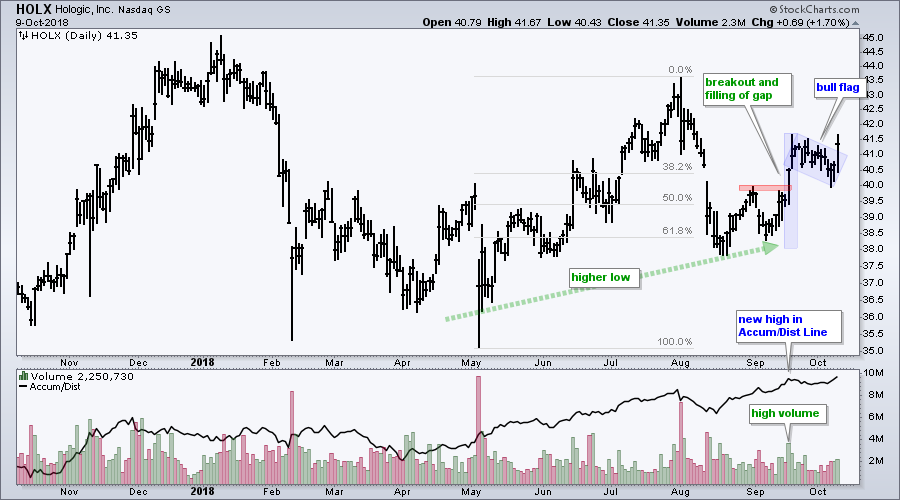
The first chart shows Hologic (HOLX) breaking out of a flag with an uptick in volume. HOLX reports on November 7th.
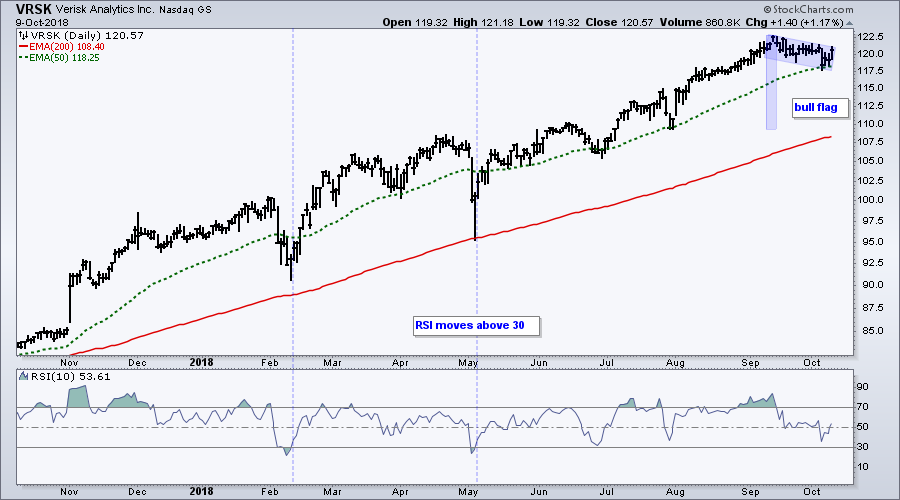
The next chart shows Verisk Analytics (VRSK) with a nice steady uptrend over the past year and a bull flag over the last few weeks.
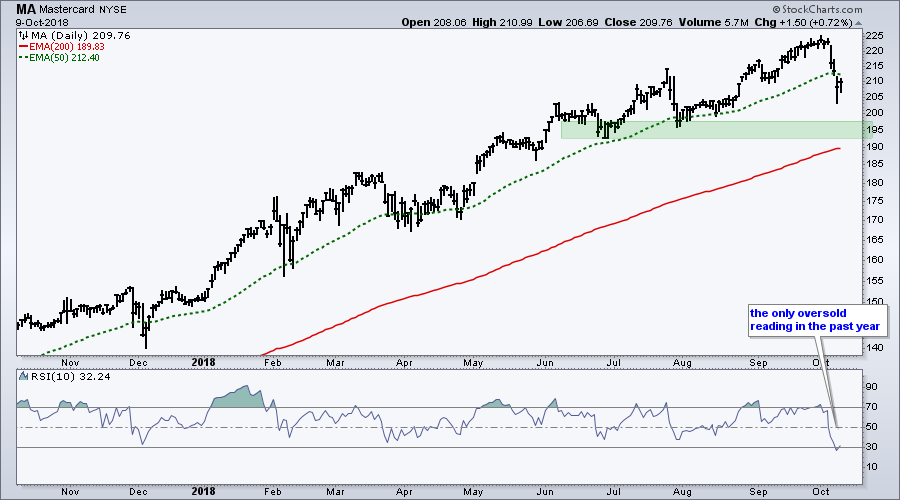
Mastercard sports a nice steady uptrend over the past year and RSI became oversold for the first time this year.
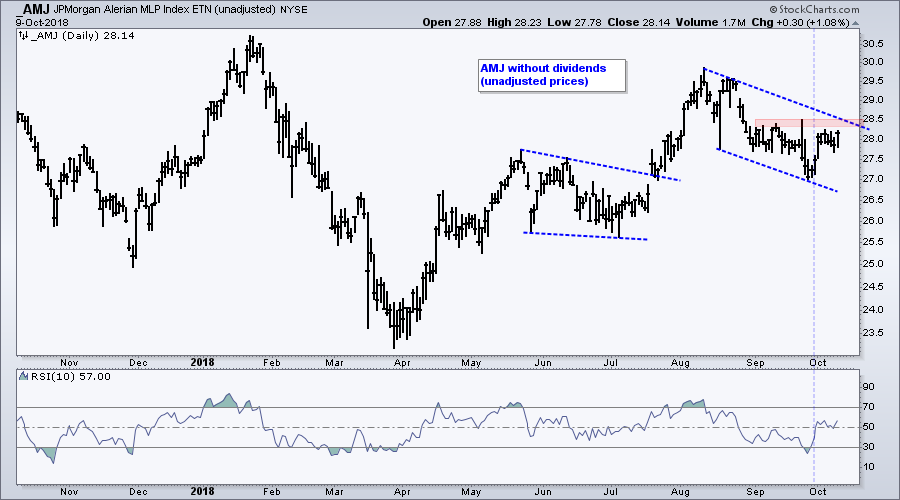
The unadjusted Alerian MLP Index ETF (_AMJ) has been trending higher since April and corrected recently with a falling channel into early October. Watch 28.5 for a breakout. The RSI mean-reversion signal already triggered.
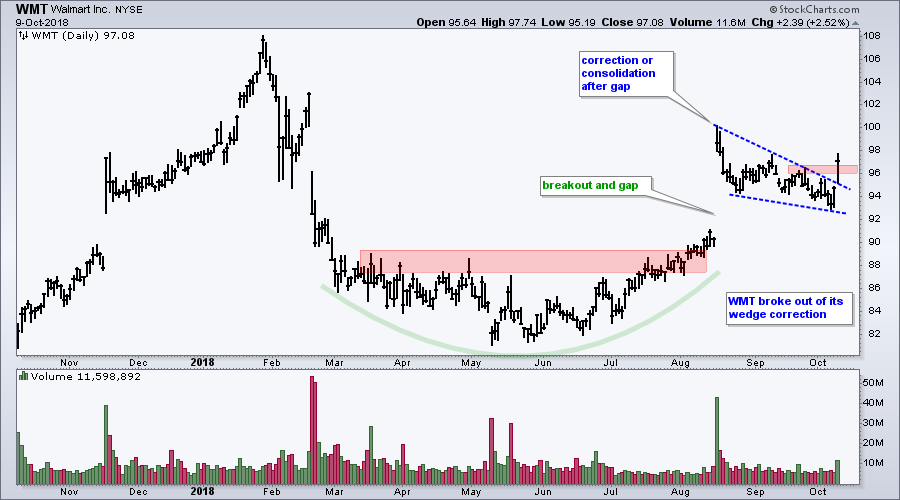
Wal-mart (WMT) broke out of its wedge correction with an uptick in volume.
On Trend on Youtube
Available to everyone, On Trend with Arthur Hill airs Tuesdays at 10:30AM ET on StockCharts TV and repeats throughout the week at the same time. Each show is then archived on our Youtube channel.
Topics for Tuesday, October 9th:
- The Case for a Mixed Market (ITB, SOXX, KRE vs XLI, XLV, XLE)
- XLE, XES and XOP Hold Breakouts (plus AMJ and FRAK)
- A Major Breakout in Natty Futures (UNG, USO, GASO)
- NatGas Stocks: EQT, HMPL, LNG, DCP, SWN, CRK, CHK
- Gold and the Bollinger Band Head Fake
- Insurance Leads Finance Sector (KIE)
- Click here to Watch
Questions, Comments or Feedback?
I cannot promise to response to all correspondence, but I will read it and take into under consideration. I greatly appreciate all feedback because it helps me improve the commentary and provides ideas for the future. Sorry, I do not take symbol requests.

Plan Your Trade and Trade Your Plan.
- Arthur Hill, CMT
Senior Technical Analyst, StockCharts.com
Book: Define the Trend and Trade the Trend
Twitter: Follow @ArthurHill


