- India and Brazil Remain Positive.
- The All Ords Index versus the Aussie ETF.
- Rupee Extends Decline Relative to US Dollar.
- Rupee Weighs on India ETF.
- Symbols for Currency Crosses.
 ... India and Brazil Remain Positive
... A few foreign stock indexes are holding up, but their Dollar denominated ETFs are underperforming because their currencies are weak relative to the Dollar.
In Tuesday's show, On Trend, I focused on several foreign stock indexes and a few of their respective ETFs. The German DAX ($DAX), the French CAC ($CAC), the Dow Jones Italy Index ($ITDOW) and the Dow Jones UK Index ($GBDOW) hit new 52-week lows this week and are leading lower. The Shanghai Composite ($SSEC) hit a new low last week, while the MSCI Emerging Markets Index ($MSEMF) and the South Korea Seoul Composite ($KOSPI) hit new lows this week. In his Market Message on Wednesday, John Murphy pointed out weakness in the STOXX Europe 600 ($STOXX600), Emerging Markets ETF (EEM) and Asia Ex-Japan ETF (AAXJ).
The PerfChart below shows the year-to-date performance for 12 country indexes. Ten of the 12 are down with only the India Nifty 50 Index ($NIFTY) and Brazilian Bovespa ($BVSP) showing gains. The S&P 500 turned negative for the year with yesterday's decline, but is down the least of the ten losers (relative strength). Elsewhere, the Nikkei 225 ($NIKK), Australia All Ords Index ($AORD) and Russian Trading System Index ($RTSI) are holding up better than average.
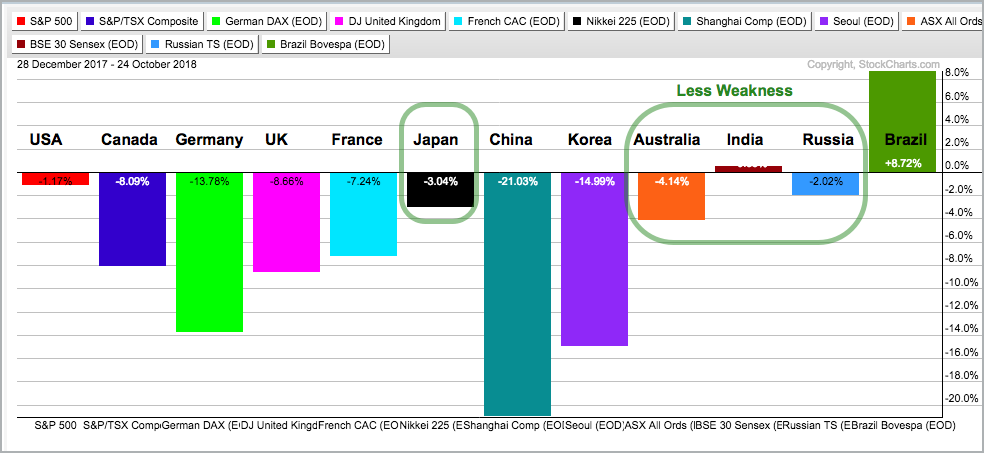
Note that I am only using foreign indexes that are priced in the local currency for this analysis. If you want to know how the country is performing, look at the index denominated in the local currency. US-based ETFs, in contrast, have a currency effect at work because they are dominated in US Dollars. This means the stock prices in the local currency must be converted to US Dollar prices. Thus, the ETF is a hybrid that reflects the performance of the underlying index and the local currency. A strong index and strong currency is the ideal situation, but this is not often the case.
The All Ords Index versus the Aussie ETF
Comparing a country index with an ETF and the currency cross is not an exact science because the index and the ETF may have different holdings and at different weights. However, we can get an idea of the currency effect by plotting the country index (local currency), the ETF (USDollar priced) and the currency cross. In this example, I am charting the Australia All Ords Index ($AORD) in the top window, the Australia iShares (EWA) in the middle and the Aussie/USDollar cross in the lower window.
Notice that the AORD Index hit a new high in August and was leading this summer. The ETF, in contrast, did not exceed its January high and formed a lower high this summer. The AORD Index is currently testing its February-April lows, while the ETF broke below these lows and recorded a 52-week low.
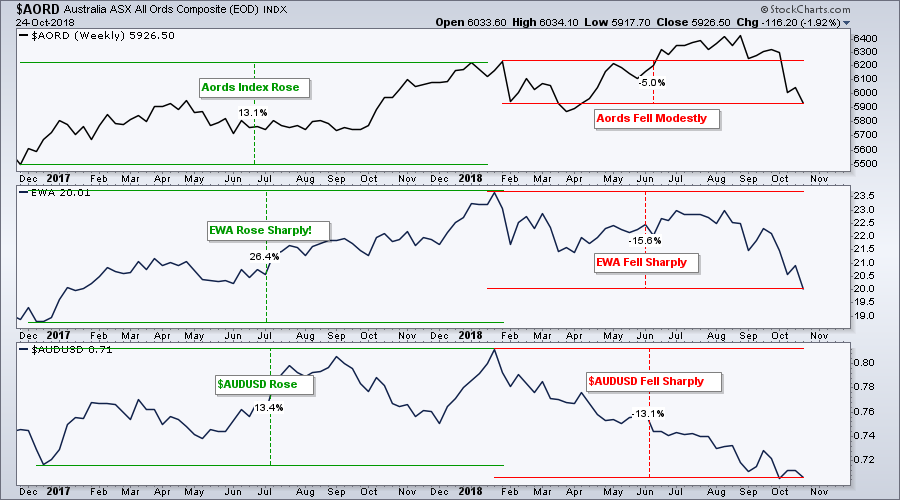
Blame weakness in the Aussie Dollar (or strength in the US Dollar). The bottom window shows the Aussie/USDollar Cross ($AUDUSD). The Aussie Dollar (numerator) is strengthening when this line rises and weakening with this line falls. The Australia iShares (+26%) had the best of both worlds in 2017 when the index and the currency both rose around 13%. This changed in January 2018 as the currency fell around 13% into October. Even though the Aords Index is down just 5%, the sharp decline in the $AUDUSD weighed on the Australia iShares (-15.6%).
Rupee Extends Decline Relative to US Dollar
Now let's turn to the India Nifty 50 Index ($NIFTY), the iShares S&P Nifty 50 ETF (INDY) and the Indian Rupee ($RUP). While we are at it, please welcome Milan Vaishnav and his new blog, Analyzing India, to our commentary team.
Before looking at the India ETF, let's analyze the currency. Keep in mind that currencies trade as crosses, one relative to the other one. These currency crosses are basically a ratio chart comparing one currency against the other. The chart below shows the Indian Rupee ($RUP), the Rupee/USDollar ETF (INR) and $ONE:$RUP. The Indian Rupee has been rising the entire year and this reflects weakness in the Rupee (strength in the US Dollar). Huh? What? This is because $RUP reflects Dollar/Rupee. As with any ratio chart, $RUP rises when the numerator (US Dollar) rises faster than the numerator (Rupee). This, a rising in $RUP means the Dollar is strengthening relative to the Rupee. Put another way, the Rupee is weakening relative to the Dollar.
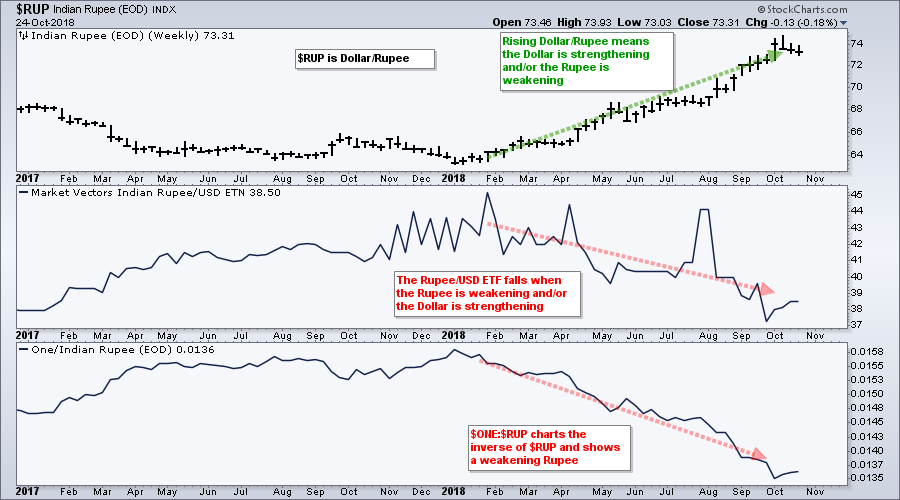
The middle window shows the Rupee/USDollar ETF (INR) falling as Indian Rupee ($RUP) rises. Thus, the numerator (Rupee) is falling faster than the denominator (US Dollar). The bottom window shows Indian Rupee in inverse by dividing it by $ONE ($ONE:$RUP). This is just like charting the Rupee/USDollar Cross.
Rupee Weighs on India ETF
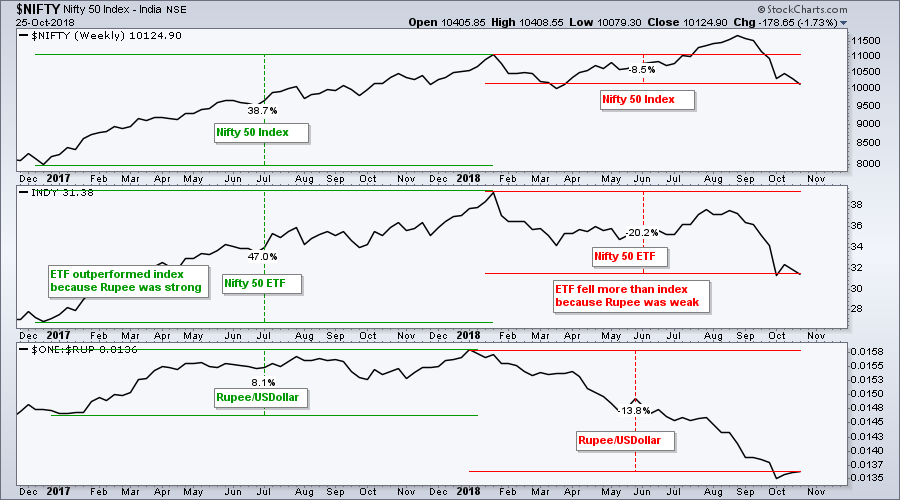
The next chart shows the same setup as with the Australia iShares. The top window shows the India Nifty 50 Index, the middle window shows the iShares S&P Nifty 50 ETF and the bottom window shows Rupee/USDollar ($ONE:$RUPEE). The ETF outperformed in 2017 because both the index and the Rupee advanced. The ETF fell more than the index in 2018 because the Rupee weakened considerably.
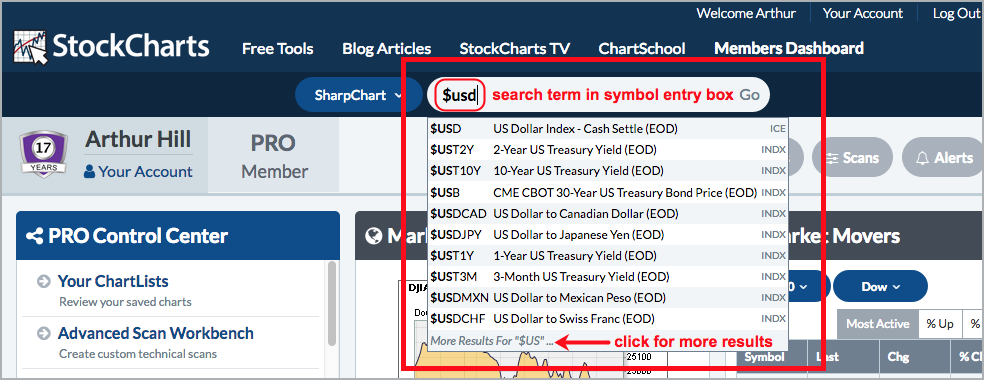
Symbols for Currency Crosses
StockCharts users can chart dozens of currency crosses. Simply start typing "$usd" in the symbol entry box at the top of any web page. The initial results will appear and you can click the "more results" link at the bottom for all the results. Remember, $USDJPY reflects the USDollar/Yen cross and $JPYUSD charts the Yen/USDollar cross.
Plan Your Trade and Trade Your Plan.
- Arthur Hill, CMT
Senior Technical Analyst, StockCharts.com
Book: Define the Trend and Trade the Trend
Twitter: Follow @ArthurHill


