- Defining the Broad Market Environment.
- Measuring Participation.
- Uptrends Versus Downtrends.
- Measuring Market Leadership.
- Weight of the Evidence.
 ... The Broad Market Environment
... For a long time now, I have been using three breadth indicators to define the broad market environment, bull market or bear market. As with trend-following, this system will not foreshadow a top or bottom in the stock market. Instead, this is a weight of the evidence approach designed to identify significant shifts in breadth that can signal the start of a bull or bear market phase. As with all systems and indicators, it is not perfect, but it gives me a framework and a clear signal for when to cry uncle.
I will cover the basics of these indicators in this article. Chartists looking for more detail can read the following articles: 10-day EMA of AD Percent, High-Low Percent indicators and %Above 200-day EMA.
I am using breadth indicators for the S&P 500, S&P Mid-Cap 400 and S&P Small-Cap 600. This amounts to some 1500 operating companies representing large-caps, mid-caps and small-caps. Around 925 stocks are from the NYSE and 575 are from the Nasdaq. This is an excellent cross-section of the stock market and a broad basket on which to base breadth indicators.
AD Percent Still in Bear Mode
The 10-day EMA of AD Percent is designed to identify a bullish or bearish breadth thrust. A move above +30% shows broad upside participation and this is deemed a bullish breadth thrust. A move below -30% shows broad downside participation and this is deemed a bearish breadth thrust. This indicator group turns net bullish or bearish when two of the three trigger signals.
This indicator group was net bullish from early March 2016 to early February 2018. All three triggered bearish breadth thrusts on February 5th, and only the 10-day EMA of S&P SmallCap AD Percent ($SMLADP) has since recovered with a bullish breadth thrust (May 21st).
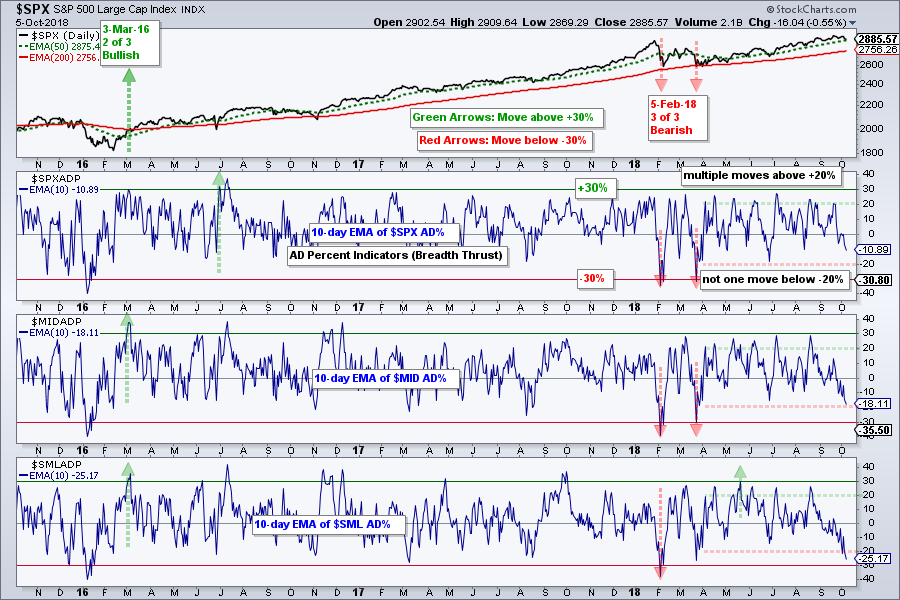
Even though we did not get any signals from April to October, the indicators show more upside participation than downside participation the last seven months. The horizontal green dashed lines are set at +20% and the red lines at -20%. The 10-day EMAs for S&P 500 AD Percent ($SPXADP) and S&P MidCap AD Percent ($MIDADP) have been above +20% several times and have yet to dip below -20%. The 10-day EMA for S&P SmallCap AD Percent ($SMLADP) dipped below -20% last week and this reflects broader selling pressure in small-caps.
Bottom Line: The stock market advance over the last few months did not fire on all cylinders because these key breadth indicators did not get above +30% from June to September. Less upside participation is less positive, but I would not call it negative or bearish. I would become concerned with the broad market environment if two of these three push below -30% in the coming weeks.
Uptrends Versus Downtrends
The percentage of stocks above the 200-day EMA is designed to measure trend participation. A move above 60% shows enough stocks in uptrends to warrant a bullish signal, while a move below 40% shows enough stocks NOT in uptrends to warrant a bearish signal. We could use the 50% level for signals, but this results in too many whipsaws.
Two of the three indicators triggered bullish in mid March 2016 (green arrows) and they remain bullish. There have been some dips below 50% over the last few years, but we have yet to see moves below 40%. A move below 40% is needed to show a clear majority of downtrends and turn bearish on this indicator.
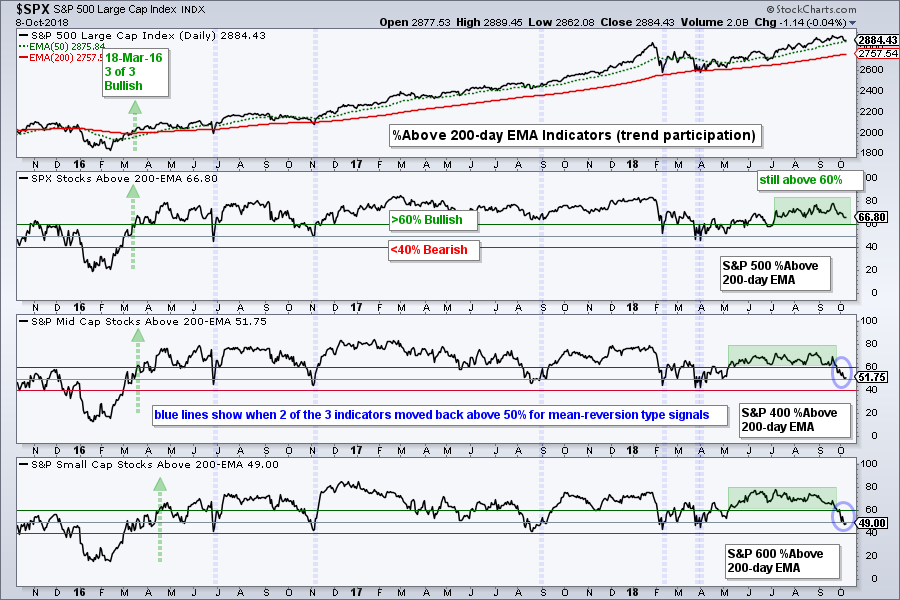 The blue vertical lines show when two of the three indicators moved above 50% (June 2016, November 2016, February 2018 and March-April 2018). This is kind of like a mean-reversion signal. The Small-Cap %Above 200-day EMA (!GT200SML) crossed below 50% last week and Mid-Cap %Above 200-day EMA (!GT200MID) is just above 50%.
Bottom Line: The percentage of small-caps and mid-caps above their 200-day EMA is the lowest since spring 2018, but large-caps are holding up fine right now. Until two of these three indicators trigger bearish with moves below 40%, I will watch for a potential mean-reversion signal near the 50% line in the coming weeks.
Measuring Market Leadership
The last indicator group covers High-Low Percent for the S&P 500, S&P Mid-Cap 400 and S&P Small-Cap 600. The horizontal lines are set at +10% and -10% for signals. A move above +10% shows enough upside leadership to turn bullish, while a move below -10% shows enough downside leadership to turn bearish. I don't use the zero line because there are too many whipsaws.
This indicator trio triggered bullish in late March 2016 when two of the three exceeded +10% and remains bullish. The S&P 400 High-Low% ($MIDHLP) triggered bearish in February, but flipped back to bullish in March.
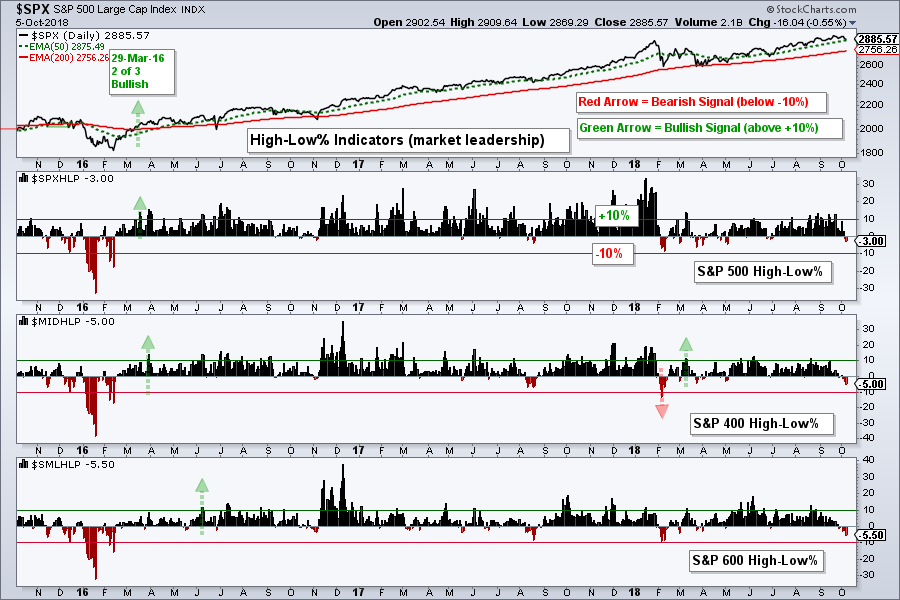
Most recently, we are seeing more new lows than new highs because the AD Percent indicators were red last week. Even so, it is not enough to turn outright bearish on the indicator. Two of the three need to move below -10% for the indicator group to turn bearish.
Bottom Line: Small-caps are leading the expansion of new lows with mid-caps not far behind. The High-Low Percent indicators have been negative a few times in the past, like August 2017, but we have not seen a serious expansion of new lows since January 2016. The trouble starts when two of the three exceed -10%.
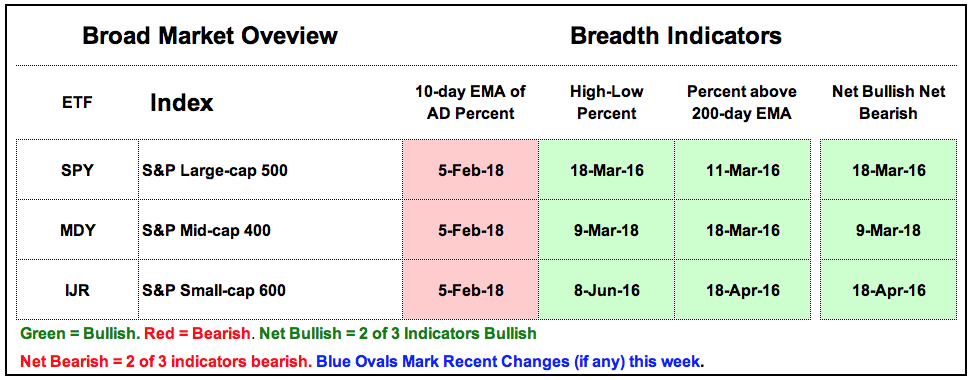
Weight of the Evidence
The table below sums up the signals for three indicators and three indexes over the last few years (nine total signals). The weight of the evidence has been bullish since March 2016 because the majority of indicators have been on bullish signals. Currently, three of the nine have active bearish signals. This means the bears need two more signals to turn the weight of the evidence bearish (cry uncle).
As with a trend following approach, I do not know when these indicators will turn and how long the signals will last. There will be whipsaws and bad signals, like 2015, but there will also be some extended signals that will produce big gains or prevent sizable losses. At the very least, this is framework I can use to plan my strategy going forward. I would also suggest reading through Greg Morris' blog, Dancing with the Trend, more on breadth and rules-based systems.
Questions, Comments or Feedback?
I cannot promise to response to all correspondence, but I will read it and take into under consideration. I greatly appreciate all feedback because it helps me improve the commentary and provides ideas for the future. Sorry, I do not take symbol requests.

Plan Your Trade and Trade Your Plan.
- Arthur Hill, CMT
Senior Technical Analyst, StockCharts.com
Book: Define the Trend and Trade the Trend
Twitter: Follow @ArthurHill


