- Setting Benchmark Lows and Highs.
- Healthcare is the Clear Leader.
- Ranking Sectors with CandleGlance Charts.
- Other Performance Metrics for the 11 Sector SPDRs.
- SPY Range and MDY Resistance.
- XLF and XLI Break Out.
- Forget Fed Speak and Watch the Action.
- Stocks to Watch (ADI, COO, INTC, MDT, SYMC...).
 ... Setting Benchmark Levels ...
Stocks surged on Wednesday with the biggest 1-day gains coming from the Nasdaq 100 ETF (+3.22%) and the Technology SPDR (+3.5%). Even though these two led for the day, they are still lagging on the price charts and healthcare is the real leader.
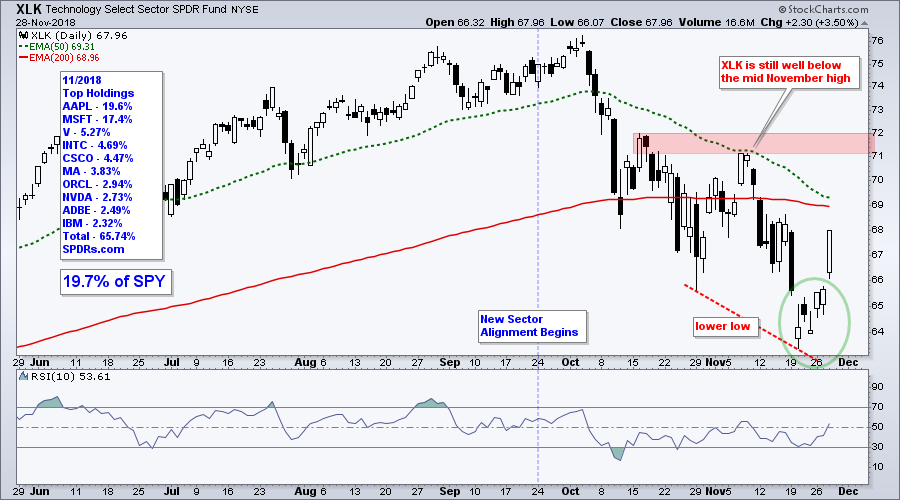
First and foremost, the late October low is a benchmark low that we can use to compare chart performance. ETFs and stocks that forged lower lows from late October to late November are underperforming on the price charts. ETFs and stocks that formed higher lows from late October to late November are outperforming on the price charts. The ability to hold above the late October low reflects less selling pressure and this is a form of outperformance on the price chart.
The first chart shows XLK with a lower low in late November and an island reversal of sorts. It is not an island reversal using the exact definition because the 20-Nov down-gap and 28-Nov up-gap do not align. Nevertheless, there is a down-gap, stall, and up-gap for a reversal over the last seven days.
Healthcare is the Clear Leader
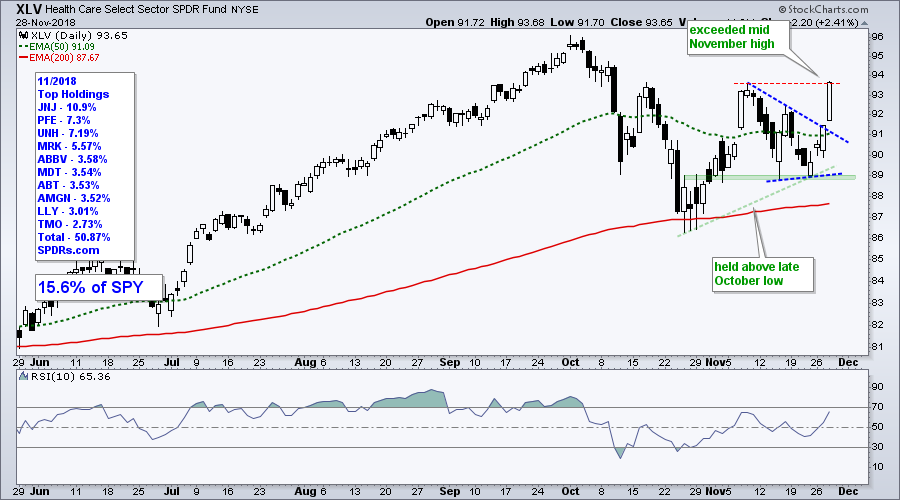
The next chart shows the Health Care SPDR (XLV) holding well above its late October low during the November dip. The ETF firmed near the early November breakout and mid-November low in the 89 area. XLV then gapped up on Monday, broke the triangle line on Tuesday and surged above the November high on Wednesday. XLK, in contrast, remains well below the mid November high and its chart is clearly not as strong. Note that the mid-November high is a benchmark high that we can use to compare charts.
Ranking Sectors with CandleGlance Charts
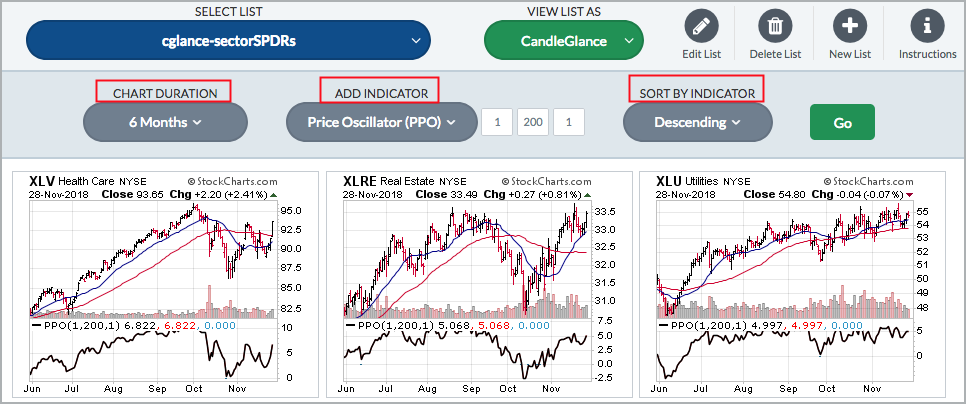
There are a zillion methods to compare performance. My personal favorite is comparing highs and lows on the price charts, as shown above. At some point, we must look at the price chart so why not just start with the price chart! Next, I like to compare price-based indicator values and chartists can use CandleGlance rankings for this purpose. I created a ChartList with the 11 sectors and SPY. Select "CandleGlance" from the "View List As" menu, then "Add Indicator" and click “Sort by Indicator". The image below shows a sort by the PPO(1,200,1), which measures the percentage distance between the 1-day EMA (close) and the 200-day EMA. XLV is the furthest above its 200-day EMA (6.82% above) and the leader in this category.
Other Performance Metrics for the 11 Sector SPDRs
- 63% of stocks in XLV are above their 200-day EMAs and this is the second best behind utilities (93%). Click here for chart.
- XLV had the highest High-Low Percent value (+9.5%) on Wednesday and this infers that healthcare produced the most new highs. Click here for chart.
- XLV is the furthest above its 50-day EMA and the 50-day EMA is the furthest above the 200-day EMA.
- XLV is the only sector trading at the high of the month in November.
SPY Range and MDY Resistance
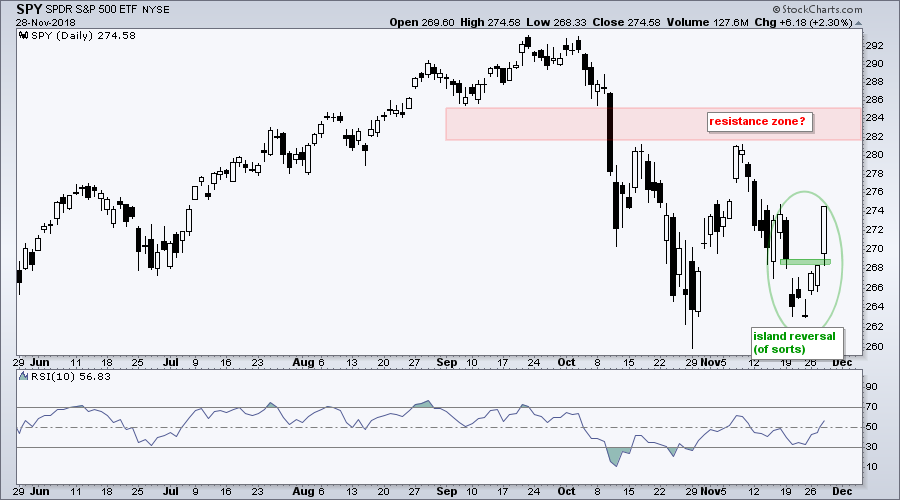
Wednesday’s bounce does not change my overall outlook, which turned bearish with the breakdown in mid October and bearish breadth signals. The outlook could also be construed as "not bullish" because the October declines threw the major index ETFs off trend. Having laid out my disclaimer, the next chart shows SPY with an island reversal of sorts over the last seven days. The October low held, but the ETF remains well below the mid November high. I have no idea how far or how long this bounce will extend, but I still think SPY is "off trend" and this could lead to a choppy range. For now, I will mark resistance in the 282-285 area.
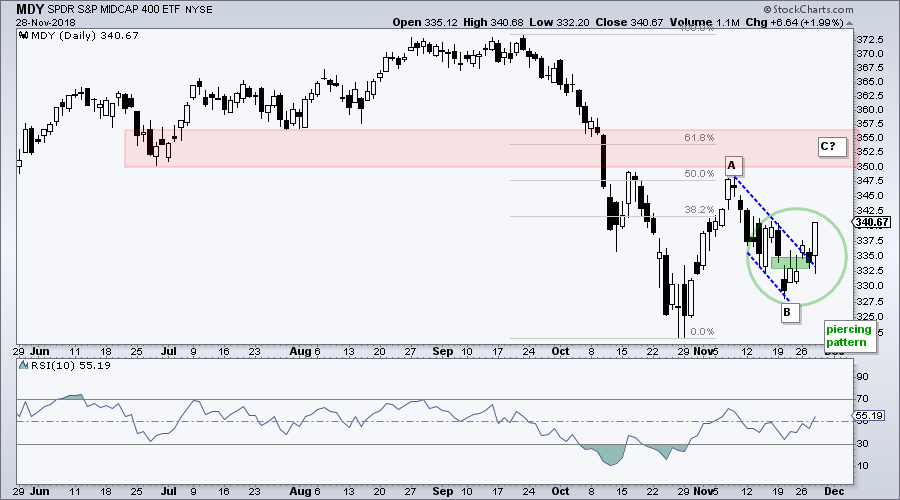
The next chart shows MDY with a gap up on Monday, big surge on Wednesday and channel breakout. This breakout signals a continuation of the prior advance (Wave A) and ends Wave B. Should this evolve into an ABC correction, MDY could advance to the 250-255 area for Wave C. Keep in mind that this is pure crystal ball type speculation and could very well be (gasp) wrong!
XLF and XLI Break Out
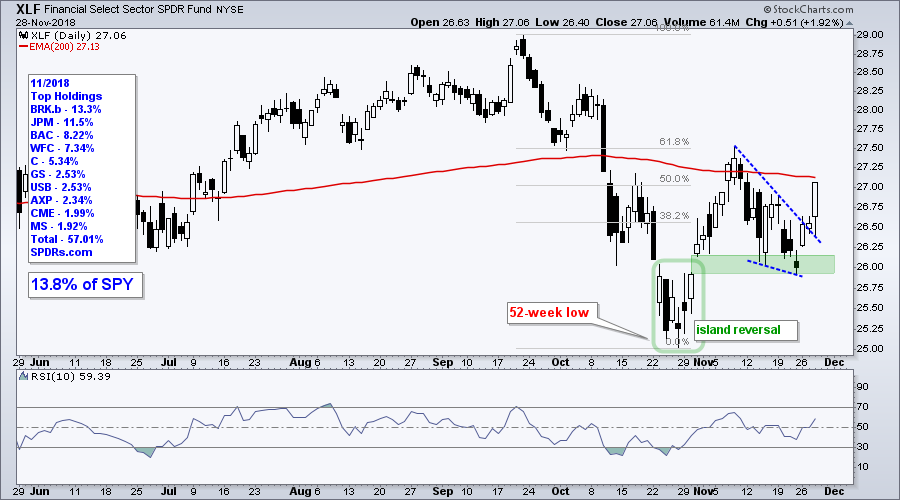
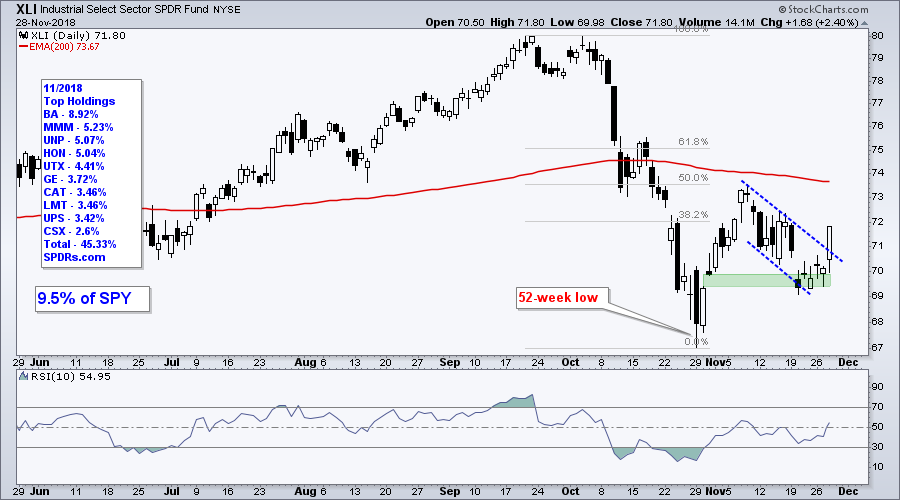
The next charts show the Financials SPDR (XLF) and Industrials SPDR (XLI) because they held up better than the broader market during the November dip. XLF and XLI held well above their October lows. XLF broke out of a falling wedge with a big surge and XLI broke out of a falling channel/flag. These breakouts are short-term bullish, but keep in mind that both recorded 52-week lows a month ago and the long-term picture is still negative.
Forget Fed Speak and Watch the Action
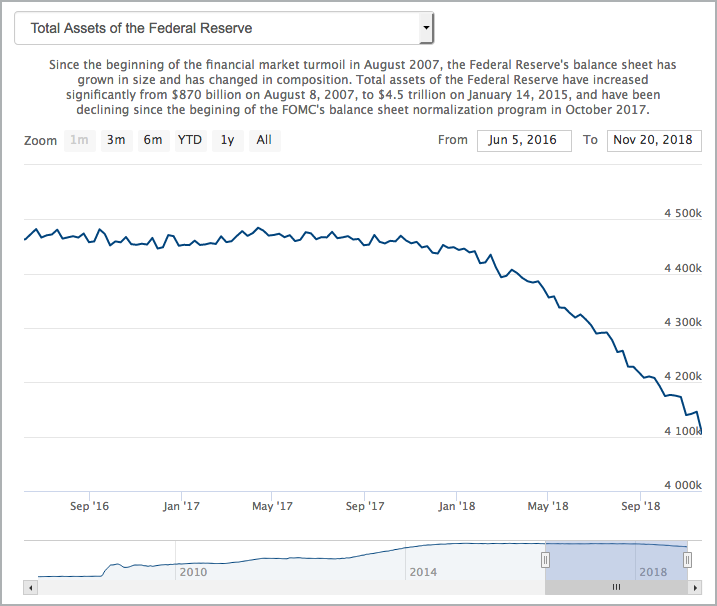
I do not follow Fed speak for two reasons, at a minimum. First, the bond market usually leads the Fed and the 10-year Yield ($TNX) usually makes its move before the Fed changes its stance. Second, the Fed's balance sheets shows what is happening with liquidity. Simply put, there is more liquidity when the balance sheet expands and less when the balance sheet shrinks, and the balance sheet is clearly shrinking. You can find a chart of the Fed's balance sheet here.
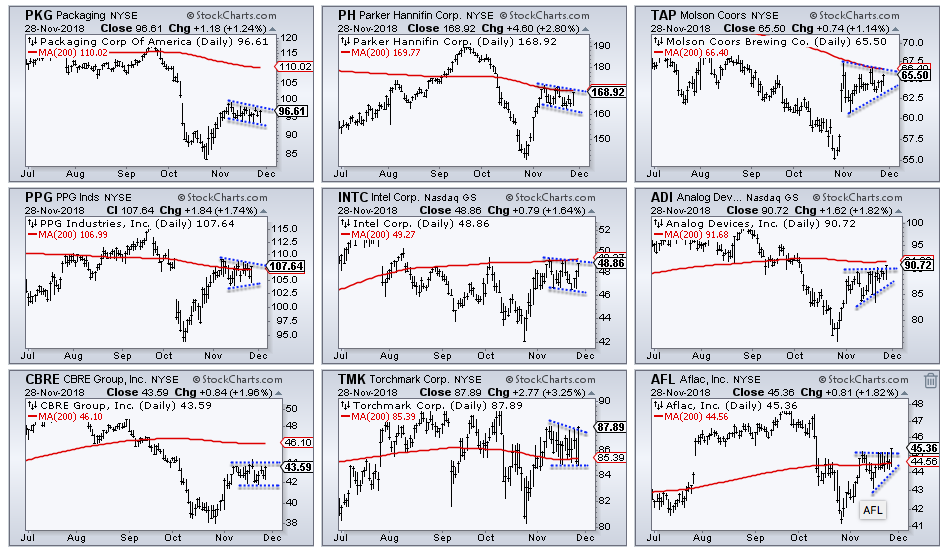
Stocks to Watch
There are lots of charts showing 52-week lows in October and/or declines throughout 2018. Many of these beaten down names then surged in the first half of November and consolidated in the second half of November. The long-term trends are still down, but the patterns over the last few weeks look like bull flags. Upside breaks would be short-term bullish, while downside breaks would suggest a pattern failure. These are for short-term traders only and carry above average risk (IMHO).
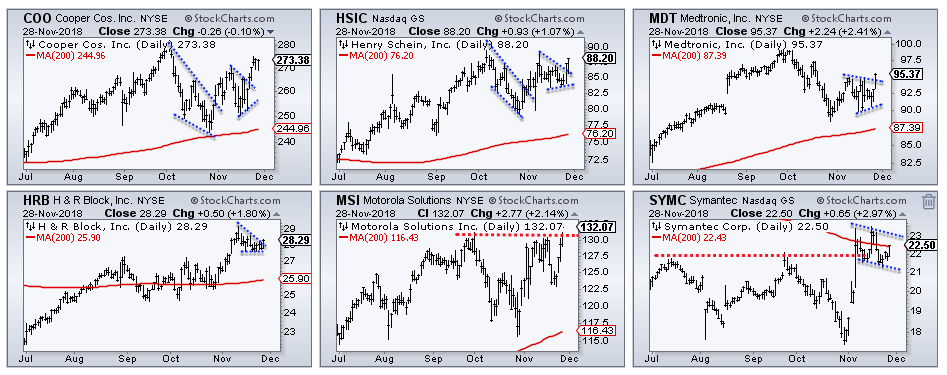
The next group shows stocks that are stronger than the first group. Namely, all six are above their 200-day moving averages. Admittedly, Symantec (SYMC) looks more like the first group, but notice that the stock broke above the July-September highs with a big surge in early November. The stock is consolidating above the breakout zone. The top three are in the Medical Devices ETF (IHI), which is one of the stronger groups.
On Trend on Youtube
Topics from Tuesday, November 27th:
- Broad Market Overview - 50-days Closing Fast
- Big Sectors Continue to Weigh - Defensives Hold Up
- Bounces within Bigger Downtrends (KRE, IBB, ITB...)
- Focus on Semiconductor ETFs and Stocks
- Stock to Watch (AMGN, ANTM, LLY, MRK, PFE...)
- Click here to Watch
Plan Your Trade and Trade Your Plan.
- Arthur Hill, CMT
Senior Technical Analyst, StockCharts.com
Book: Define the Trend and Trade the Trend
Twitter: Follow @ArthurHill


