- Defining the Current Market Environment.
- Elliott Wave, Dow Theory and Counter-trend Moves.
- Yearend Seasonality is Bullish.
- Sentiment Reaches Bearish Extremes.
- Focus on the Price Chart!
 ... Making Adjustments ...
As traders and investors, it is important to understand the current market environment and adjust our strategy accordingly. Are we in a low volatility environment with a steady uptrend in the major stock indexes? Or, are we in a volatile environment with relatively big swings. I think we know the answer to this question.
The chart below shows the S&P 500 with four distinct periods over the last 15 months: two with low volatility and two with high volatility. The indicator window shows the 1-day Rate-of-Change with horizontal lines at +1% and -1%. The green shading highlights two low-volatility periods when the market advanced. Bulls love dull markets! The red shading shows when volatility expanded. Notice that these volatility expansions started with a sharp move lower.
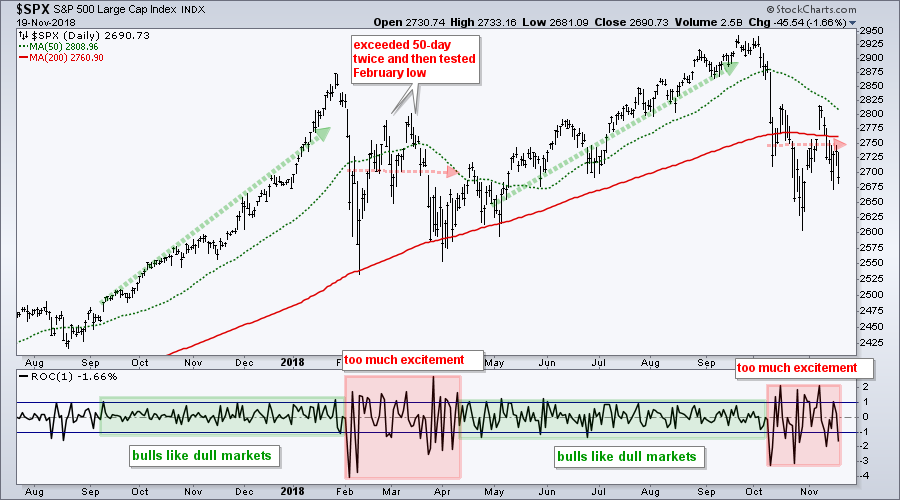 The current market environment turned volatile in mid October and remained relatively volatile into November. The prior high-volatility period lasted around eight weeks. Prior to this, there was seven month period when volatility remained above average form August 2015 to February 2016. Boy was that fun. Not!
Nobody knows how long the current period will last, but volatility is currently above average and we can adjust our strategies accordingly. There are a number of ways to deal with volatility. First, we can raise cash and lower our exposure to equities. Second, we can become more selective and defensive. Third, we can look to diversify away from equities.
Chartists looking to remain active and trade during periods with above-average volatility also need to consider making adjustments. First, traders might consider trying to catch price swings earlier instead of waiting for a bigger breakout. Breakouts are more likely to fail in a volatile environment. Second, traders might consider booking profits earlier. Third, traders might also consider lowering their expectations.
Elliott Wave, Dow Theory and Counter-trend Moves
Normally, I would ignore a short-term bullish setup when my longer-term indicators are bearish, but the market could be setting up for a counter-trend bounce. Read all the way to the end (No breakout, no bounce!). Such a bounce could even be enough to turn my breadth indicators bullish, but I will cross that bridge when/if it gets here. For now, sentiment is quite bearish, seasonal patterns in November-December are bullish and the short-term charts are setting up.
Before diving into the short-term setups, I would like to discuss the nature of a Wave 2 bounce (Elliott Wave) or the secondary reaction to the primary trend (Dow Theory). Note this is based on the assumption that the October decline is the start of a bigger downtrend. In Elliott Wave Theory, Wave 2 is often a strong counter-trend bounce that retraces a good portion of Wave 1, which was initial the impulse down. Wave 2 offers the bulls hope that an actual bear market has not started.
Dow Theory offers a similar perspective. Here is a quote from our ChartSchool article:
Hamilton noted that reaction rallies during bear markets were quite swift and sharp. As with his analysis of secondary moves in general, Hamilton noted that a large percentage of the losses would be recouped in a matter of days or perhaps weeks. This quick and sudden movement would invigorate the bulls to proclaim the bull market alive and well.
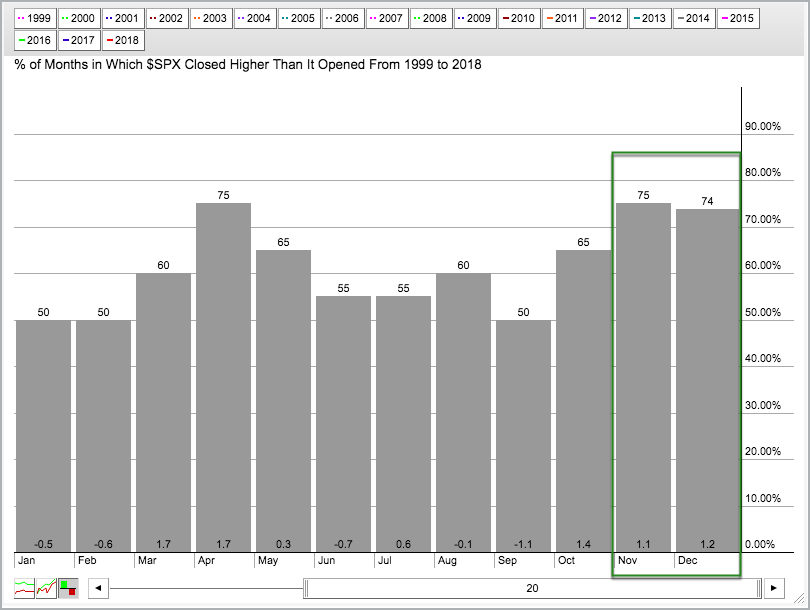
Yearend Seasonality is Bullish
The chart below shows the monthly seasonal patterns for the S&P 500 over the last twenty years. Notice that the index closed higher 75% of the time in November and 74% of the time in December.
Sentiment Reaches Bearish Extremes
My twitter feed is full of tweets showing that sentiment has reached bearish extremes. The CNN Fear and Greed Index is at 10, which shows extreme fear. AAII bears have been above average for six weeks and outnumbered bulls this past week. Erin Swenlin's ChartWatchers article pointed out at the NAAIM Exposure Index was at its lowest reading in over two years, which means there is plenty of cash on the sidelines. Jason Goepfert of SentimenTrader notes on his blog that puts are becoming quite popular.
The next chart shows the CBOE Total Put/Call Ratio with the 10-day EMA and the PPO(10,65,0). Notice that the 10-day EMA exceeded 1.15 in late March and late October. This shows excessive put volume and represents excessively bearish sentiment, which is bullish.
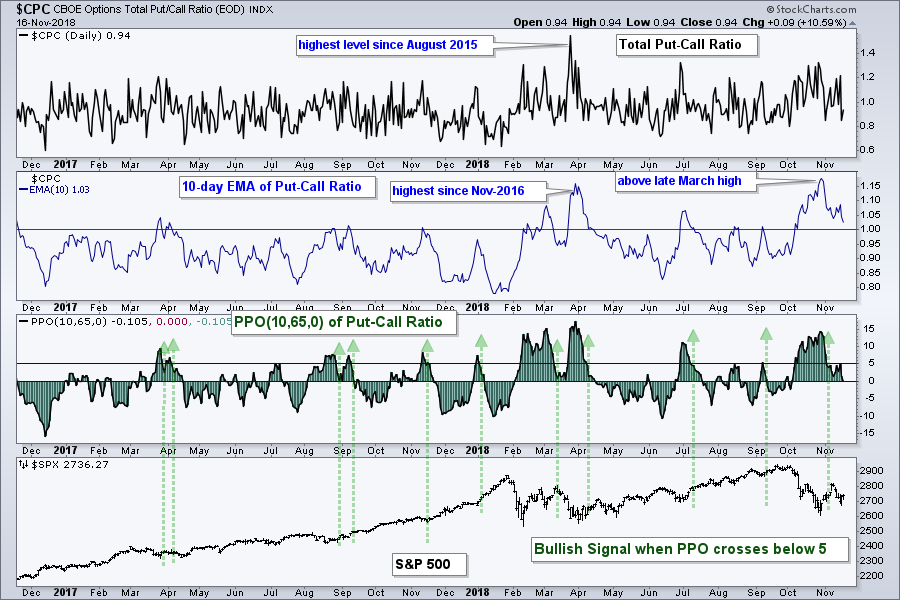
The third window shows the percentage difference between the 10-day EMA and 65-day EMA, which normalizes the indicator. This indicator is elevated when above 5%. As the green arrows show, a subsequent move back below 5% sometimes corresponds with a low in the S&P 500.
Focus on the Price Chart!
Sentiment, seasonal patterns, 2nd waves and Dow Theory are all interesting, but they are not great for timing and the price chart is the ultimate arbiter. First and foremost, note that my broad market outlook remains "not bullish" because the October decline threw the major indexes "off trend". There can still be some sizable swings both ways and I will focus on these swings.
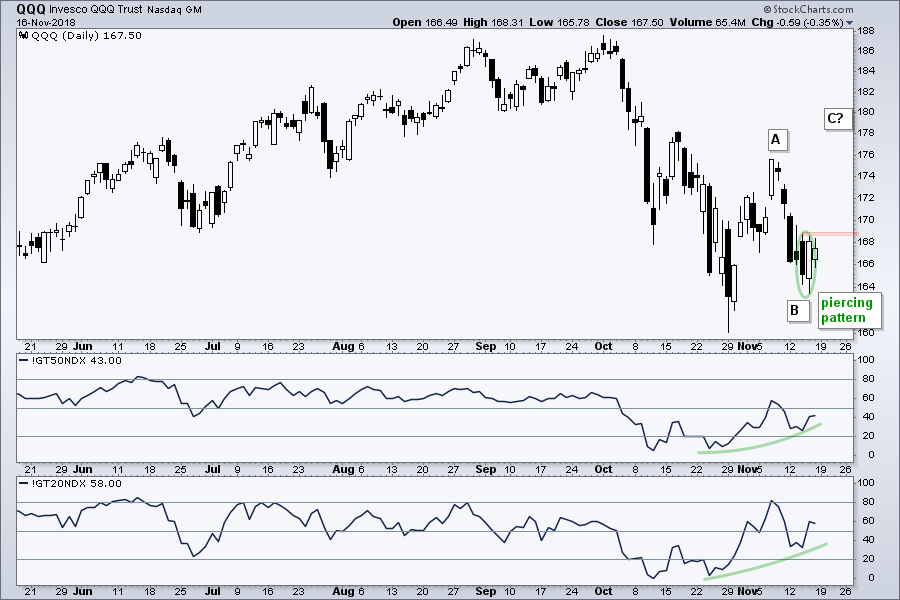
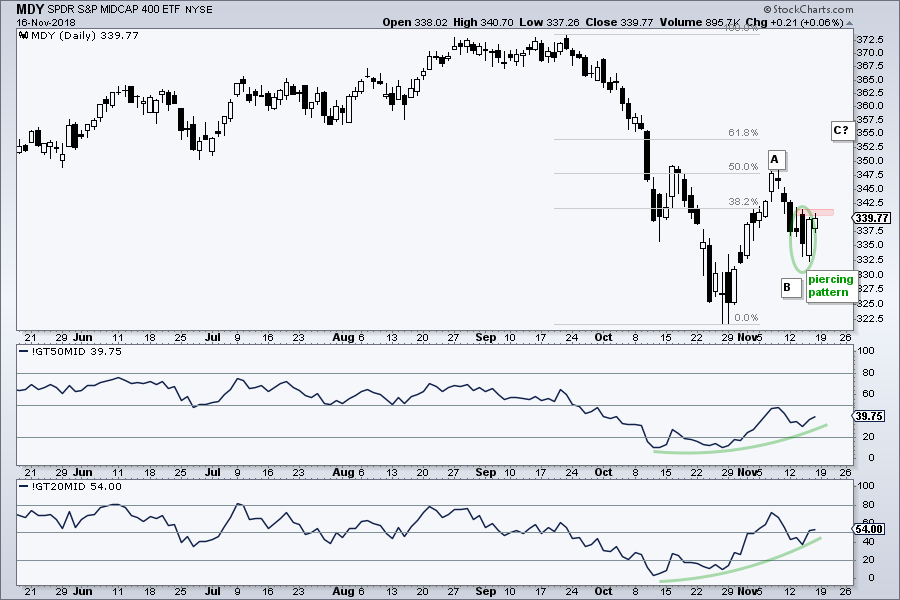
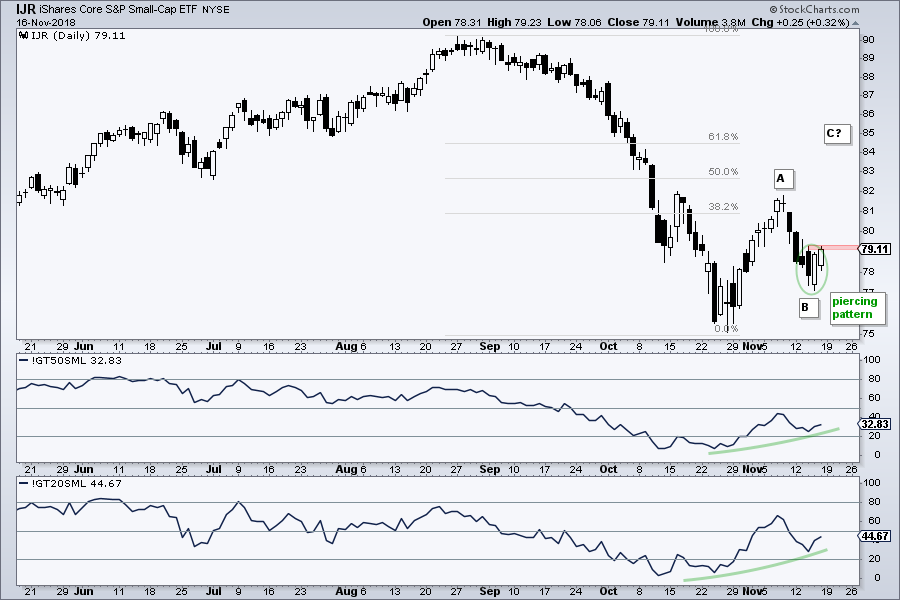
The next four charts show the major index ETFs with two breadth indicators, the percentage of stocks above the 50-day EMA and the percentage of stocks above the 20-day EMA. Overall, breadth improved over the last few weeks. Over 50% of stocks in the S&P 500, S&P Mid-Cap 400 and Nasdaq 100 are above their 20-day EMAs. Over 40% of stocks in the S&P 500 and Nasdaq 100 are above their 50-day EMAs. Moves above 50% would make the cup half full. Clearly, the Nasdaq 100 and S&P 500 show more internal strength.
The first chart shows SPY with a surge from late October to mid November and a sharp pullback early last week. Short-term, this chart caught my eye because SPY firmed in the gap zone and formed a piercing pattern, which is a bullish candlestick reversal pattern. The ETF edged higher on Friday and a breakout at 275 would be short-term bullish. This could trigger a move above the mid November high.
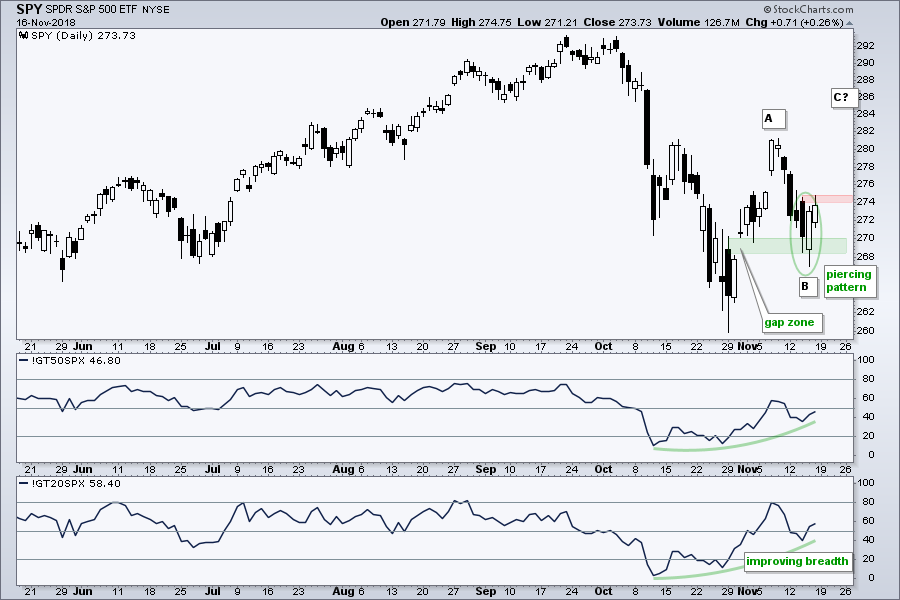
Returning to Elliott Wave theory and getting out the crystal ball, a move above the November high could evolve into an ABC zigzag correction. Thus, SPY would break a clear resistance level, confirm the head-and-shoulders pattern seen around the world and clear the 50-day SMA. The bulls would also likely sound the all clear in the 284 area. Let's cross that bridge when and if its gets here.
The next charts show QQQ, MDY and IJR for reference. Note that pullbacks in SPY and MDY were the shallowest because they held above the 31-Oct gaps. This suggest a little relative strength during the pullback because they held up the best. At this point, I am looking for follow through to the piercing patterns and breaks above the red resistance zones. No breakout, no bounce.
- Arthur Hill, CMT
Senior Technical Analyst, StockCharts.com
Book: Define the Trend and Trade the Trend
Twitter: Follow @ArthurHill


