- Checking and Balancing the S&P 500.
- Rodeo Range for the S&P 500.
- Small and Mid Caps Range after Breakdown.
- Confirmation and the Big Six Sectors.
- Retail is Not Hot.
- Credit Conditions Tightening.
- Palladium Continues Strong.
- Platinum Breaks Down.
- Gold Fights Downtrend and Strong Dollar.
- Notes from the Art's Charts ChartList.
 ... Checking and Balancing the S&P 500 ...
Despite the criticism for lagging signals and whipsaws, the humble moving average is still a valuable tool for gauging the broad market trend. The 200-day SMA is probably the most widely used moving average, and the S&P 500 is the most widely used benchmark for the U.S. stock market. Taken together, the 200-day SMA and S&P 500 can be used to assess the broad market trend.
Extrapolating from these ideas, I am going to apply the 40-week SMA to the S&P 500 and the S&P 500 Equal-Weight Index. The 40-week SMA is roughly equivalent to the 200-day SMA, while the S&P 500 Equal-Weight Index reflects the "average" stock in the S&P 500, which is weighted by market-cap. Note that 52 stocks in the S&P 500 have a market cap above $100 billion, while 73 have a market cap less than $10 billion.
With two indexes, we can confirm signals and, hopefully, reduce whipsaws. Keep in mind that moving averages are trend-following indicators and will always lag. The chart below shows weekly bars over the last five years. There were two whipsaws (October 2014 and March 2018). Both indexes broke their 40-week SMAs in early August 2015 and this timely signal avoided the decline into January 2016.
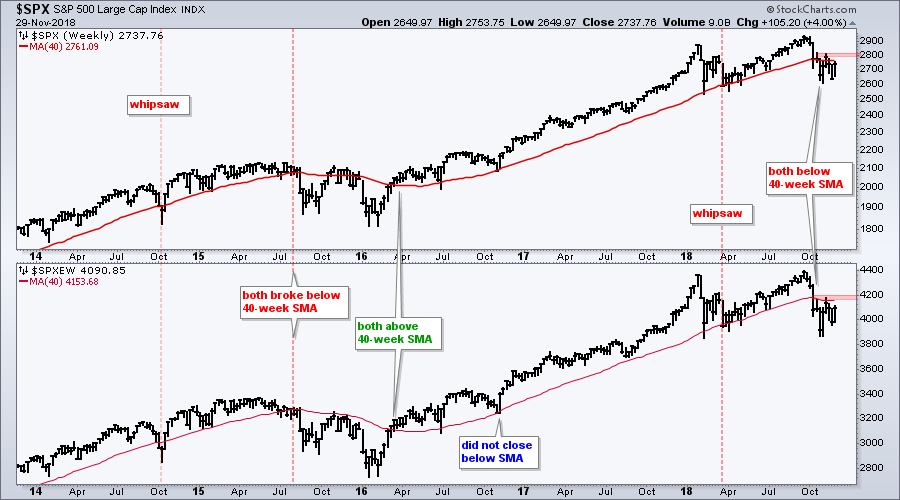
Both indexes broke below their 40-week SMAs with a sharp decline in October. The S&P 500 moved back above with a bounce into early November, but the S&P 500 Equal-Weight Index fell short. Both are currently below their 40-week SMAs, but it would not take much to push them back above these key levels.
Combining moving average levels with recent highs, I would look for the S&P 500 to close above 2820 and the S&P 500 Equal-Weight Index to close above 4200. Such moves would show follow through to the recent bounces and argue for a reassessment of the current downtrends.
Rodeo Range for the S&P 500
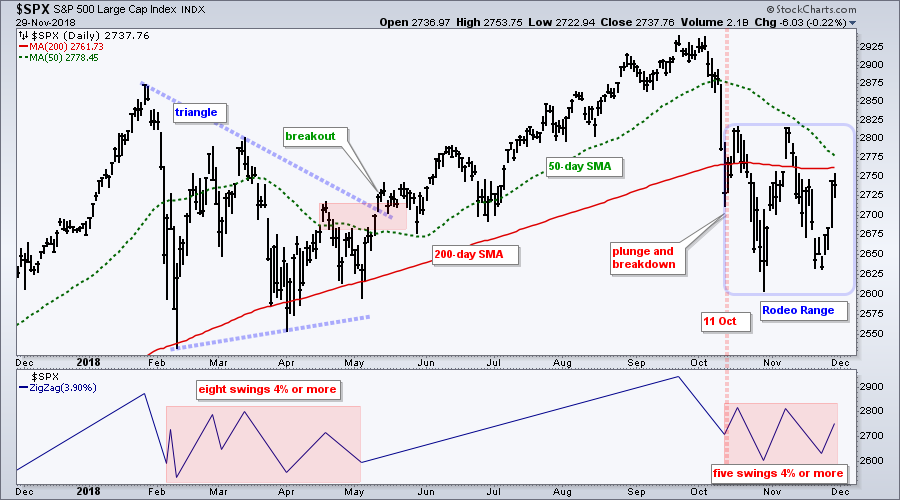
The next chart shows the breakdown in more detail and the 50-day SMA closing in on the 200-day SMA. You can bet that a death cross would be ALL OVER the financial media. Even with this week's surge above 2720, nothing has really changed on this chart. The index broke down on October 11th and the broad market breadth indicators turned bearish on October 10th. The bulls are bucking hard since these signals and trying to throw off the bear, but they have yet to succeed. Thus, until these signals are reversed, I remain bearish at worst and "not bullish" at best.
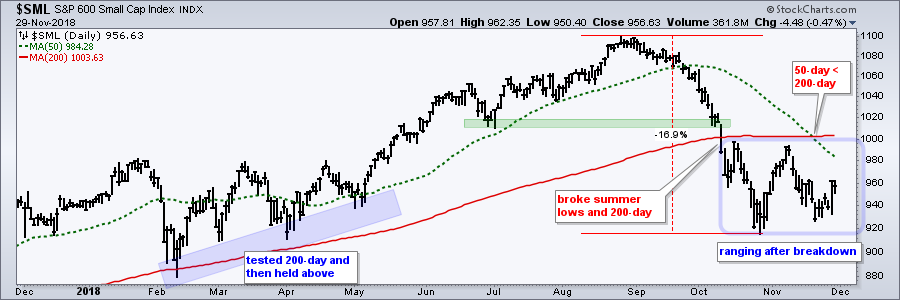
Small and Mid Caps Range after Breakdown
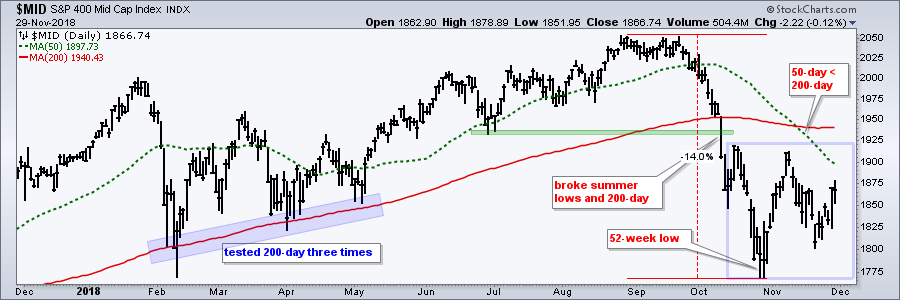
The next two charts show the S&P Mid-Cap 400 and the S&P Small-Cap 600 breaking down in October and ranging since these breakdowns. Note that both are ranging below the breakdown levels (green) and both have active death crosses. $MID hit a 52-week low in late October and $SML experienced the sharpest peak-to-trough decline of the major index ETFs (-16.9%).
Confirmation and the Big Six Sectors
The next chart shows the five big sectors, which account for around 78% of the S&P 500 SPDR. Extending the confirmation concept, the outlook for the broader market will improve when the majority of these are back above their 200-day SMAs. Currently, the Health Care SPDR is the only one trading above its 200-day SMA. Even though it is the second largest sector and the strongest, healthcare cannot prop up the broader market by iteself.
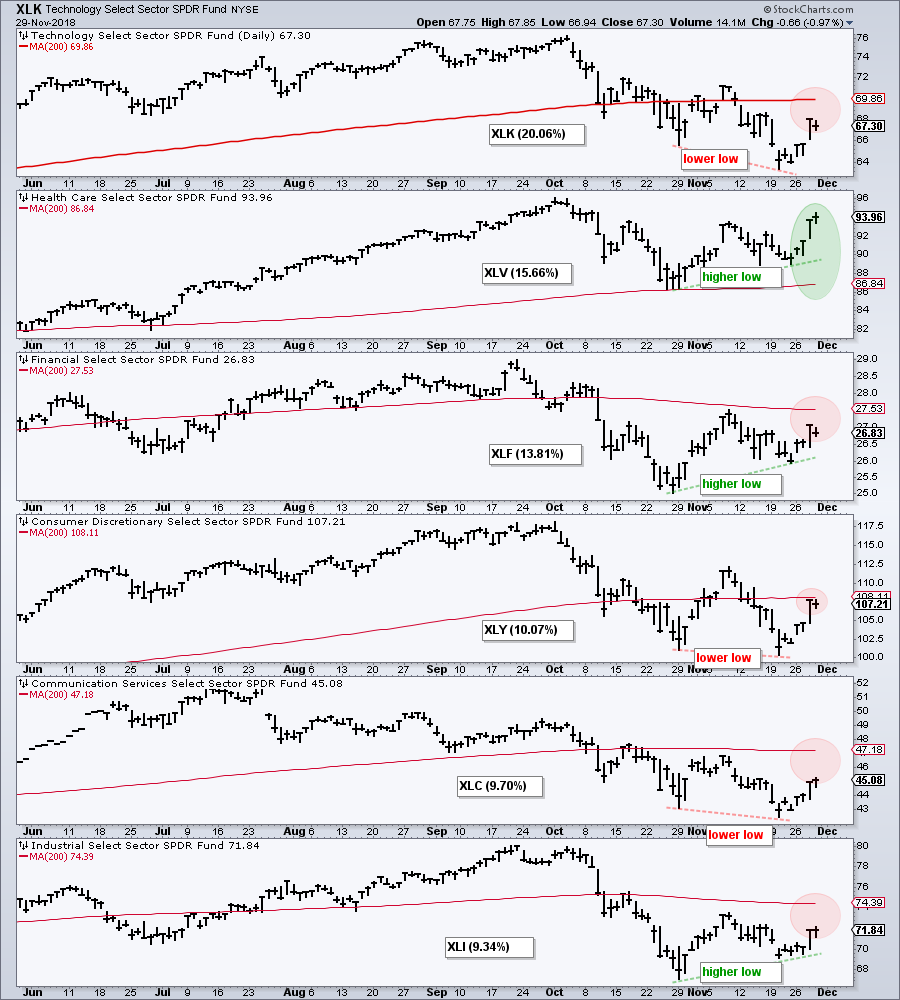
The charts also show that three sectors forged lower lows from late October to late November (red lines) and three forged higher lows. The three with the higher lows held up better during the November dip. The Health Care SPDR is the only one that moved above its mid November high.
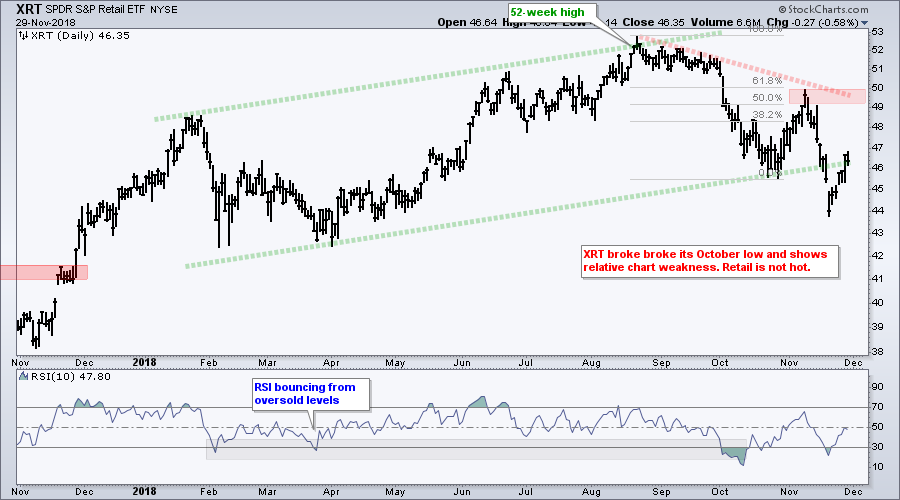
Retail is Not Hot
Black Friday results are in and the Retail SPDR (XRT) is not impressed. XRT reversed near the 61.8% retracement in early November and broke below the October low this month. The ETF also broke the rising channel that was in place from January to October. The trend in XRT is down since mid August and this ETF continues to lag. Keep in mind that this ETF has over 90 stocks and represents a broad cross section of retailers. Relative and absolute weakness in XRT is not a good sign for stock market or the economy.
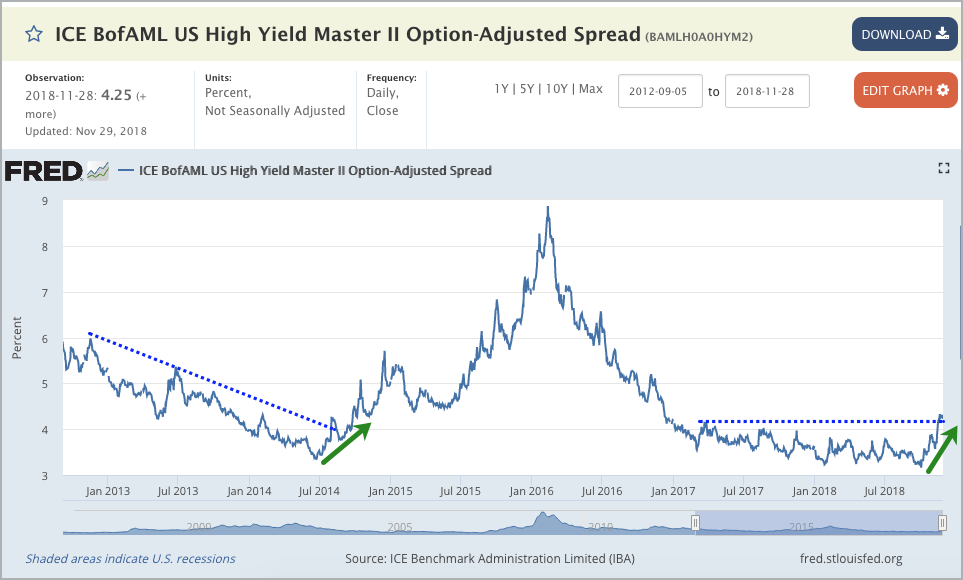
Credit Conditions Tightening
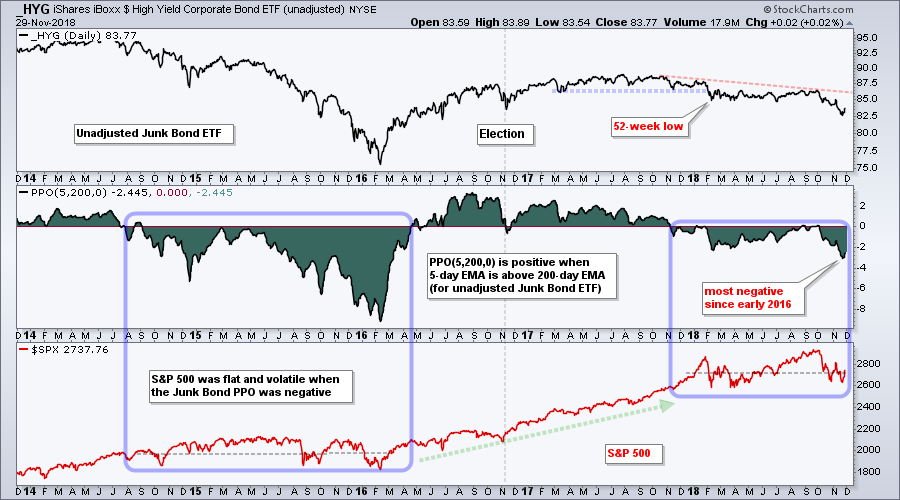
I showed a chart of the Fed balance sheet on Thursday and will show a chart of the high yield spread today. This is basically the difference between the U.S. Treasury yield and the junk bond yield. The yield on junk bonds is rising faster than the yield on Treasuries when this spread rises and this suggests a tightening of credit conditions.
The chart shows how the spread fell from late 2012 until mid 2014 and then turned up in the second half of 2014 (green arrow). The spread peaked in early 2016 and fell until January 2018. This spread was basically flat from January to September and then turned up in October. It is currently at its highest level since late 2016.
StockCharts members can chart the unadjusted High-Yield Bond ETF (_HYG) to measure the performance of junk bonds without the distributions. The indicator window shows the PPO(5,200,0), which measures the difference between the 5-day EMA and 200-day EMA. The 5-day EMA is more than 2% below the 200-day EMA right now. In addition, the 5-day EMA has been largely below the 200-day EMA since November 2017. The blue areas show when the PPO was mostly negative from August 2014 to March 2016 and from November 2017 until now. Notice how the S&P 500 traded flat during the first period and is basically flat now.
Palladium Continues Strong
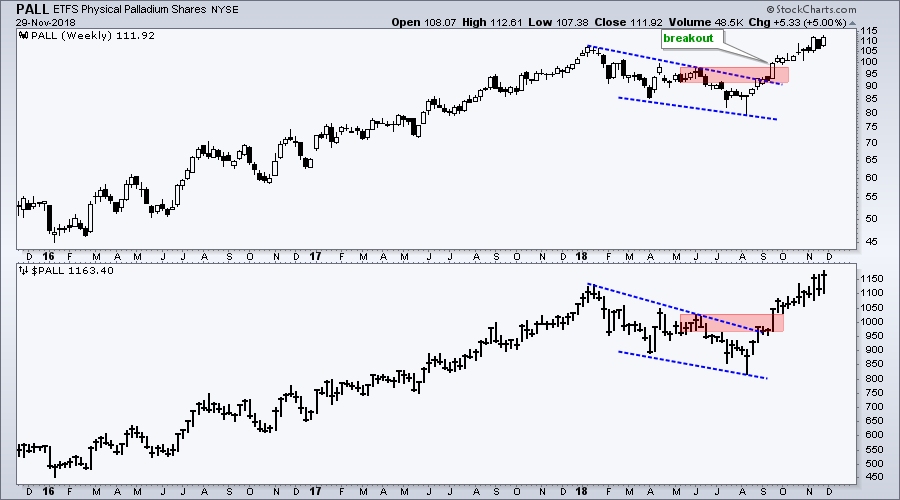
They say that there is always a bull market somewhere, even though I don't really know who "they" are. In any case, Palladium continues strong and hit another new high this week. The window shows the Palladium ETF (PALL) and the bottom window shows Palladium Continuous Futures ($PALL). Both ended their corrections with breakouts in September and hit new highs this week. Palladium was first featured in ChartWatchers on November 2nd.
Platinum Breaks Down
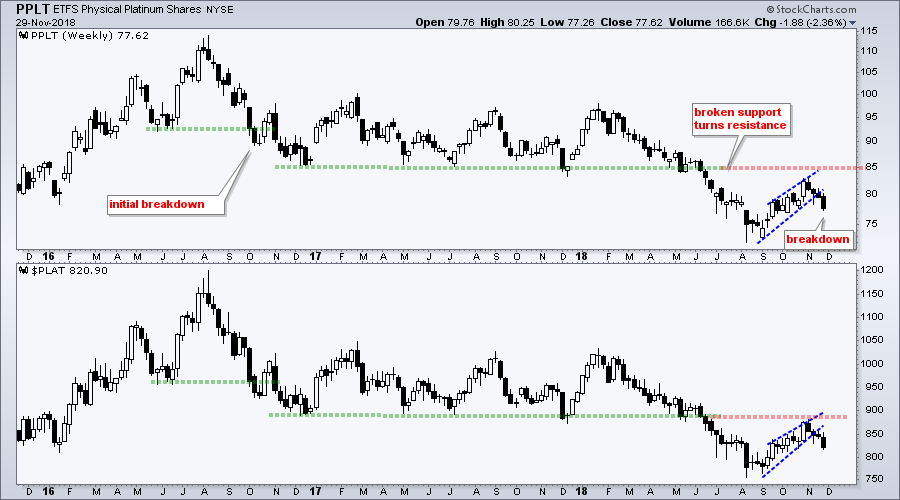
The next chart shows the Platinum ETF (PLAT) and Platinum Continuous Futures ($PLAT). PLAT broke down initially in October 2016 and then moved into a long trading range. The metal broke range support this summer and the support break turned resistance in October. PLAT broke wedge support the last few weeks and this signals a continuation lower.
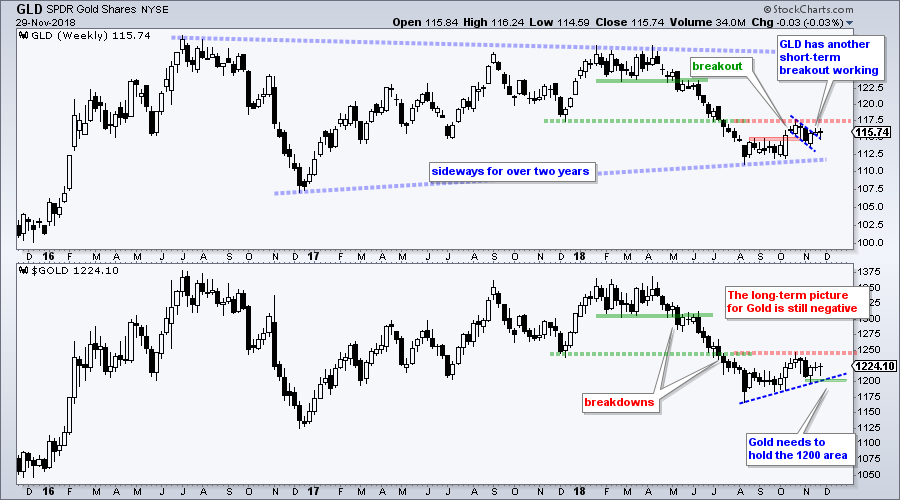
Gold Fights Downtrend and Strong Dollar
The US Dollar ETF (UUP) remains in an uptrend, while the Euro ETF (FXE) and Yen ETF (FXY) remain in downtrends. UUP broke out of a falling wedge in late September and worked its way higher the last nine weeks. The week-to-week moves seem small, but the Dollar continues to make upward progress. FXE has been trending lower since the April breakdown and hit a 52-week low earlier this month.
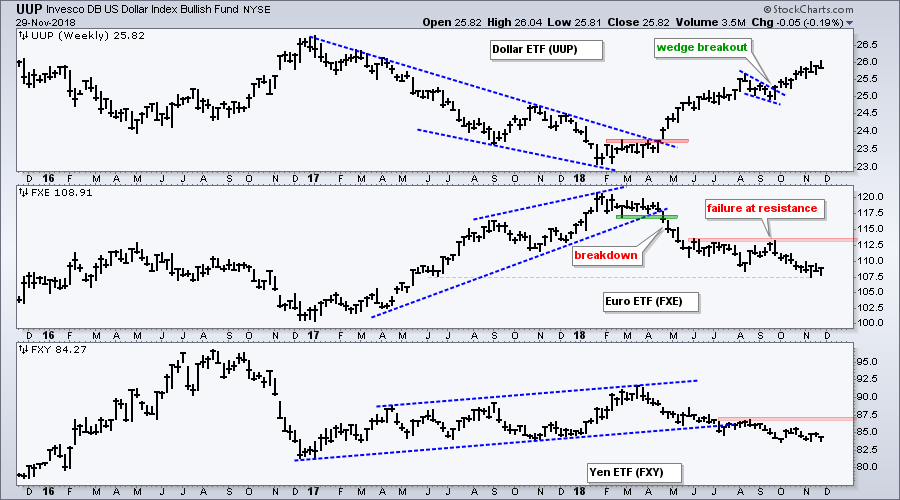
Assuming the Dollar is in an uptrend and gold is negatively correlated to the Dollar, it is hard to be bullish on bullion. Furthermore, the long-term chart for gold is negative with breakdowns in May and July. Nevertheless, hope springs as the yellow metal attempts a short-term breakout. Following a rules-based form of analysis, one would expect the bigger trend to prevail and the short-term breakout to fail. Thus, prepare for failure. The lower window shows Gold Continuous Futures edging higher the last few months and broken support turning into resistance. A break below 1190 would be quite negative and argue for new lows in gold.
Notes from the Art's Charts ChartList
- The Home Construction iShares (ITB) is holding up in November, but still in a long-term downtrend with a 52-week low in late October.
- The Retail SPDR (XRT) is lagging on the chart because it broke below its late October low this month.
- The Cloud Computing ETF (SKYY) and Cyber Security ETF (HACK) broke down and trading turned choppy, but falling wedges could be taking shape. Translation: Could go either way.
- The Semiconductor iShares (SOXX) and Semiconductor SPDR (XSD) are holding up in November, but don't forget that both recorded 52-week lows in October and neither chart sports a long-term uptrend.
- The Mortgage REIT ETF (REM) broke out in early November and held this breakout with a bounce the last five days.
- The Regional Bank SPDR (KRE) has a bullish pennant working, but, and this is a big BUT, the long-term trend is down and any bounce is still counter-trend.
- The REIT iShares (IYR) continues to hold up well and hit its highest level of the month on Thursday.
- The HealthCare Providers ETF (IHF) surged to the upper line of a bullish triangle consolidation and continues to show upside leadership.
- The Medical Devices ETF (IHI) broke out of a falling wedge.
- The Copper Miners ETF (COPX) has a short-term bullish wedge working and a breakout would trigger a counter-trend bounce. But the big trend is DOWN.
- Click here for the Art's Charts ChartList
Questions, Comments or Feedback?
I do not take symbol request and I cannot promise to response to all correspondence, but I will read it and take into under consideration. I greatly appreciate all feedback because it helps me improve the commentary and provides ideas for the future.

Plan Your Trade and Trade Your Plan.
- Arthur Hill, CMT
Senior Technical Analyst, StockCharts.com
Book: Define the Trend and Trade the Trend
Twitter: Follow @ArthurHill


