- Markets and News.
- S&P 500 Gets Oversold Bounce.
- %Above 200-day EMA Plunges.
- Range Change for %Above 20-day EMA.
- %Above 50-day EMA Forms Small Divergence.
 ... Markets and News
...Writing a market commentary before the election seems a bit foolhardy, but the election results do not figure into my analysis. As with any news event, the market's reaction to the news, whatever it might be, is what counts for chartist. Let's see the message from the market and then decide based on the charts.
Overall, I think the October decline was different than the decline in late January-early February. The October decline triggered bearish signals in key breadth indicators in mid October and the S&P 500 fell around 6% below its 200-day moving average, the most since January 2015.
My broad market stance is bearish and will remain bearish until the bulk of the evidence shifts back to the bulls, regardless of the election results. I do not know how long this signal will last and I certainly do not know the course the market will follow in the coming weeks. I simply set my lines in the sand and react when they are crossed. There will be whipsaws and bad signals along the way, but, hopefully, there will also be some good signals that catch some good trends.
S&P 500 Gets Oversold Bounce
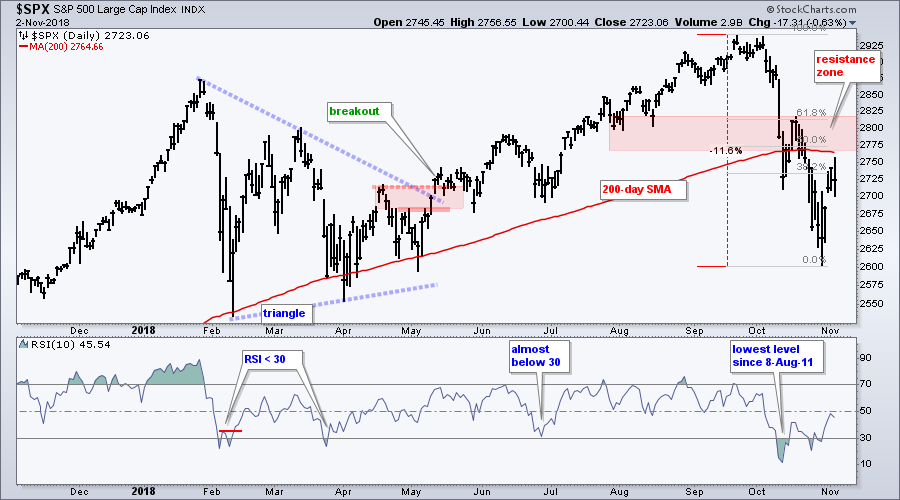
The chart below shows the S&P 500 breaking down in October and bouncing last week. This is the first bounce from a breakdown and an oversold condition. At this stage, it is just an overdue bounce and we have yet to see follow through. I am marking first resistance in the 2770-2820 area. The late July and early August lows, the slightly flattening 200-day SMA and the 50-61.8% retracement mark resistance here.
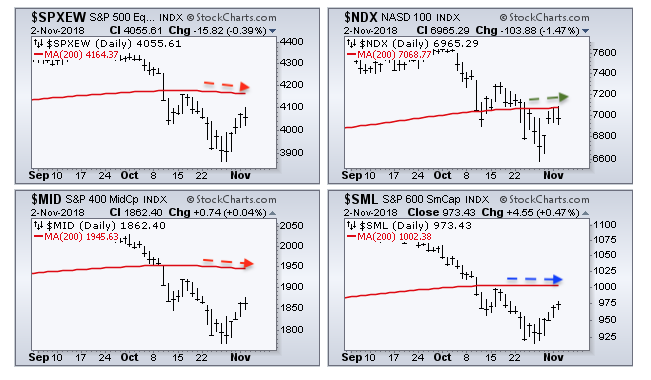
Note that the S&P 500 Equal-Weight Index ($SPXEW) and S&P Mid-Cap 400 are below the 200-day SMAs and their SMAs are turning down. The S&P Small-Cap 600 and Nasdaq 100 are also below their 200-day SMAs and their SMAs are flattening. It is hard to be bullish when all five major indexes are below their 200-day SMAs.
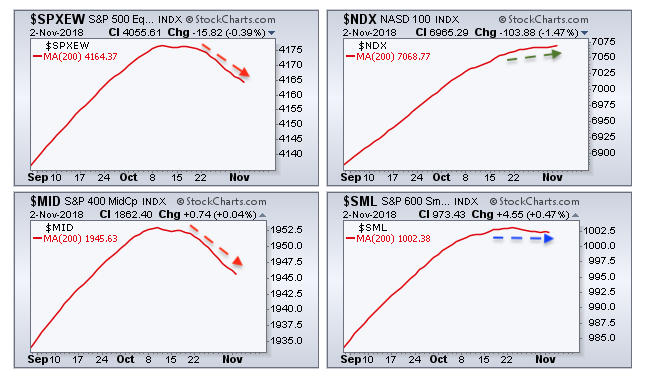
The next chart shows the bars as "invisible" so we can focus solely on movement in the 200-day SMA.
%Above 200-day EMA Plunges
StockCharts calculates and published the percentage of stocks of the 20-day, 50-day and 200-day EMA for several indexes and sectors. These symbols begin with !GT20 and end with the index or sector symbol (!GT20SPX). Click here for a list of symbols.
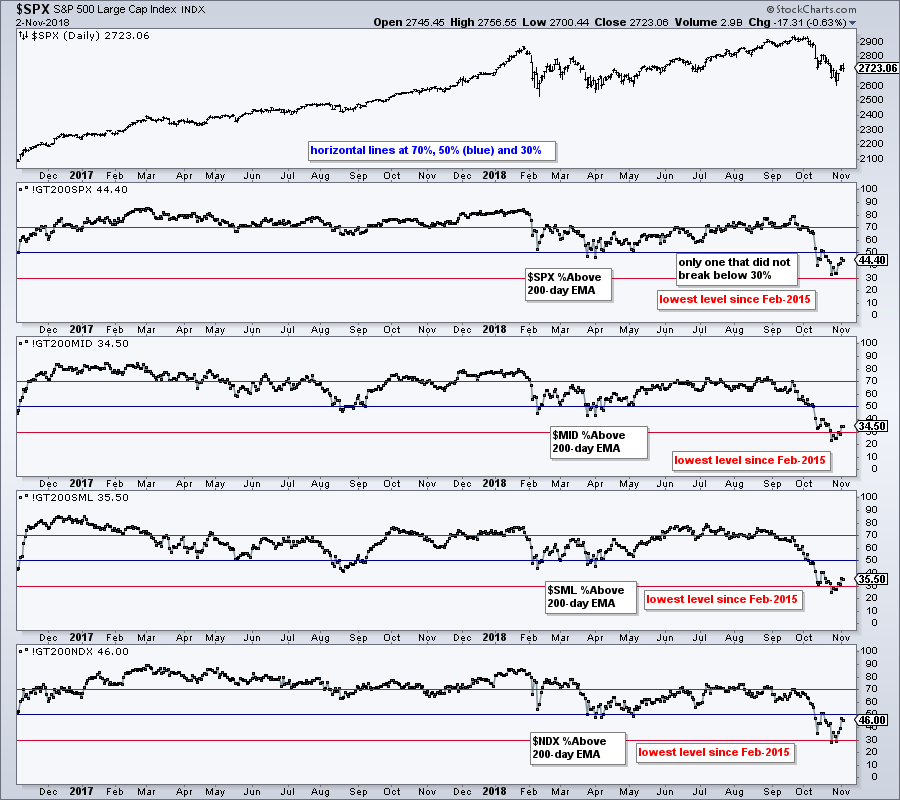
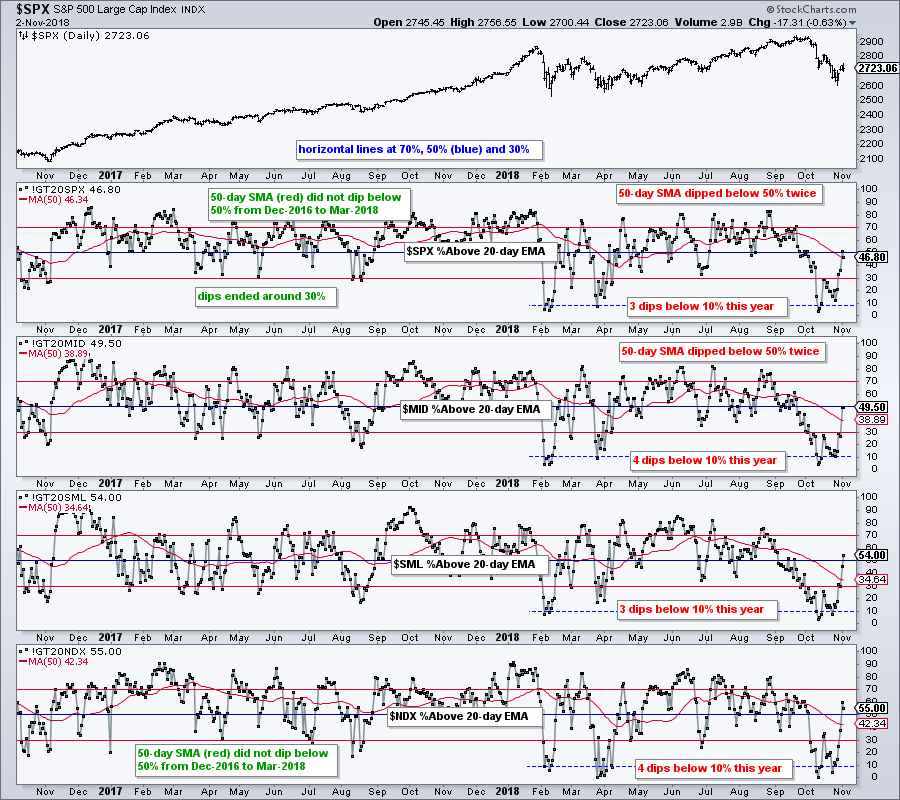
There are several ways to use this indicator and I will show three. First, we can use the %Above 200-day EMA to compare performance and rank the indexes. The chart below shows this indicator for the S&P 500, S&P Mid-Cap 400, S&P Small-Cap 600 and Nasdaq 100. The values are shown on the right side. 46% of Nasdaq 100 stocks and 44% of S&P 500 stocks are above their 200-day EMA, but around 35% of stocks in the S&P Small-Cap 600 and S&P Mid-Cap 400 are above their 200-day EMAs. Clearly, small-caps and mid-caps are lagging, while large-caps and large-techs are holding up better.
Range Change for %Above 20-day EMA
Second, chartists can use these indicators to identify range shifts. Notice that the S&P 500 %Above 20-day EMA (!GT20SPX) bottomed in the 30% area throughout 2017 and the 50-day SMA (red line) did not dip below 50%. This changed in 2018 as the indicator dipped below 10% at least three times and the 50-day SMA broke the 50% line twice. 2018 is clearly different from 2017.
%Above 50-day EMA Forms Small Divergence
The third method is to look for bullish divergences. Note that I usually do not use bearish divergences for these indicators (just a personal preference). Bullish divergences occur when the index forms a lower low and the indicator forms a higher low. The chart below shows S&P 500 %Above 50-day EMA (!GT50SPX) with bullish divergences in January-February 2016, March-April 2018 and October 2018. The higher low from August-September 2015 was not a divergence because the index also formed a higher low.
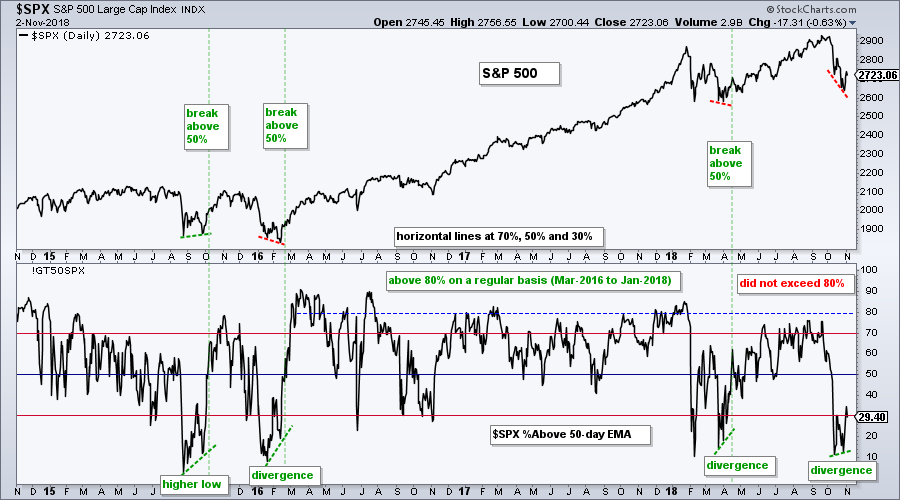
Overall, a deep dip in the %Above 50-day EMA indicator shows strong downside participation. A subsequent dip and higher low shows LESS downside participation (fewer stocks breaking below their 50-day EMA). This could lead to a near-term bottom with confirmation on a break above the 50% level. Currently, we can see a divergence from mid October to late October, but the indicator remains below 50%.
Plan Your Trade and Trade Your Plan.
- Arthur Hill, CMT
Senior Technical Analyst, StockCharts.com
Book: Define the Trend and Trade the Trend
Twitter: Follow @ArthurHill


