- Performance Overview.
- Ranging after Breakdown.
- Other Bearish Developments.
- Volatility Heats Up.
- Momentum versus Low Volatility.
- Staples and Utes Hold Up.
- Healthcare and REITs Outperform.
- Big Bounces within even Bigger Downtrends.
- Notes from the Art's Charts ChartList.
 ... Ranging after Breakdown
The S&P 500 was thrown off trend with a sharp decline in October. Looking back over the last four years, we can see that this is the fourth such decline and three are marked on the chart (red zones). I did not mark the January 2016 plunge because it occurred after the August 2015 plunge. I am just marking the initial plunges.
The S&P 500 was "On Trend" or in an uptrend prior to these initial plunges. These plunges threw the index off trend and it took time to recover. The index went nowhere for 40 weeks after the August 2015 plunge. After consolidated for 14 weeks after the Jan-Feb 2018 plunge. The index plunged for four weeks in October and has now stalled for 3 weeks. Looks like we are still in the early days.
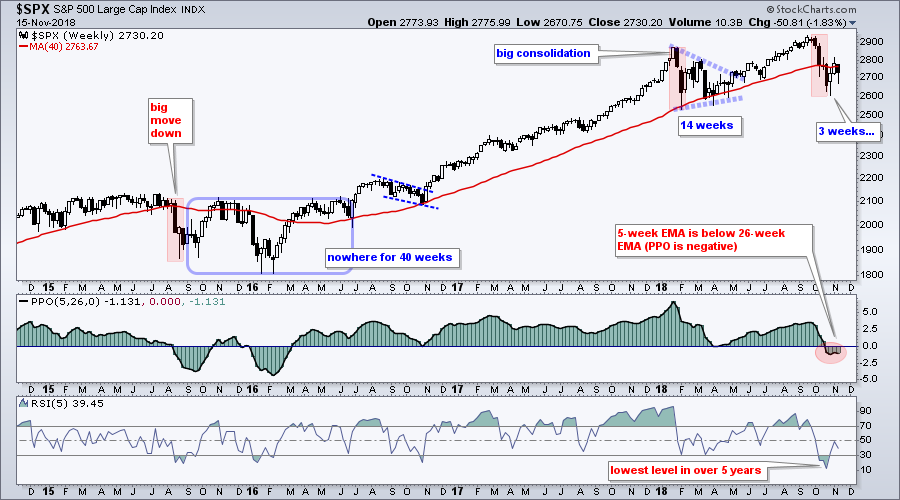
Nobody knows if we will see further weakness and a true bear market or if the market will simply trade in a volatile range. It does not really matter because it is hard to make money in bear markets and volatile ranges. Strong uptrends provide the best environment for making money and the S&P 500 is clearly NOT in a strong uptrend. At best, the index is simply ranging to digest the October breakdown and prepare for the next directional move.
Volatility Heats Up
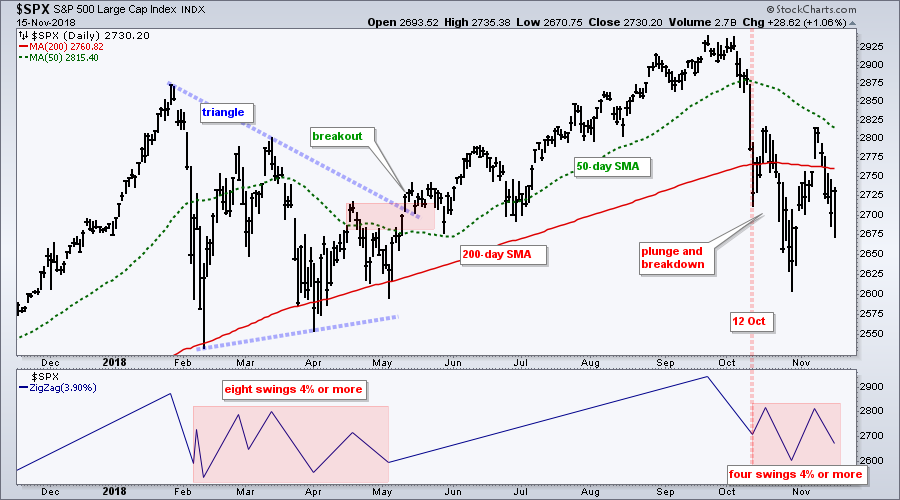
The next chart shows the S&P 500 with the breakdown date set on October 12th, which was a Friday. Since this breakdown, the index has experienced four swings of at least 3.9% (call it 4%). Note that there were eight swings of at least 4% from early February to early May. Thus, volatility is heating up and chartists need to consider this when trading. For those not content to sit on the sidelines, this means more risk, more whipsaw and smaller profits. Sometimes it is just best to let the dust settle.
Other Bearish Developments
- The breadth indicators turned net bearish on October 10th and remain net bearish.
- The 50-day SMAs moved below the 200-day SMAs for the S&P Mid-Cap 400, Russell 2000 and NY Composite. The 50-day SMAs remain above the 200-day SMAs for the S&P 500, Nasdaq 100, S&P Small-Cap 600, Dow Industrials and Nasdaq.
- The Dow Industrials is the only major index above its 200-day SMA as the S&P 500 fell back below its 200-day SMA this week.
- The S&P 500 High Beta ETF (SPHB) is underperforming the S&P 500 Low Volatility ETF (SPLV) and the S&P 500 High Quality ETF (SPHQ). This favors risk off.
- As noted in On Trend on Youtube, the weekly breadth indicators are also bearish.
Momentum versus Volatility
The Momentum Factor iShares (MTUM) and the Minimum Volatility iShares (USMV) can be used to assess the appetite for risk. MTUM has some 124 stocks with a 42% weighting in technology. USMV has over 200 stocks with a 19.37% weighting in technology. Healthcare, consumer staples and utilities also feature prominently in USMV.
The MTUM chart looks similar to the S&P 500 or Nasdaq 100 with a new high in September and sharp decline in October. The Minimum Volatility iShares (USMV) hit a new high in September and fell into October, but the decline was much less drastic. In addition, notice that USMV moved above its mid October high and has a stronger chart than MTUM.
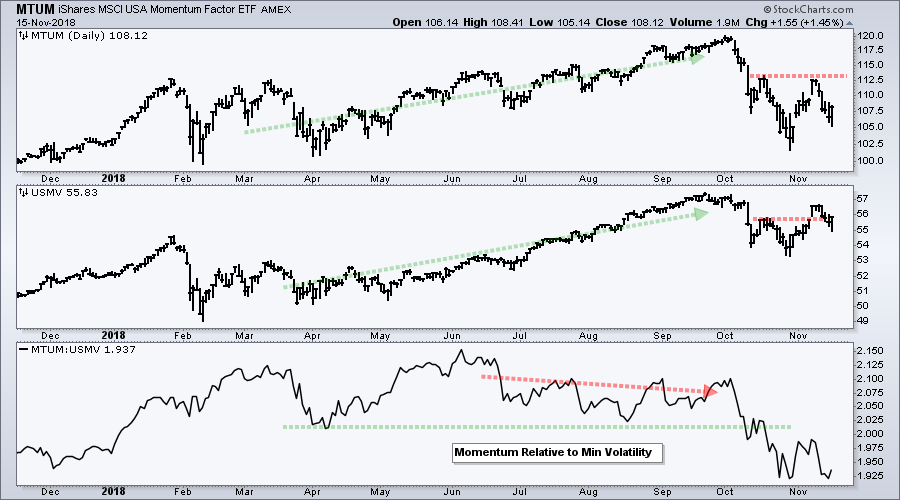
The indicator window shows the MTUM:USMV ratio peaking in June and breaking down in October. Clearly, momentum is out of favor and this means we are in a risk off environment.
Staples and Utes Hold Up
The Minimum Volatility iShares is holding up because the Consumer Staples SPDR (XLP) and the Utilities SPDR (XLU) are the only sectors holding up during the decline. The S&P 500 peaked on September 20th (40 days ago) and these are the only two sectors showing gains. The first chart shows unadjusted XLP (_XLP) setting a bear trap with a failed support break in mid October. The ETF then surged above the August-September highs and is up around 1% since the S&P 500 peaked.

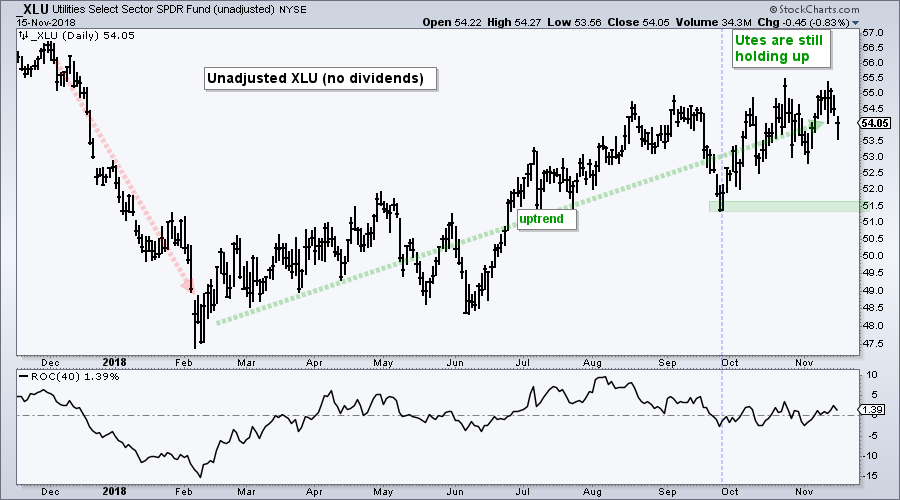
The next chart shows unadjusted XLU (_XLU) working its way higher since February with a series of higher highs and higher lows. The uptrend is quite choppy, but prices are clearly moving higher. The ETF is up around 1.4% since the S&P 500 peaked (40 days ago).
Healthcare and REITs Outperform
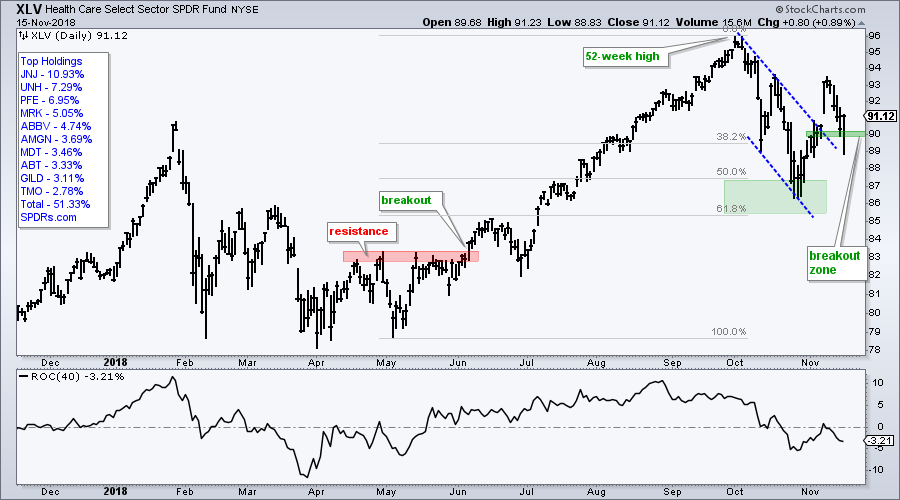
The Health Care SPDR (XLV) and the Real Estate SPDR (XLRE) are outperforming the S&P 500 over the last 40 days because they are down less than the S&P 500, which is down 6.84% since September 20th. The first chart shows XLV breaking out of a falling wedge in early November and falling back pretty hard this week. The ETF is testing the wedge breakout in the 90 area. The indicator window shows the 40-day Rate-of-Change at -3.21%, which means XLV is not immune to broad market weakness.
The next chart shows the unadjusted XLRE (_XLRE) falling rather sharply from September to mid October and then rebounding with a break above the October highs. Unadjusted XLRE is still down 1.5% since the S&P 500 peaked, but it is performing quite well since mid October and clearly leading during market turmoil.
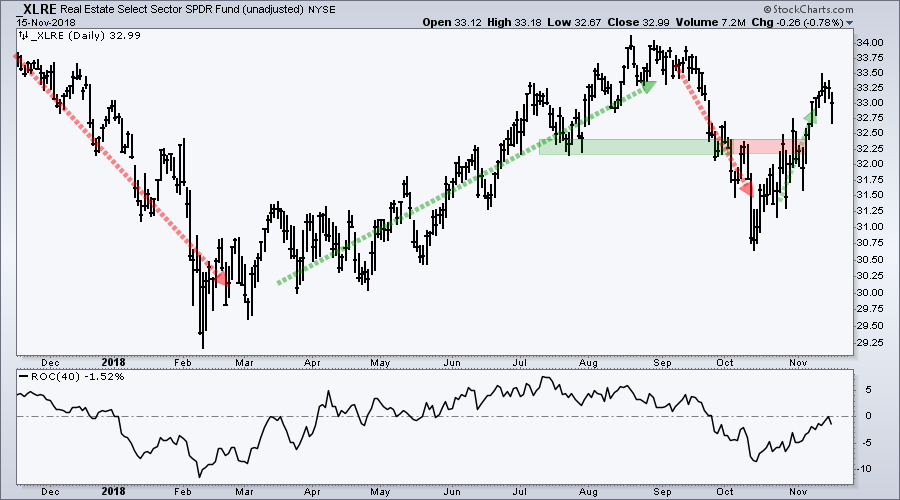
Note that I am showing unadjusted prices for XLU, XLRE and XLP because I want to focus on price action. Chartists can see unadjusted data by preceding the symbol with an underscore (_XLU).
Big Bounces within even Bigger Downtrends
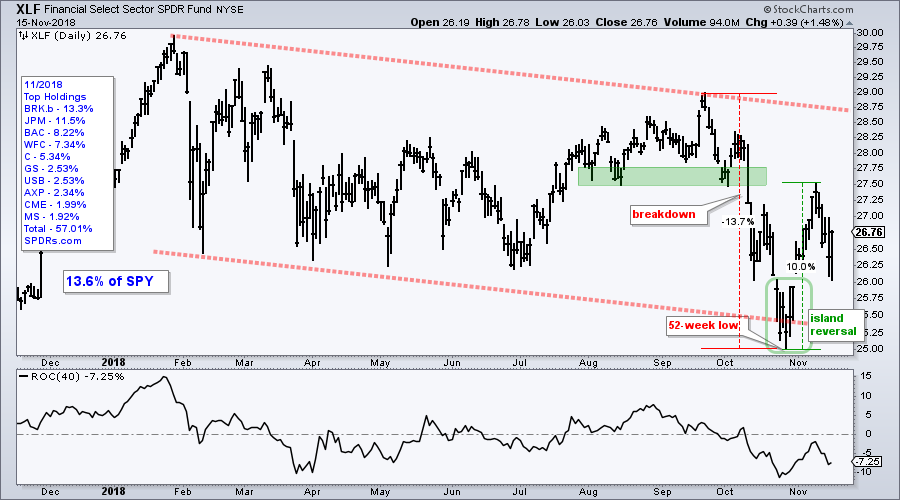
We saw some mighty big bounces from late October to early November, but the biggest moves often came from the weakest names. The first chart shows the Finance SPDR (XLF) with a big downtrend since January and a new low in October. The ETF fell over 13% from late September to early October and then rebounded with a 10% move to 27.5 on November 8th. While the island reversal and rebound are impressive from a short-term standpoint, they are still within a bigger downtrend. XLF is still down over 7% since the S&P 500 peaked (40 days ago).
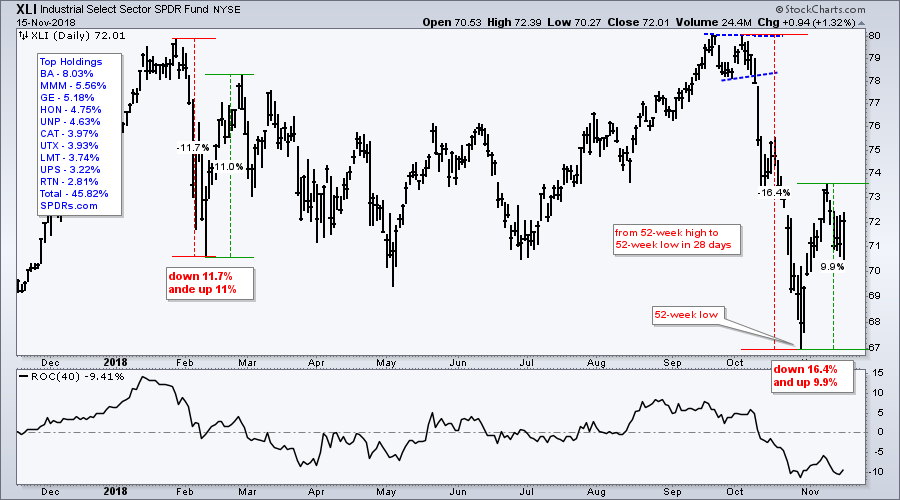
The next chart shows the Industrials SPDR (XLI) moving from a 52-week high to a 52-week low in less than six weeks. Wow. The ETF fell some 16% and then rebounded with a 9+ percent gain. Again, this gain is impressive when seen over the last three weeks, but not impressive when viewed over the past year or past two months. Note that XLI fell some 11.7% in early 2018 and then rebounded with a double digit bounce - which did not last.
Notes from the Art's Charts ChartList
- The Retail SPDR (XRT) bounce failed near the 61.8% retracement and the ETF is testing the October low.
- The Cloud Computing ETF (SKYY), Cyber Security ETF (HACK) and Internet ETF (FDN) broke down in October and turned volatile the last few weeks. We could see choppy consolidations as they digest their breakdowns.
- The Semiconductor iShares (SOXX) and Semiconductor SPDR (XSD) hit 52-week lows in late October and bounced violently the last two weeks.
- The Regional Bank SPDR (KRE) and Broker-Dealer iShares (IAI) got big bounces in November, but these bounces are still within bigger downtrends.
- The Aerospace & Defense iShares (ITA) bounced back to the middle of its one year range (no trend here).
- The Airline ETF (JETS) is showing some relative strength with a breakout in early November and a strong showing the last six days.
- The Transport iShares (IYT) is back in the middle of its one year range (no trend).
- The Biotech iShares (IBB) is testing the spring lows, while the Biotech SPDR (XBI) broke to new lows this weak.
- The HealthCare Providers ETF (IHF) is testing its wedge breakout after a pullback.
- The Medical Devices ETF (IHI) fell back below its breakout zone, but closed strong on Thursday.
Questions, Comments or Feedback?
I do not take symbol request and I cannot promise to response to all correspondence, but I will read it and take into under consideration. I greatly appreciate all feedback because it helps me improve the commentary and provides ideas for the future.

Plan Your Trade and Trade Your Plan.
- Arthur Hill, CMT
Senior Technical Analyst, StockCharts.com
Book: Define the Trend and Trade the Trend
Twitter: Follow @ArthurHill


