 ... Today's show, On Trend, provides a review of 2018, which is the year of few winners (so far). With less than two weeks before yearend, I would not expect too much to change. The show starts with seven PerfCharts to focus on seven different groups around the globe. These include asset class ETFs, international indexes, commodities, currencies and US stocks. Today's commentary shows these charts with links and symbols that chartists can use going forward.
The first chart shows 12 different ETFs covering different asset classes. It is lopsided toward the US because there are five "assets" based on US stocks. The Russell 2000 (blue) is down three times more than the S&P 500 SPDR (red). SPY and IWM include dividends and this is total return data. Even though stocks are down, the 20+ YR T-Bond ETF (TLT) and the 7-10 YR T-Bond ETF (IEF) are also down, which is rather unusual.
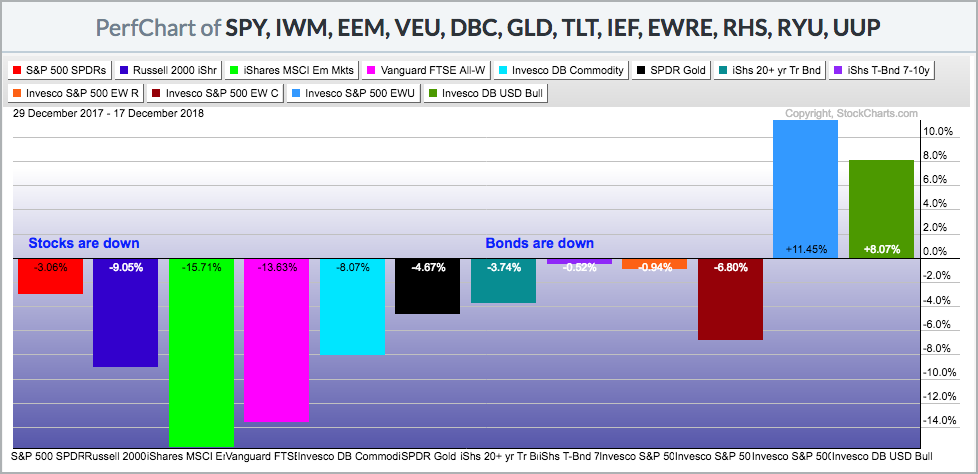
Asset Class ETFs:
SPY,IWM,EEM,VEU,DBC,GLD,TLT,IEF,EWRE,RHS,RYU,UUP
The next chart shows 12 international indexes with ten down and two up. The Russian Trading System Index ($RTSI) and S&P 500 (without dividends) are down the least, while the German DAX Index ($DAX) and Shanghai Composite ($SSEC) are down the most. The Bovespa ($BVSP) and India Nifty 50 Index ($NIFTY) are bucking the selling pressure this year.
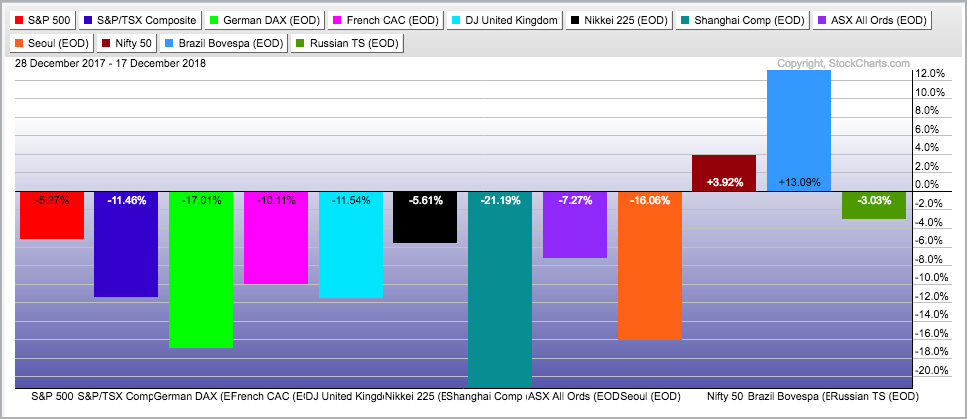
Global Stock Indexes:
$SPX,$TSX,$DAX,$CAC,$GBDOW,$NIKK,$SSEC,$AORD,$KOSPI,$NIFTY,$BVSP,$RTSI
The US Dollar ETF (UUP) is the king of the currency ETFs in 2018, and the only gainer.
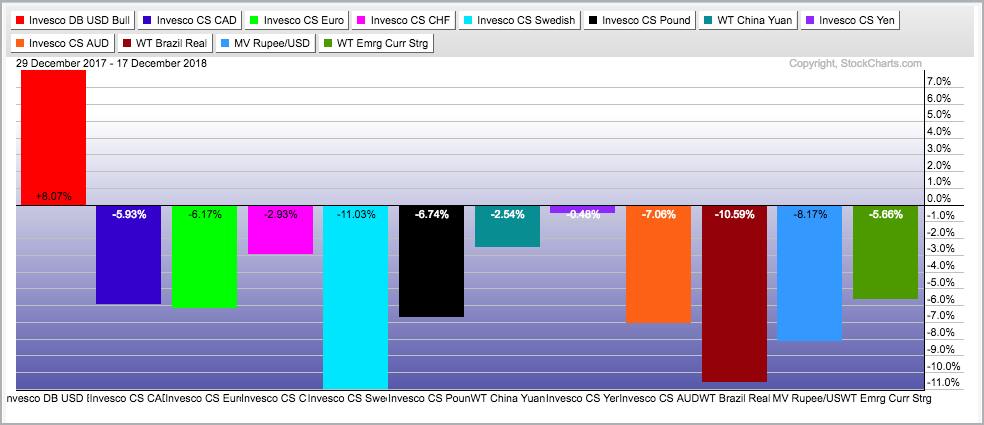
Currency ETFs:
UUP,FXC,FXE,FXF,FXS,FXB,CYB,FXY,FXA,BZF,INR,CEW
All seven Bloomberg commodity groups are down year-to-date.
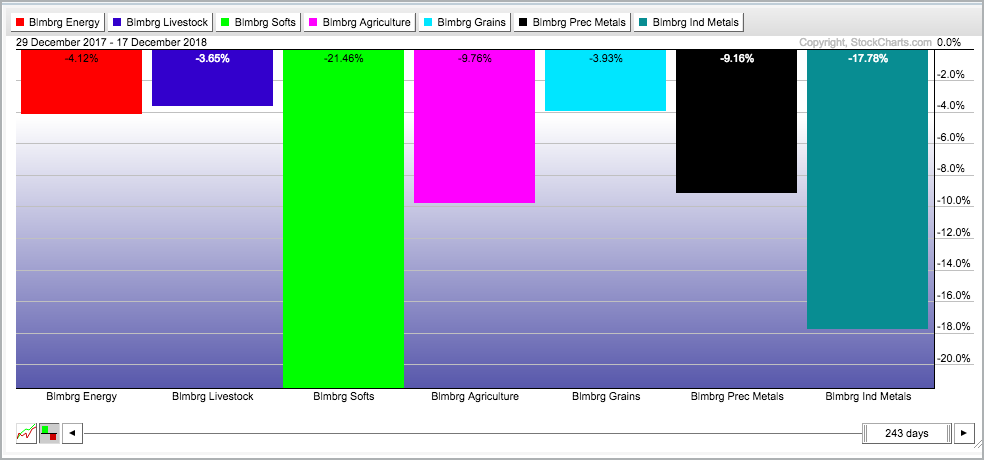
Commodity Group Indexes:
$BCOMEN,$BCOMLI,$BCOMSO,$BCOMAG,$BCOMGR,$BCOMPR,$BCOMIN
Performance improves when looking at individual commodities. Palladium, natural gas, wheat and corn are up this year. Meanwhile, copper, platinum, oil and lumber are down sharply.
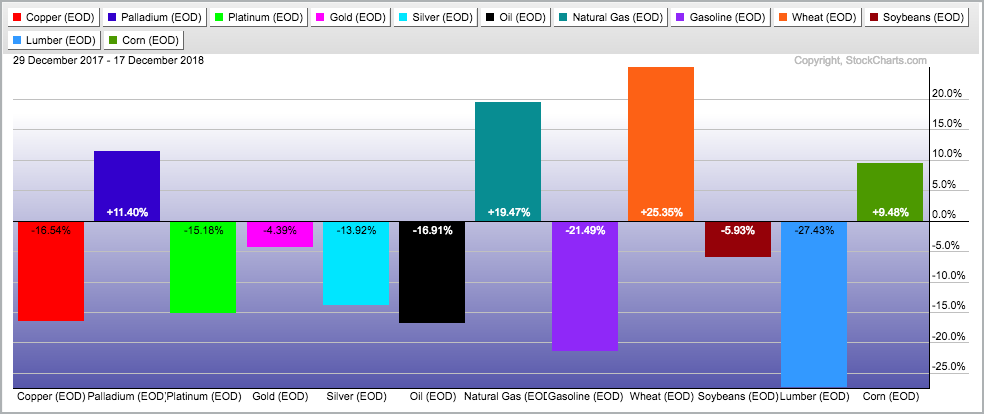
$COPPER,$PALL,$PLAT,$GOLD,$SILVER,$WTIC,$NATGAS,$WHEAT,$SOYB,$LUMBER,$CORN,$GASO
The Nasdaq 100 ETF (QQQ) is the only one of the major index ETFs showing a year-to-date gain.
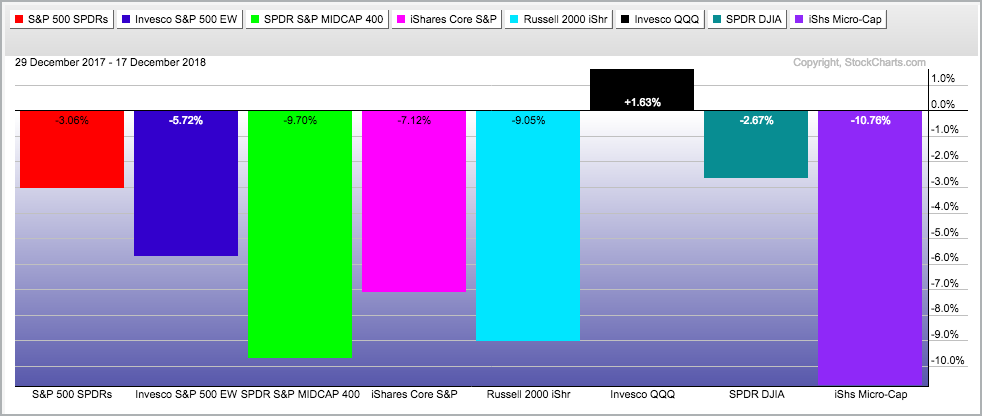
Major index ETFs:
SPY,RSP,MDY,IJR,IWM,QQQ,DIA,IWC
The EW Utilities ETF (burgundy) is the big winner among the equal-weight sectors. The EW Technology ETF (magenta) and the EW Healthcare ETF (purple) are still holding up with small gains this year. The EW Finance ETF (green), EW Industrials ETF (light blue), EW Materials ETF (black) and EW Energy ETF (teal) are down double digits year-to-date.
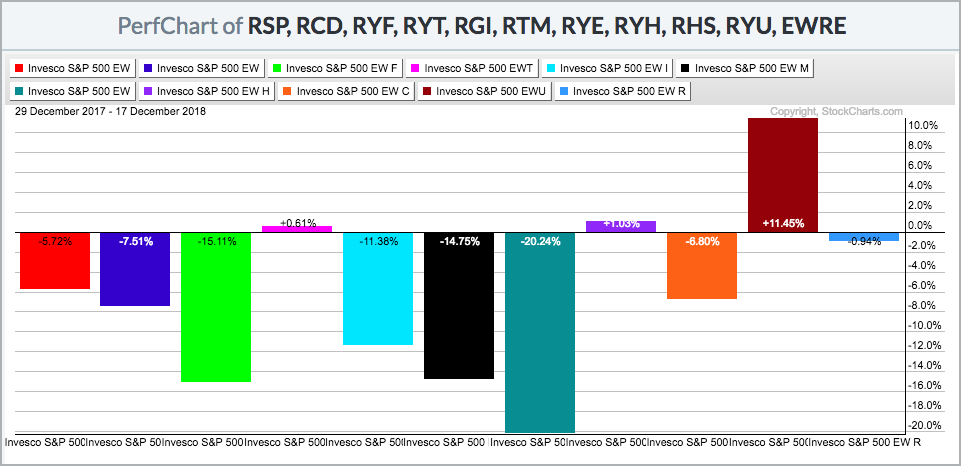
Equal-weight Sector ETFs:
RSP,RCD,RYF,RYT,RGI,RTM,RYE,RYH,RHS,RYU,EWRE
On Trend on Youtube
Topics for Tuesday, December 18th:
- Global Asset Overview with 7 PerfChart Groups
- New High to New Low in a Short Period
- Expansion of New Lows from October to December
- Underperformers Throughout 2018
- Three Themes Affecting the Financial Markets
- Click here to Watch
Senior Technical Analyst, StockCharts.com
Book: Define the Trend and Trade the Trend
Twitter: Follow @ArthurHill
