- Setting the Stage.
- Defining Trend and Condition.
- Running the Scan.
- Uptrends versus Downtrends.
- Overbought versus Oversold.
- Uptrend and Oversold.
- Uptrend and Mildly Oversold.
- Scanning for RSI Ranges.
- Conclusions.
 ... Setting the Stage
... Instead of testing an actual system, this System Trader article will show scatter plots for S&P 500 stocks with uptrends/downtrends and overbought/oversold levels. Around two thirds of S&P 500 stocks are in downtrends and a little more than one third are oversold. I will also cross reference these variables to show stocks that are oversold in uptrends. Overall, the S&P 500 is in a downtrend and I remain bearish on the market. However, over one hundred stocks are oversold and this could give way to a counter-trend bounce.
Bear markets provide good conditions to sharpen the saw because exposure to stocks drops significantly, at least in my account. Anyone who has read Stephen Covey's classic, The 7 Habits of Highly Effective People, will be familiar with this term. Bear markets are a good time to sharpen our analysis skills, hone our strategies and prepare for the next bull run.
Defining Trend and Condition
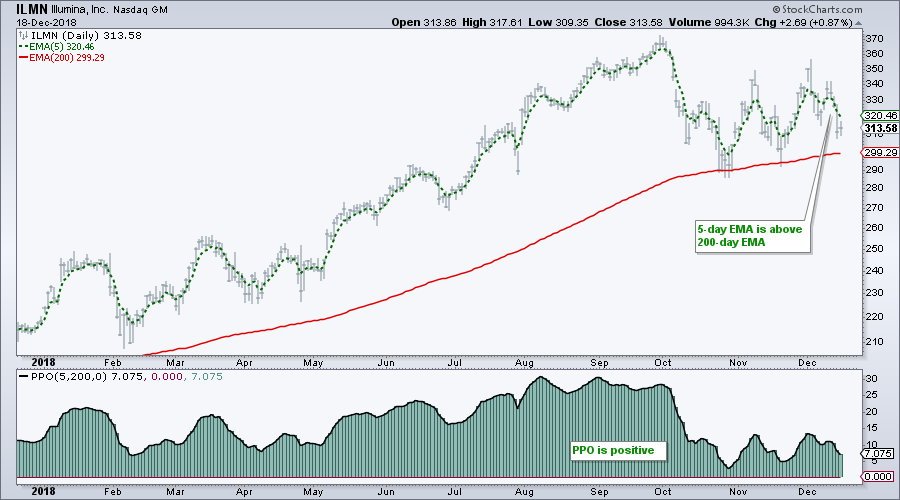
I am using the Percentage Price Oscillator (5,200,1) to define the long-term trend. This indicator measures the difference between the 5-day EMA and the 200-day EMA. The trend is up when the PPO is positive and down when the PPO is negative. The chart below shows Ilumina (ILMN) with the 5-day EMA in green, the 200-day EMA in red and the PPO in the indicator window. Note that the PPO setting is (5,200,0) to show the indicator as a histogram.
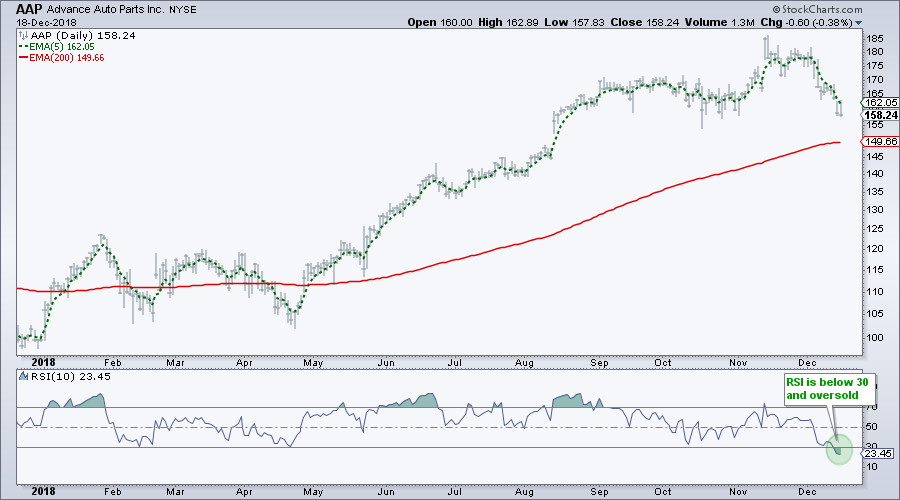
I am using 10-day RSI to define overbought and oversold conditions. I chose 10-day instead of 14-day because the shorter lookback period makes the indicator more sensitive. 10-day RSI to move above 70 and below 30 more often than 14-day RSI. The chart below shows Advance Auto Parts (AAP) with RSI moving below 30 over the last few days.
Running the Scan
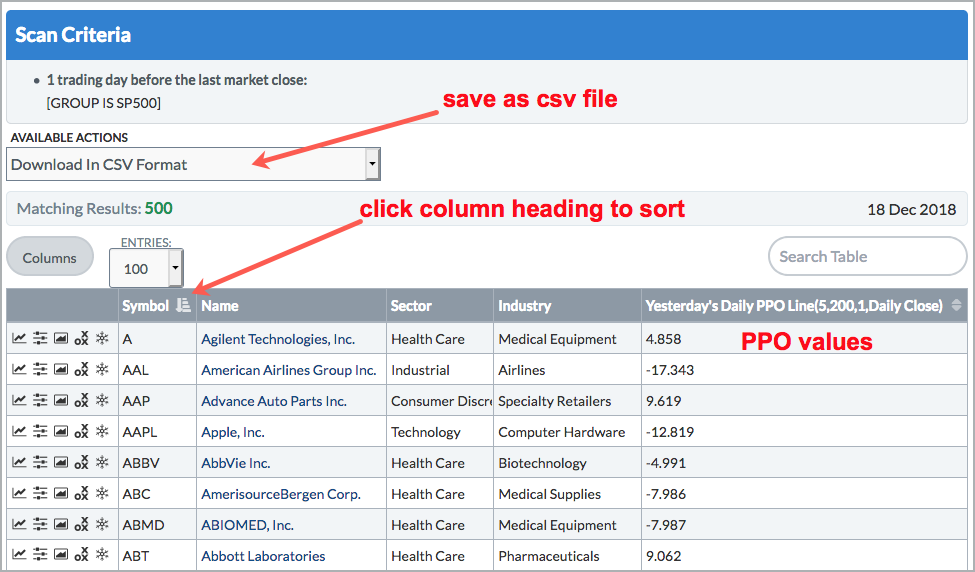
Chartists can use the StockCharts Advanced Scan workbench to generate indicator values and save them to a csv file. The initial scan code is super simple. The group is the S&P 500 and I want to rank the results by the indicator. The line "rank by RSI(10) is not in use because it is preceded by two forward slashes (//). Only one rank is allowed and this scan ranks by the PPO value.
[group is SP500]
//rank by RSI(10)
rank by PPO Line(5,200,1)
The image below shows the results sorted by symbol. Note that I wanted all 500 stocks with the indicator values in the results. I sorted by symbol because I am copying these results to an excel spreadsheet to create the scatter plot. I am not going to go into the production details at this time. Chartists looking for some holiday distractions can always read up on StockCharts scans and watch some excel tutorials to learn how.
Uptrends versus Downtrends
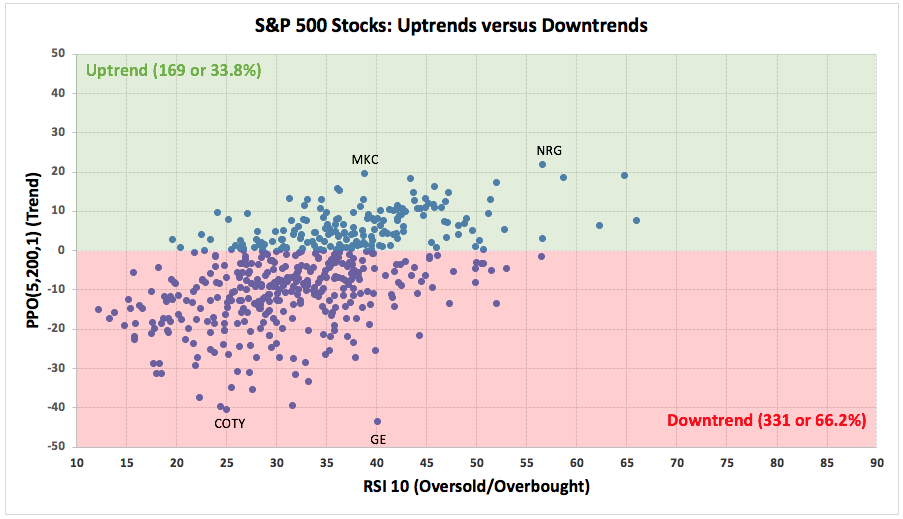
The following scatter plots are based on data from Monday's close (17-Dec), which is when stocks were the most oversold. The PPO values are on the y-axis and the RSI values are on the x-axis. Note that the Relative Rotation Graph (RRG) also uses a scatter plot. This first scatter plot focuses on the PPO values, which range from -50% to +50%. A PPO value of -40 means the 5-day EMA is 40% below the 200-day EMA. Thus, the further below the centerline, the stronger the downtrend. There are 331 stocks in downtrends (red zone) and 169 stocks in uptrends (green zone). GE (43.14%) and COTY (-40.46%) have the lowest PPO values, while MKC (19.74%) and NRG (21.94%) have the highest PPO values.
Overbought versus Oversold
The next scatter plot focuses on the RSI values, which range from 10 to 90. The green shading covers RSI values below 30 (oversold) and the red shading covers RSI values above 70 (overbought). Note that RSI is below 30 (oversold) for a whopping 186 stocks (37.2%). While I have yet to compare this number historically and run any backtests, this BIG number sets the stage for an oversold bounce. On the flipside, notice that no stocks have an RSI value above 70 and only one has an RSI value above 65 (Broadcom - AVGO). Thus, AVGO is holding up quite well over the last two weeks.
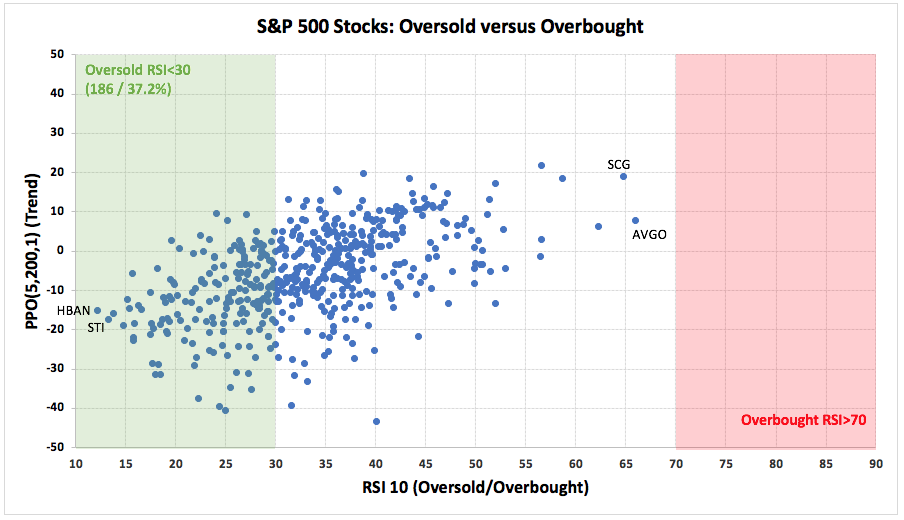
The market is extremely oversold overall and poised for a bounce. The stocks that held up the best are not always the ones to lead a bounce, but they certainly have better looking price charts. The finance sector dominates the oversold list with 51 stocks having RSI values below 30 (out of 186 total). My best guess is that these beaten down stocks would lead an oversold bounce because their rubber band has been stretched the furthest. There are 18 stocks in the finance sector with RSI values below 20, including GS, USB, C, WFC and DFS.
Uptrend and Oversold
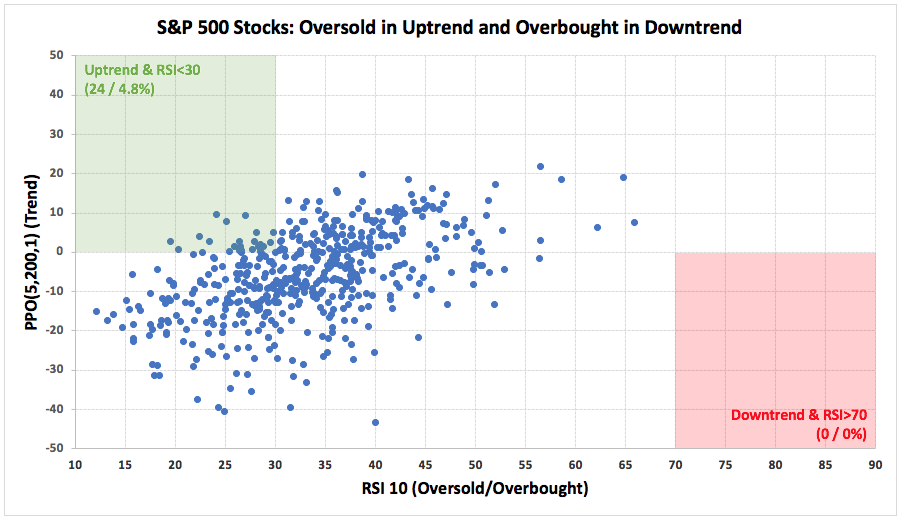
The next scatter plot focuses on two groups: stocks with uptrends and oversold RSI, and stocks with downtrends and overbought RSI. Well, it is actually one group because there are no stocks in the latter group. There are 24 stocks with uptrends and oversold RSI. Here is a symbol list: AAP ,ADP ,AJG ,ALLE ,AON ,CMG ,CNC ,COST ,CSX ,CVS ,FL ,HCA ,HSIC ,IR ,IT ,JNJ ,MMC ,MOS ,ROL ,UHS ,VRSK ,WBA ,WMT ,ZTS.
Uptrend and Mildly Oversold
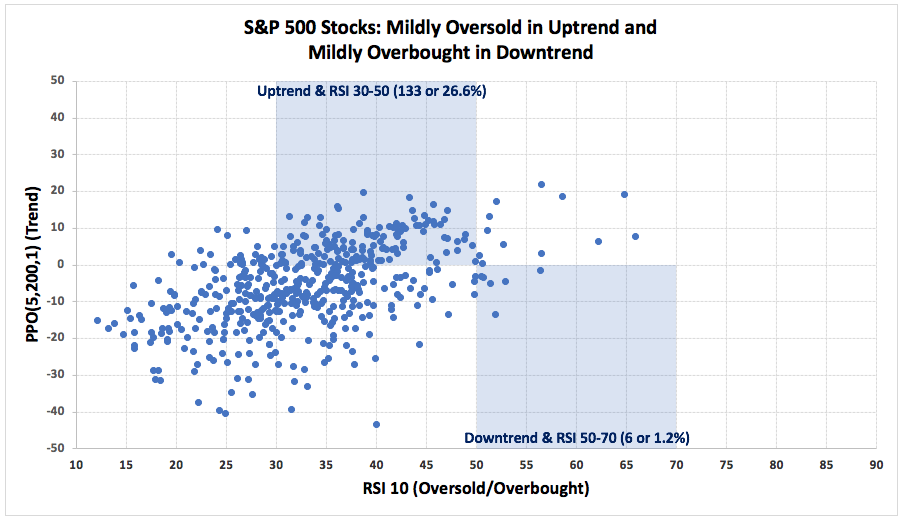
There is another group that I would like to highlight. These stocks are still in uptrends and "mildly oversold". This means the PPO is positive and RSI is between 30 and 50. RSI has dipped below 50 and this is the area where RSI sometimes bounces when the bigger trend is up. Of the 169 stocks in uptrends, 133 have RSI values between 30 and 50. This means price dipped over the last two weeks, but not enough to push RSI below 30 (truly oversold). Put another way, they showed a little relative strength because their RSI readings are higher than average. For reference, RSI for SPY dipped to 27.85 on Monday's close and the average RSI reading for all 500 stocks was 33.23. Chartists interested in type of setups can use the scan code below.
Scanning for RSI Ranges
The scan code below will find stocks with a positive PPO(5,200,1) and RSI values between 30 and 50. The results will be ranked by the RSI value with the highest at the top.
[group is SP500]
and [PPO Line(5,200,1) > 0] // stock is in uptrend
and [RSI(10) > 30] // RSI is above 30
and [RSI(10) < 50] // RSI is below 50rank by RSI(10) // rank by RSI values
Conclusions
Even though it is not the best environment for trading, long or short, chartists can remain active by catching up on reading, developing new techniques and fine-tuning their strategies. The scatter plots provide a nice visual for stocks in uptrends versus downtrends and stocks with overbought RSI and oversold RSI. These plots provide good information on the state of the stock market. In the future, I would like to know what these scatter charts looked like in different market environments and with different indexes or even sectors. In addition, I will experiment with different indicators and the slope of the linear regression. This is for later in 2019.
Questions, Comments or Feedback?
I do not take symbol request and I cannot promise to response to all correspondence, but I will read it and take into under consideration. I greatly appreciate all feedback because it helps me improve the commentary and provides ideas for the future.

Plan Your Trade and Trade Your Plan.
- Arthur Hill, CMT
Senior Technical Analyst, StockCharts.com
Book: Define the Trend and Trade the Trend
Twitter: Follow @ArthurHill


