- A Clear Signal on the Monthly Chart.
- Oversold is a Double-Edged Sword.
- Getting to Washout Levels (High-Low Percent).
- Quarterly Rate-of-Change Signals a Shift.
- VIX has Yet to Spike.
- Futuristic Food for Thought.
- Notes from the Art's Charts ChartList.
 ... A Clear Signal on the Monthly Chart ...
Even though we still have some days to go before the monthly bar is complete, I would like to end this year's commentary with a monthly chart for the S&P 500. This twenty year chart puts things into perspective and shows the magnitude of the recent breakdown. Barring a monster rally in the next six trading days, this chart will likely finish with a significant bearish reversal signal in place.
The chart below shows the 12-month SMA with 3-month RSI used to confirm signals. Moving average crosses are prone to whipsaws and I am always looking for a method to reduce whipsaws. We cannot completely eliminate whipsaws. A bull signal occurs when the index closes above the 12-month SMA and RSI (3) exceeds 70. The moving average cross reflects an upturn in prices and an RSI move above 70 shows strong 3-month momentum. A bear signal occurs when the index closes below the 12-month SMA and RSI(3) moves below 30.
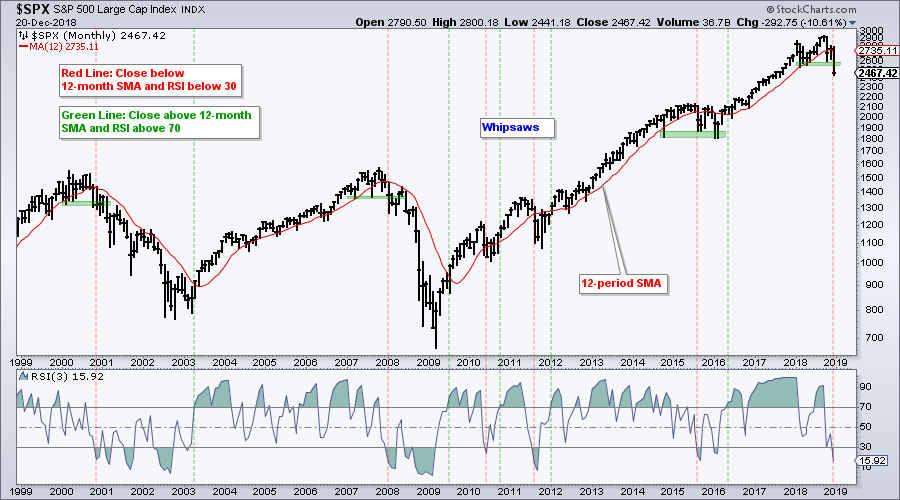 Currently, the index moved below the 12-month SMA at the beginning of the month and it would take an advance of around 11% to reclaim this cross. Monthly RSI(3) moved below 30 on December 7th when the index fell from 2696 to 2633. With a current close at 2467, it would take an advance of around 9% to push RSI back above 30. Thus, it would take a big advance to undo the long-term bearish signal we are currently seeing.
The green zones on the chart mark support levels that were broken in early 2001, early 2008 and December 2018. This break ushered in multi-month lows and lower lows. Technically, it is the lower low that signals the start of a downtrend. Thus, the bulk of the long-term evidence on this chart is bearish and will remain so until proven otherwise. This means bear market rules apply. Exposure to stocks, if any, should be limited. There will be counter-trend bounces, but bearish setups will work better than bullish setups.
Nobody knows how long this signal will last or how far this downtrend will extend. It will end when the signal reverses - and not a moment sooner.
Note that I will be off next week and the next commentary will be in 2019. On behalf of all of us at StockCharts, I wish you a very Merry Christmas and a happy New Year! Happy holidays!!

Oversold is a Double-Edged Sword
Even though the market is oversold on several metrics, chartists should keep in mind that oversold is a double-edged sword. First and foremost, it takes strong selling pressure for the market to become oversold. In trend-following terms, such strong selling pressure is more indicative of a downtrend than an uptrend. Thus, oversold readings show strong downside momentum that usually occur in downtrends.
On the flipside, oversold conditions suggest that the market is ripe for a bounce. Timing such a bounce, however, is another ball game. Keep in mind that the stock market became overbought and remained overbought throughout much of 2017, which was a year with a strong uptrend. On the downside, the market can become oversold and remain oversold in a strong downtrend.
In Wednesday's System Trader article, I showed that 169 stocks in the S&P 500 (33.8%) were trading with their 5-day EMAs above their 200-day EMAs (PPO(5,200,1) was positive). This number dropped to 110 (22%) as of Thursday's close. There were 186 stocks (37.2%) with 10-day RSI below 30 as of Monday's close. This number expanded to 299 (59.8%) by Thursday's close.
The chart below shows the S&P 500 with 14-day RSI and the number of stocks with RSI(14) below 30 at different dates. 14 is the default setting for RSI and 14-day RSI is less sensitive than 10-day RSI. There are currently 205 stocks with RSI(14) below 30. Thus, 41% of the S&P 500 is oversold according to default RSI. Using the double edged sword analogy, one could also assume that 41% show strong downside momentum that usually occurs in downtrends.
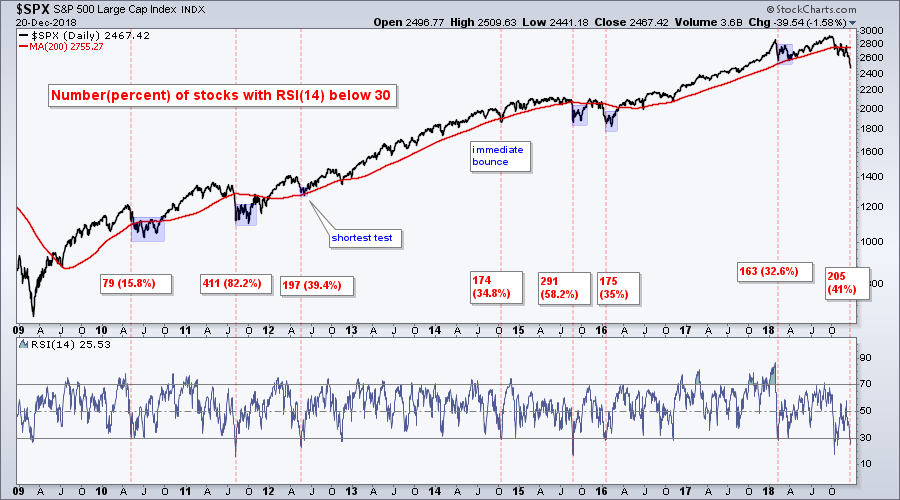
The blue shaded areas show price action after the red lines, which is when stocks in the S&P 500 were broadly oversold. After such oversold conditions, there is often a consolidation period that includes a bounce and a retest of the low. Sometimes there is a lower low and sometimes there is a higher low.
Note that I am not expecting a major bottom to form because the bulk of the evidence remains bearish. A bottoming process is possible, but talking about one at this point is irrelevant. There is serious technical damage when 41% of stocks in the S&P 500 become oversold. While bearish, this condition paves the way for a bounce or consolidation in the near future.
Getting to Washout Levels (High-Low Percent)
The next chart shows the High-Low Percent indicators for the S&P 500, S&P Mid-Cap 400 and S&P Small-Cap 600. This indicator group turns bullish when two of the three move above 10% and bearish when two of the three move below -10%. The green and red lines show the signals over the last eight years and the most recent signal was bearish (mid October). In fact, all nine breadth indicators turned bearish in mid October.
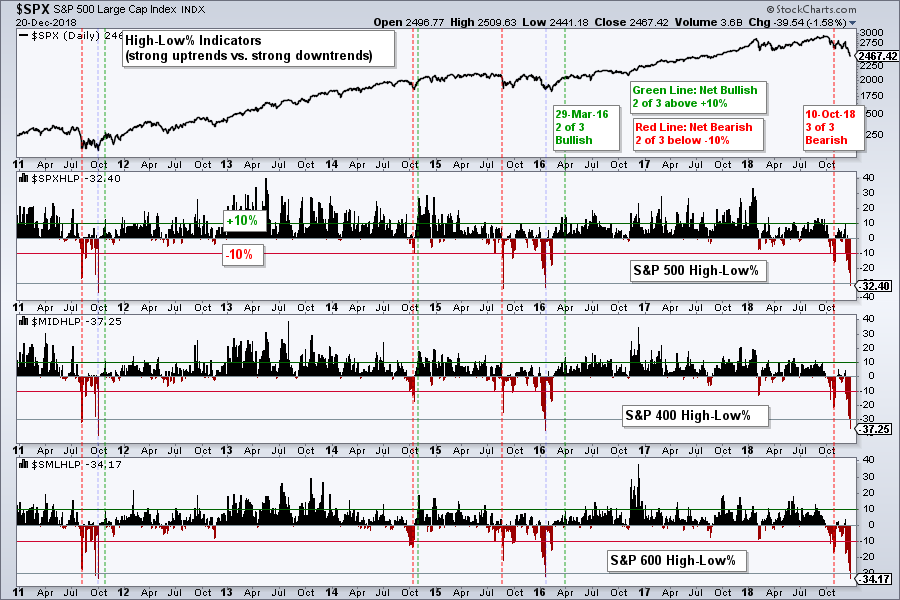
Even though the current signal is bearish, notice that High-Low Percent exceeded -30% for all three this week. This last occurred in January 2016 and October 2011 (light blue lines). Two priors is not enough to base a signal, but this tells us that conditions are at an extreme that could signal a washout of some sort (throwing out the baby with the bath water). This washout could also pave the way for a bounce, but not a major trend reversal.
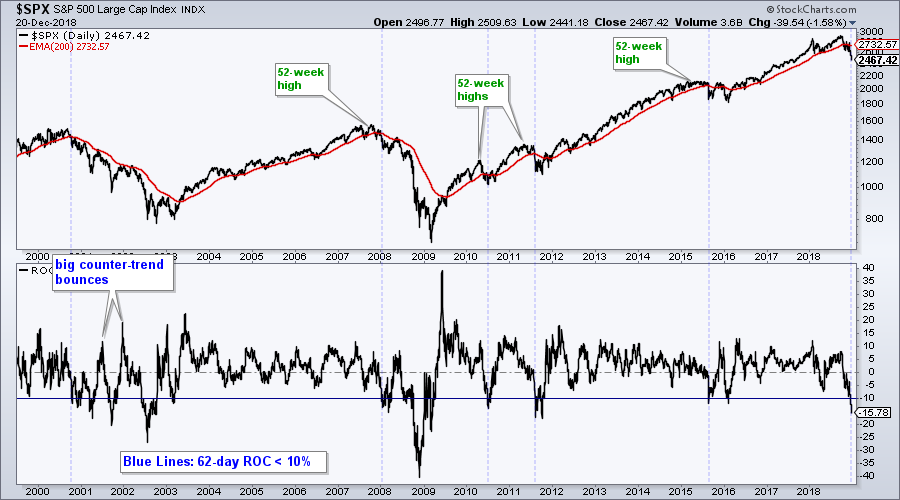
Quarterly Rate-of-Change Signals a Shift
The next chart shows the S&P 500 with the 62-day Rate-of-Change. I picked 62 days because the S&P 500 peaked 62 days ago. This number also represents the number of trading days in a quarter, give or take one. It also jibes with 3-month RSI, which is a momentum indicator as well. At current levels, the S&P 500 is down 15.78% over the last 62 trading days. This shows an oversold condition, but big declines from new highs can also occur at the beginning of a bear market. The blue vertical lines show when the 62-day ROC exceeded -10% after a 52-week high. Such moves preceded the bear markets of 2001-2002 and 2008-2009, as well as the 9-month zigzag decline from August 2015 to May 2016.
VIX has Yet to Spike
I do not use the S&P 500 Volatility Index ($VIX) very much because it is mostly a coincident indicator and the extreme levels can shift. The VIX can, however, be a valuable tool to identify extreme fear within uptrends and downtrends. The chart below shows the VIX over the last 25 years with a horizontal line at 40. There are two changes in 2018. First, the VIX did not dip below 10 when the S&P 500 hit a new high in September. Thus, the low end of the range could be shifting higher. Second, moves above 25 worked quite well to signal extreme fear and foreshadow bullish reversals from mid 2012 to early 2018. This may be changing as we head into 2019.
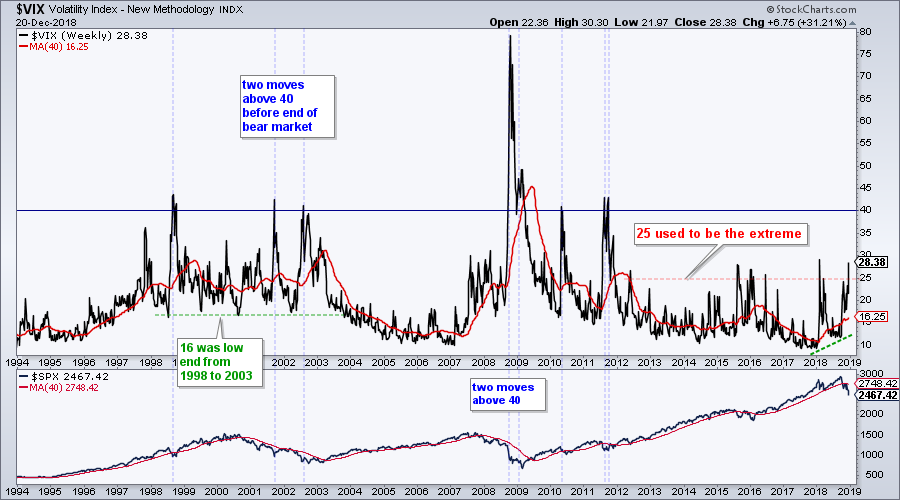
The blue vertical lines show when the VIX moves above 40. First, notice that there were two moves above 40 before the bear market in 2001-2002 ended. Second, there were also two moves above 40 in the second half of the 2008-2009 bear market (Sep-08 and Jan-09). The current VIX has yet to exceed 30 and this tells me that fear is not near extremes associated with major bottoms.
Futuristic Food for Thought
5G is going to be a big challenge (CNBC). "The U.S. does not make any equipment necessary to build out a 5G network". Wow!
5G Will Be Ultrafast, but the Roll Out Will Be Anything But (WSJ).
Notes from the Art's Charts ChartList
- The Home Construction iShares (ITB) is consolidating after hitting a new low in late October and this could be a bearish continuation pattern.
- The Retail SPDR (XRT) fell to a 52-week low this week.
- The Cloud Computing ETF (SKYY), Cyber Security ETF (HACK) and Internet ETF (FDN) fell below their November lows.
- The Networking iShares (IGN) hit a new low.
- The Semiconductor iShares (SOXX) and Semiconductor SPDR (XSD) broke their consolidation patterns to signal a continuation lower.
- The Broker-Dealer iShares (IAI), Regional Bank SPDR (KRE) and the Insurance SPDR (KIE) fell to fresh 52-week lows.
- The REIT iShares (IYR) and Mortgage REIT ETF (REM) finally succumbed to the bear market and broke down.
- The Biotech iShares (IBB) and Biotech SPDR (XBI) broke consolidation patterns and fell to new lows.
- The HealthCare Providers ETF (IHF) and Medical Devices ETF (IHI) succumbed to broad market weakness and broke support levels.
- Click here for the Art's Charts ChartList
Questions, Comments or Feedback?
I do not take symbol request and I cannot promise to response to all correspondence, but I will read it and take into under consideration. I greatly appreciate all feedback because it helps me improve the commentary and provides ideas for the future.

Plan Your Trade and Trade Your Plan.
- Arthur Hill, CMT
Senior Technical Analyst, StockCharts.com
Book: Define the Trend and Trade the Trend
Twitter: Follow @ArthurHill


