- It is What it Is
- Breadth Indicator Review
- High-Low Percent Rebounds
- Vast Majority in Long-term Downtrends
- Volatility is Increasing, Not Decreasing
- Absolute Performance vs Relative Performance
- Risk-Off Environment
- Suggestions for Art's Charts ChartList
 ... It is What it Is
... There is no forecast to start 2019 because the signals are what they are. The broad market environment turned bearish in mid October. That was the signal. Nobody knows how long this bearish environment will last or how far the decline might extend. It will end when it ends, and not a moment sooner.
As chartists and technical analysts, our job is to identify signals and take these signals until they are proven otherwise. The only thing that will end the bearish signal is a bullish signal, and I have no idea when that might occur. As far as I am concerned, the primary trend is down and this is the main driver of stock prices right now.
With the broad market environment bearish, the pickings are extremely slim within the US stock market. Sure, there will be counter-trend bounces and consolidations, and some stocks will buck the broad market trend, but the path of least resistance is down for the majority of sectors, industry groups and stocks. As such, bullish setups are not as enticing because they run counter to the broad market trend.
Breadth Indicator Review
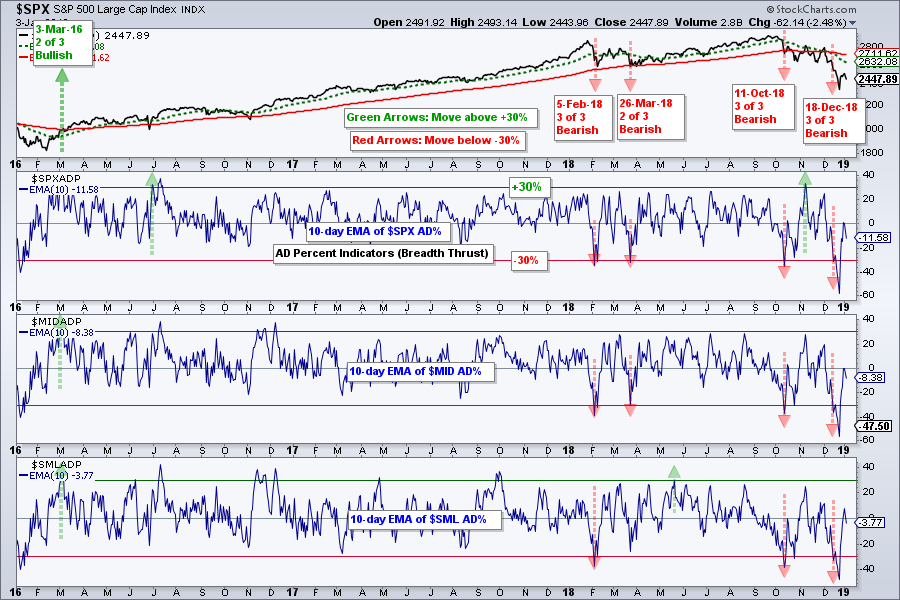
We will start with a review of the nine breadth indicators, which triggered bearish on October 11th. These are the indicators to watch going forward and I will remain bearish on the stock market until the majority of these (5) turn bullish again.
The first chart shows the 10-day EMAs of AD Percent for the S&P 500, S&P Mid-Cap 400 and S&P Small-Cap 600. The red lines show the bearish signals (below minus 10%) and the green lines show the bullish signals (above plus 10%). All three triggered bearish on October 11th and again in mid December. There was a lone bullish signal in the S&P 500 in between, but this was not enough to turn the group bullish. At least two of the three must exceed +10% to turn the group bullish.
High-Low Percent Rebounds
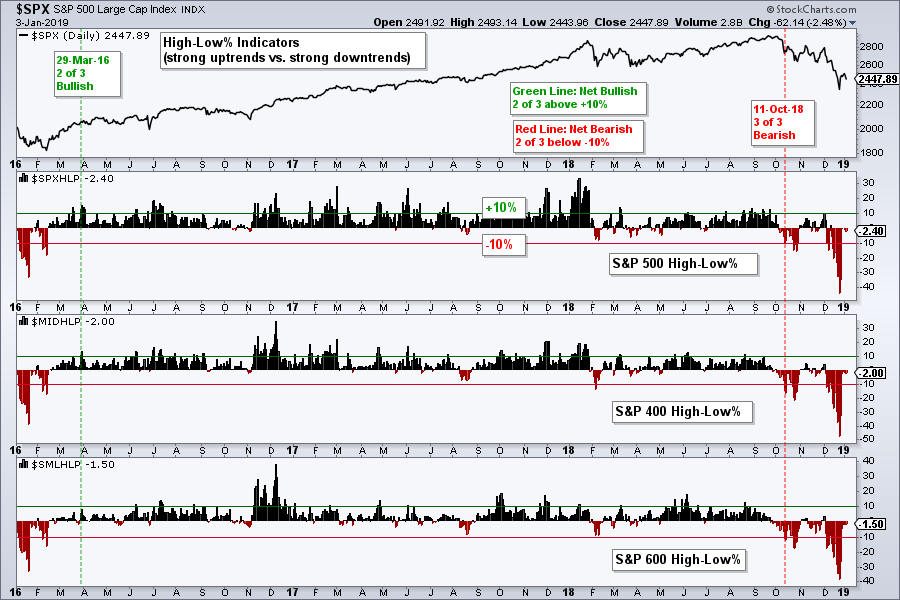
The next chart shows the High-Low Percent indicators for the S&P 500, S&P Mid-Cap 400 and S&P Small-Cap 600. Two of the three indicators triggered bullish in March 2016 and all three triggered bearish on October 11th. The plunges below -35% on December 24th marked an oversold extreme, but this is only enough to trigger an oversold bounce. Even though they have since rebounded back towards the zero area, at least two of the three need to exceed +10% to turn bullish. This means we need to see new highs appear before this indicator group will turn bullish.
Vast Majority in Long-term Downtrends
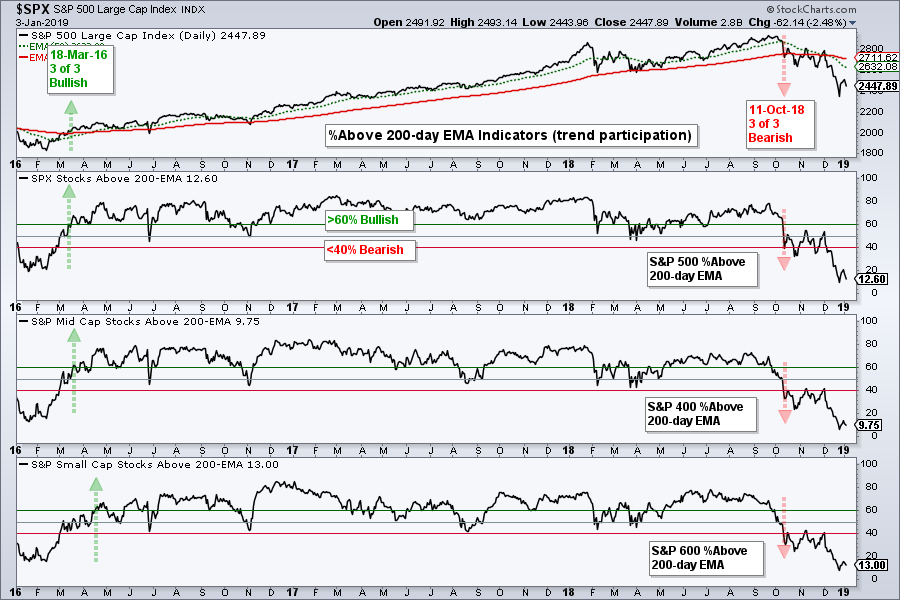
The final chart shows the percentage of stocks above the 200-day EMA for the S&P 500, S&P Mid-Cap 400 and S&P Small-Cap 600. All three indicators triggered bullish in mid March 2016 and bearish on October 11th, 2018. All three dipped below 10% on December 24th and reached bearish extremes. Again, this paves the way for an oversold bounce, but breaks above 60% are needed to trigger bullish signals.
Volatility is Increasing, Not Decreasing
The next chart shows the S&P 500 breaking down on October 11th with a sharp decline below the 200-day SMA, which is also when the breadth indicators triggered bearish signals. The index consolidated after the initial breakdown and continued lower in December with a 15% decline into December 24th. The market was clearly oversold at this point and ripe for a bounce or consolidation. The broken support zone in the 2600 area is the first area to watch for resistance should this bounce extend. It is also possible that the index simply consolidates again with a trading range in the 2350-2550 area.
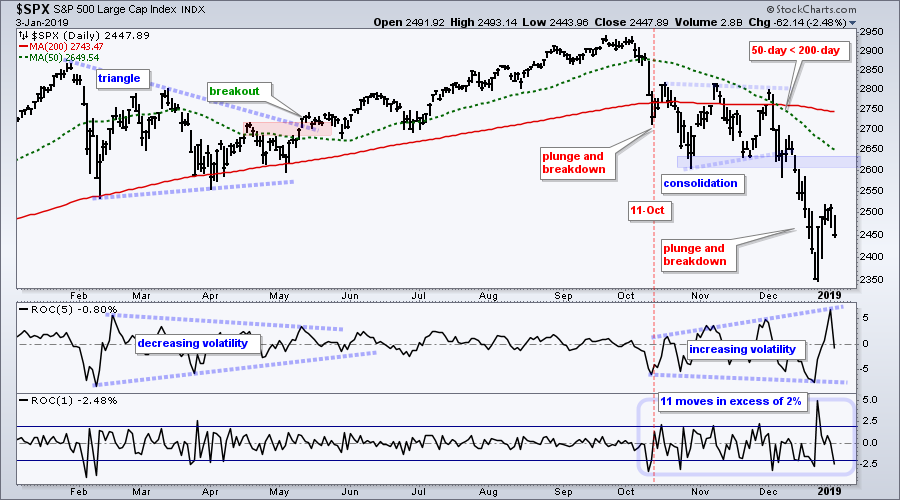
The indicator windows show the 5-day and 1-day Rate-of-Change for a volatility assessment. Notice how the range for the 5-day ROC is expanding, which means volatility is increasing. This is counter to what we saw in April-May when volatility decreased after the February-March plunges. The 1-day ROC has exceeded 2% eleven times since mid October. This is also testament to the increase in volatility.
The bearish signals in October, a long-term downtrend and high volatility make it clear that the current market environment is both bearish and risky.
Absolute Performance vs Relative Performance
As far as I am concerned, further analysis of the U.S. stock market is unecessary. The broad market environment is bearish and this is negative for the vast majority of sectors, industry groups and stocks. Trying to pick names that will buck the broad market trend is usually a lesson in futility. Sure, you might get a few long positions right, but these will likely be offset by the incorrect calls. It is hard to make money in bear markets, even with short positions.
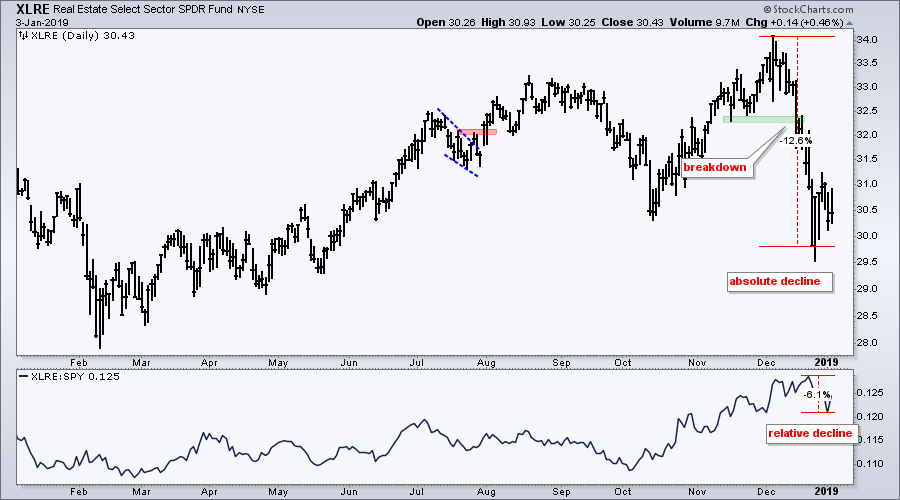
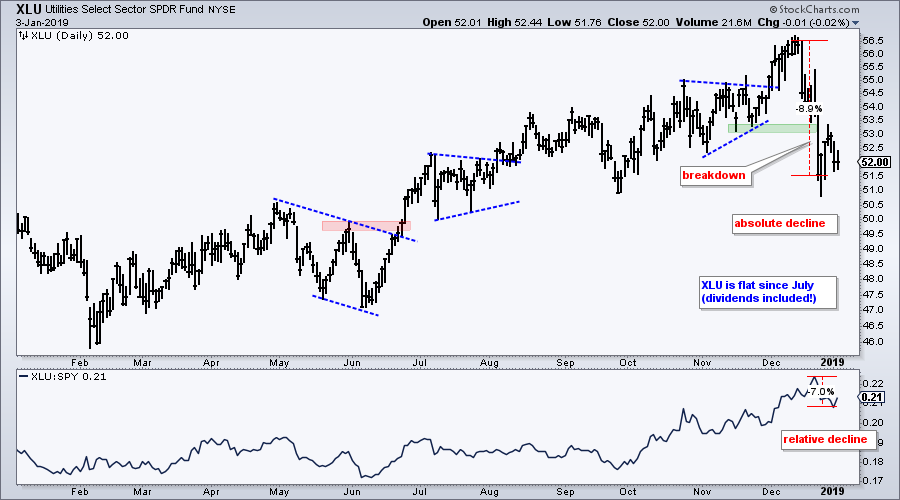
In the December 14th commentary, I asked if it was really worth owning defensive names in a bearish market environment. I did not think so then and I do not think so now. The Health Care SPDR (XLV), Consumer Staples SPDR (XLP) and Real Estate SPDR (XLRE) are down 10-12% from their December highs, while the Utilities SPDR (XLU) is down around 8% from its December high. While these four may be "outperforming" and showing relative strength, they are clearly not immune to broad market weakness and show absolute weakness. The chart below shows XLV falling 15.5% from high to low and the price relative (XLV:SPY ratio) falling just 2.7%. XLV is outperforming, but the price chart sure is ugly. XLP fell 12.7% in absolute terms, but the price relative fell just 3.5%.

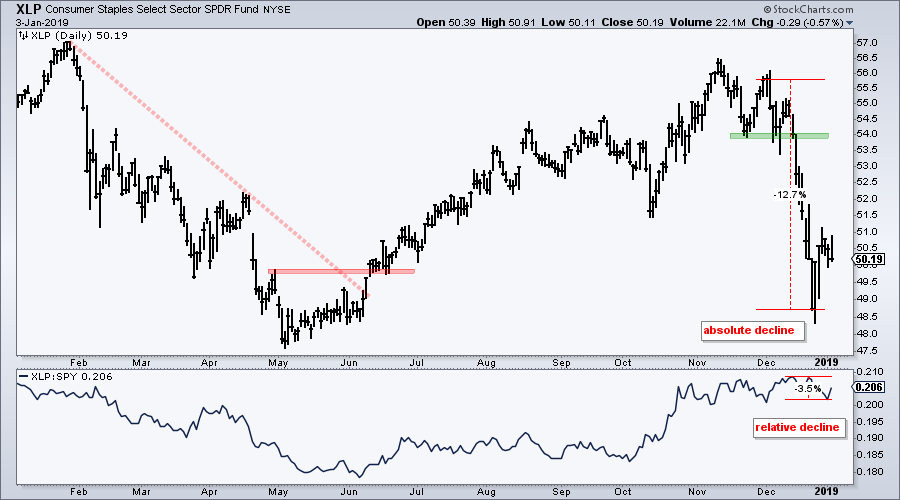
Bear market environments are different from bull market environments. We can look for leaders in bull market environments and use these names to outperform on the upside. The leaders in a bull market have bigger gains than the index or benchmark. Bear market environments, however, are different because the "leaders" are usually just the ones going down the least. We make or lose money based on absolute performance, not relative performance. This is why we must look at the price chart first and the indicators second.
Risk-Off Environment
Outside of the stock market, we are seeing signs of risk-off in the financial markets. In general, a risk-off environment means investors/traders prefer safe-haven assets over risk-assets. Safe-haven assets include Treasury bonds and the Yen. Risk assets include stocks, especially high-beta stocks like small-caps.
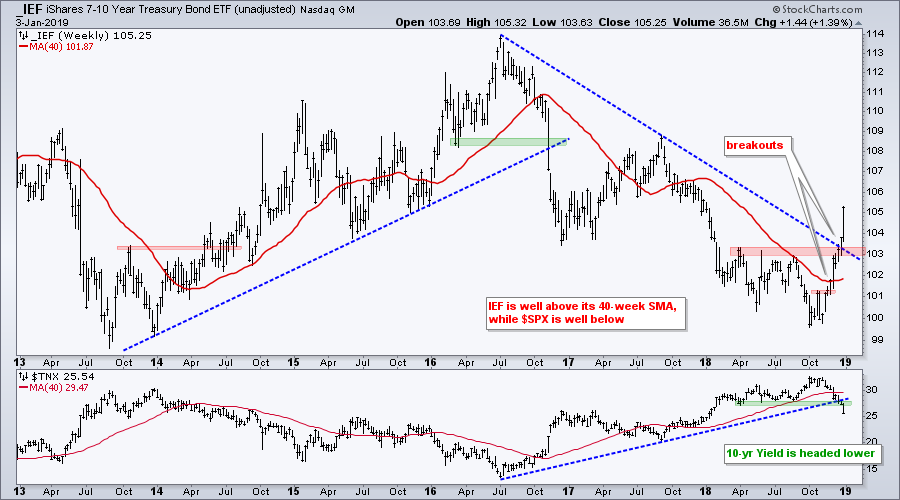
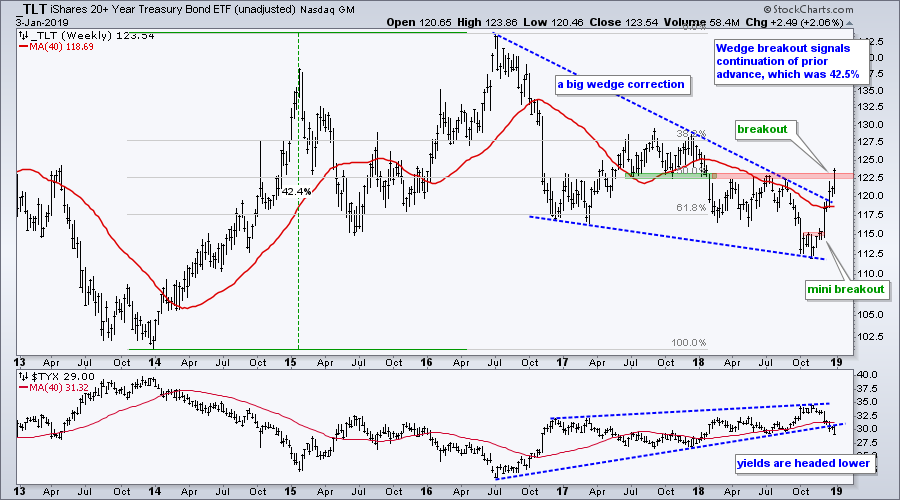
The first chart shows the unadjusted 7-10 YR T-Bond ETF (_IEF) making its first breakouts in November with a move above resistance and the 40-week SMA. IEF then surged above the spring-summer highs in December and started the year with a 1.4% bang this week. The 10-yr T-Yield ($TNX) broke its spring-summer lows and this means yields are headed lower. The second chart shows unadjusted 20+ YR T-Bond ETF (TLT) breaking above resistance with a 2% surge this week.
The next chart shows the Yen ETF (FXY) surging off support and breaking resistance over the last three weeks. For reasons too involved to get into here, the Yen is regarded as a safe-haven currency that tends to attract buyers during periods of high uncertainty. You can read more in this article on Financial Sense. In any case, the Yen surged over 5% the last three weeks and this is the biggest move since summer 2016. A surge in the Yen is also negative for the Nikkei 225 ($NIKK), which formed a big double top in 2018 and broke down in December.

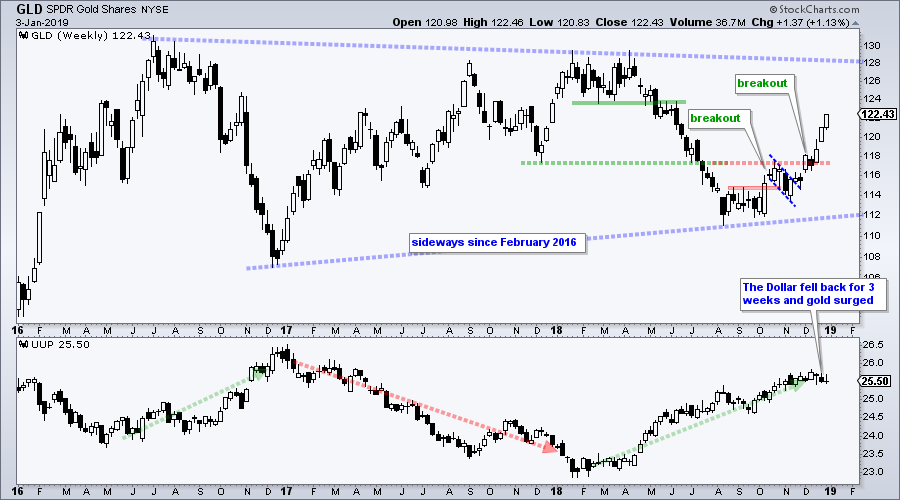
While I do not necessarily view gold as a risk-off asset per se, there is no denying the surge since mid October. The top window shows GLD breaking first resistance with a big surge in mid October, correcting into late November and breaking out again in December. The swing within the 30 month range is up and next resistance is in the 127.5 area.
Suggestions for ChartList
With the bulk of the evidence bearish, I am holding off on updating the Art's Charts ChartList. In fact, I would like to do something new for this list in 2019. Instead of a running list of 30 ETFs, I may just have a list of the strongest uptrends in the ETF universe. This would include commodity ETFs, international ETFs, currency ETFs and others. Suggestions are welcome.
Questions, Comments or Feedback?
I do not take symbol request and I cannot promise to response to all correspondence, but I will read it and take into under consideration. I greatly appreciate all feedback because it helps me improve the commentary and provides ideas for the future.

Plan Your Trade and Trade Your Plan.
- Arthur Hill, CMT
Senior Technical Analyst, StockCharts.com
Book: Define the Trend and Trade the Trend
Twitter: Follow @ArthurHill
