 AmerisourceBergen (ABC) started the day strong and rose with the broader market, but turned south in the afternoon and formed a bearish engulfing. This bearish candlestick reversal looks especially ominous because it formed near the minimum retracement and with the Commodity Channel Index (CCI) overbought.
The chart shows ABC breaking down with a sharp decline in December and recording 52-week lows. The pink lines mark the 255-day high-low range and this is essentially the 52-week range. A move below the lower pink line signals a fresh 52-week low. We cannot see the upper line because the 255-day high is above 100. The dashed line is the average of the high-low range.
The stock became quite oversold in late December and bounced with the rest of the market over the last three weeks as ABC retraced 38.2% of the prior decline. The minimum retracement for a counter-trend bounce is around one third.
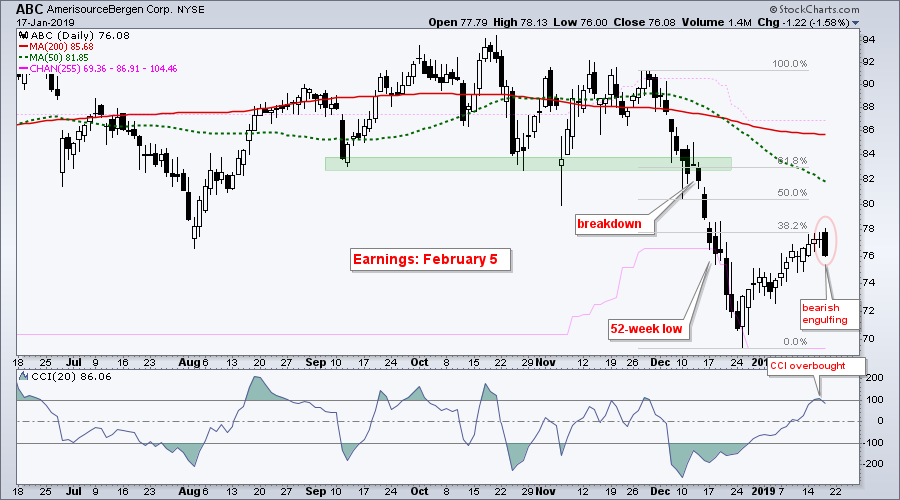 There are signs that this bounce is ending with Thursday's bearish engulfing. The open was strong, but the bears took control and drove prices down in the afternoon. This candlestick is also an outside reversal day because the range is larger than the range of the prior candlestick.
The indicator window shows the Commodity Channel Index (CCI) moving above 100 to become short-term overbought on Wednesday. CCI moved back below 100 on Thursday and this signals a downturn in momentum. Note that CCI is more sensitive that RSI and usually becomes overbought/oversold more often.
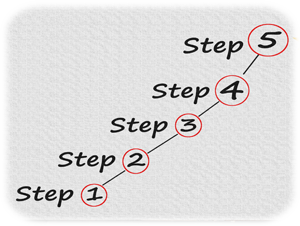
The December low marks the first downside target, while a move above today's high would negate this bearish setup. For those counting, here are the five steps that make up this bearish setup: Downtrend overall (below 200-day), short-term overbought (CCI > 100), near key retracement (38.2%), bearish candlestick (engulfing), momentum downturn (CCI<100).
On Trend on YouTube
Rising Wedges and Resets
- 50-days in Play as Breadth Wanes
- Rising Wedge is Bullish Until it Ain't
- Resetting Key Levels for Big Sectors
- Retail, Housing and Semis Weaken
- Bonds, Gold, Silver and the Dollar
- Stocks to Watch (CVX, GOOGL, INTC, QCOM)
- Click here to Watch
Separating the Signal from the Noise
- Big Breakdown vs Zweig Thrust vs Resistance
- Overbought Indicators and Waning Breadth
- Watching the Windups (XLK, XLV, XLC, GLD)
- Pullback for Treasuries and Surge in Junk
- Comparing the Bounce using Stochastics
- Stocks to Watch (KR, RMD, SBUX, TWLO)
- Click here to Watch
- Arthur Hill, CMT
Senior Technical Analyst, StockCharts.com
Book: Define the Trend and Trade the Trend
Twitter: Follow @ArthurHill


