- Finance Does the Heavy Lifting.
- One out of Four is Not Enough.
- New Highs Remain Subdued.
- Majority of Stocks in Long-term Downtrends.
- The Lone Breadth Thrust.
- Bear Market Environments.
- Strength Outside of U.S. Stocks.
- Separating the Contenders from the Pretenders.
- Growth Stocks with Strong Charts.
 ... Finance Does the Heavy Lifting
... Stocks extended the big rebound with more gains this week. The Financials SPDR (XLF) came alive to lead the sector SPDRs, but XLF remains well below the November-December highs, as do the other nine sectors. The plunge started from the December high and I would not take the current bounce seriously until we start seeing some key sectors break above this high. In other words, this bounce does not negate the December decline until it exceeds it.
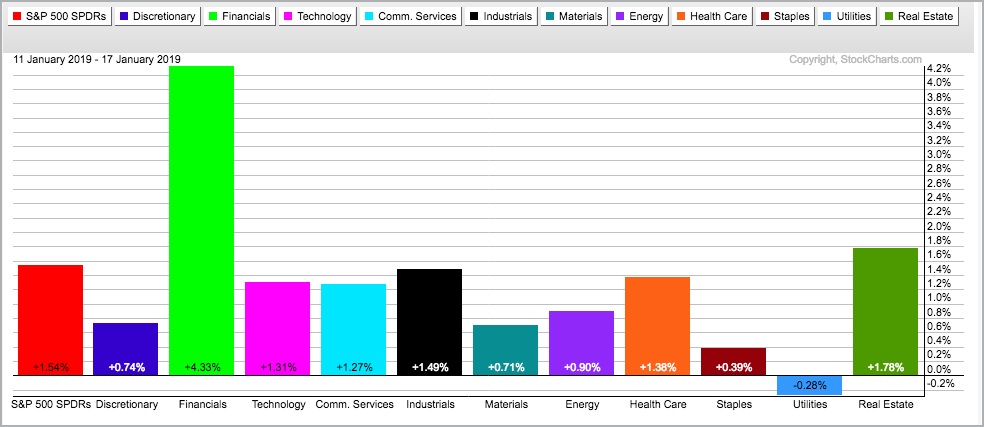
The Financials SPDR (XLF) is up 4.58% over the last five days and this is more than double the second place sector, which is the Real Estate SPDR (+1.97%). The Health Care SPDR (XLV) is in second place with a 1.71% gain. SPY is up 1.58% the last five trading days and the remaining eight sectors are up less than SPY. Finance is doing the heavy lifting as the others slightly underperform.
One out of Four is Not Enough
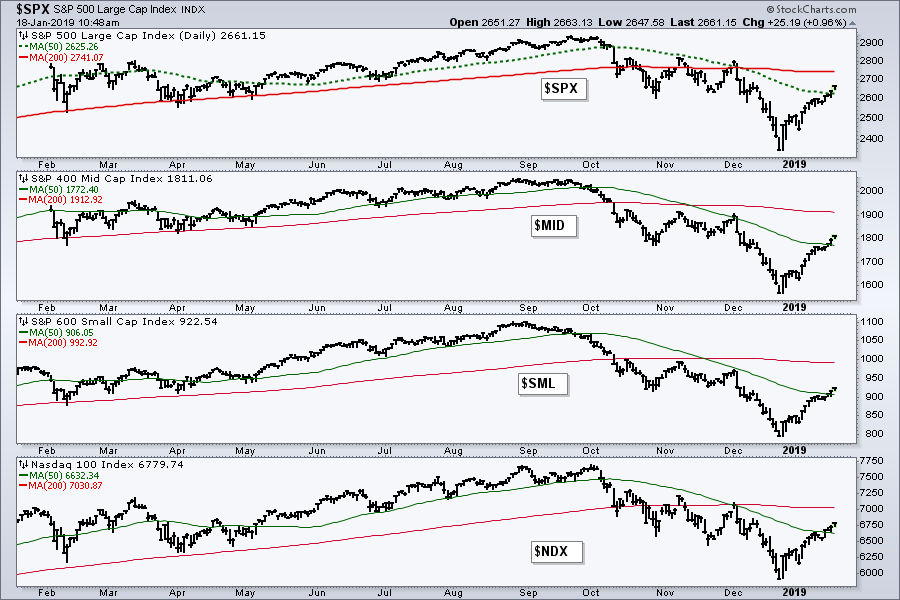
A bull market is like a chair: it needs at least three legs before you can sit on it. I see one leg on the bull market chair right now, but the other three legs are missing and I remain bearish on the broad market environment. First, the S&P 500, S&P Mid-Cap 400 and S&P Small-Cap 600 are below their 200-day SMAs and their 50-day SMAs are below their 200-day SMAs (first missing leg). Thus, the long-term trends are down.
New Highs Remain Subdued
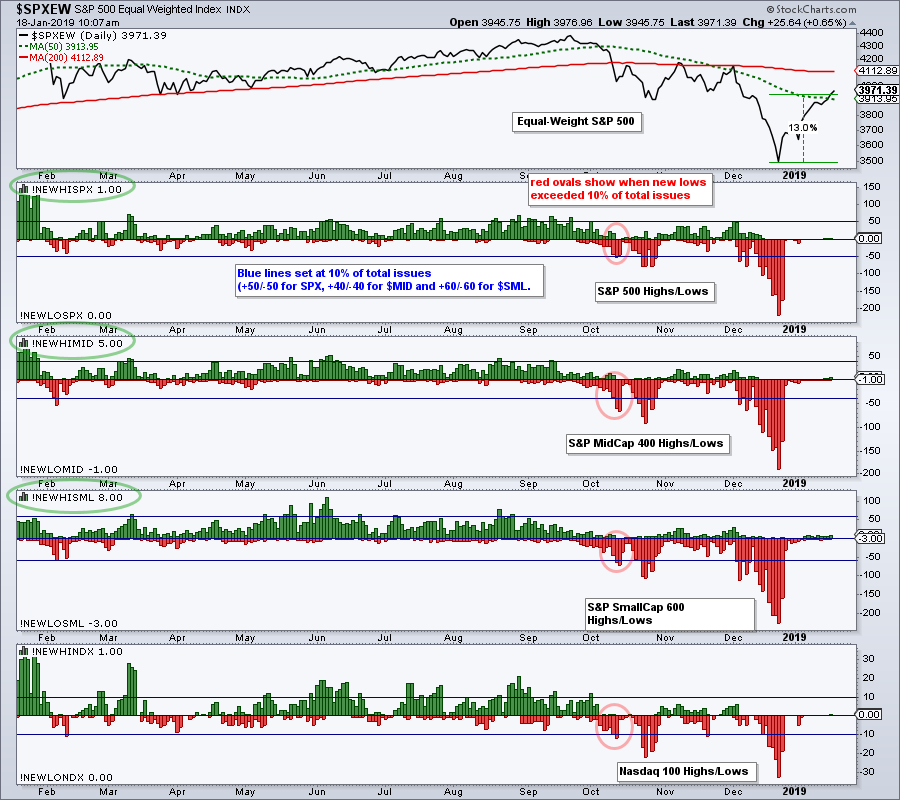
Second, new highs remain seriously subdued (second missing leg). New highs expanded this week with a total of 14 on Friday (out of 1500). The new high breakdown is as follows: S&P 500 (1), S&P Mid-Cap 400 (5) and S&P Small-Cap 600 (8). For a return to broad strength, I would like to see this number exceed 150, which is 10% of 1500. A bull market requires leadership and stocks making new highs are clear leaders.
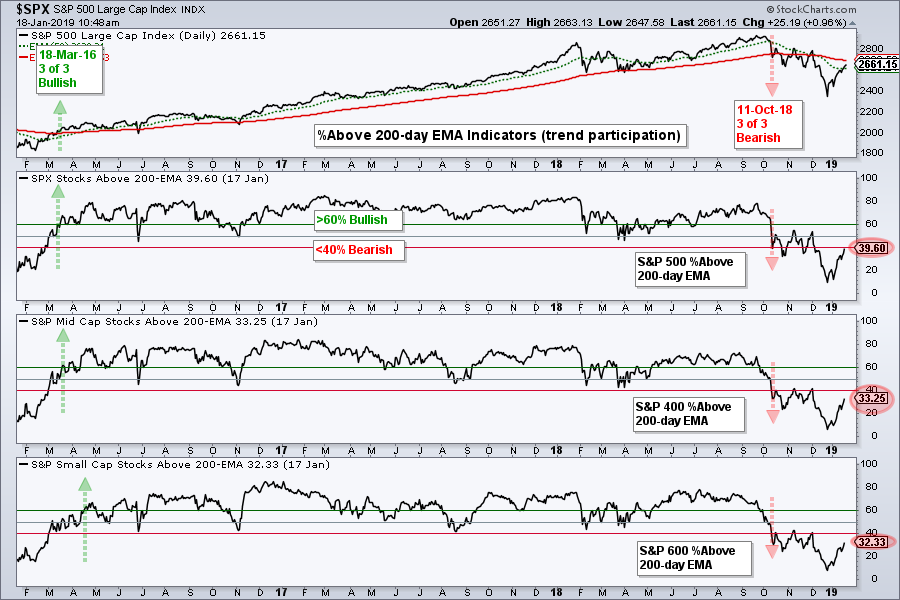
Majority of Stocks in Long-term Downtrends
Third, the percentage of stocks above the 200-day EMA improved as the advance extended, but the indicator remains below 40% for all three indexes (third missing leg). I would like to see this indicator exceed 60% for two of the three indexes to turn bullish.
The Lone Breadth Thrust
And now for the positives. First, ALL three main stock indexes moved above their 50-day SMAs for the first time since late September. The S&P Small-Cap 600 broke its 50-day SMA in late September and moved back above this SMA this week. Second, there was a breadth thrust on January 10th as the 10-day EMAs for AD Percent moved above 30% (all three). This is the fourth leg and the only leg on the bull chair right now.
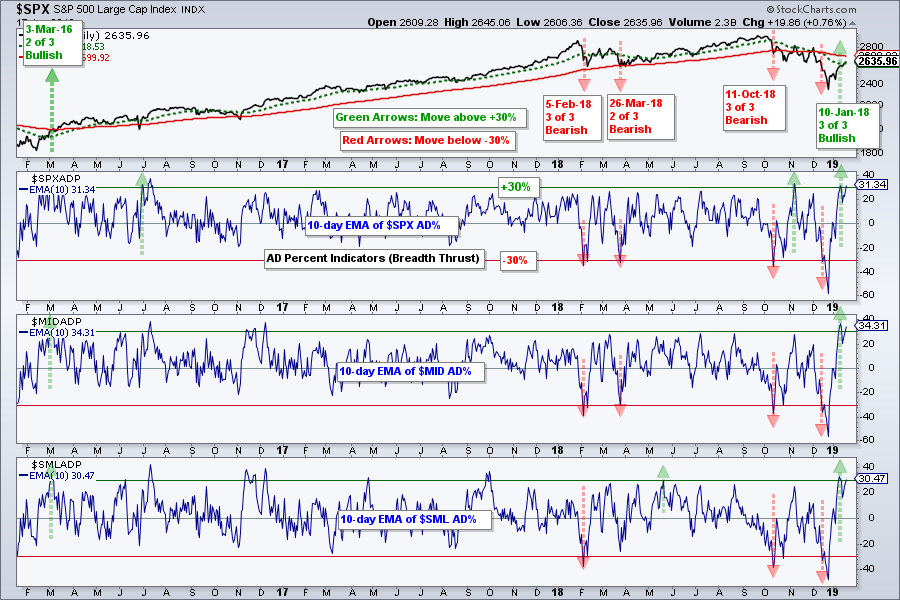
While the breadth thrust is positive and we are seeing follow through with further gains this week, the bull market chair still only has one leg (the breadth thrust). This surge is coming after some extreme oversold readings and we have yet to see any resistance breakouts in the major indexes (December highs). I would like to see the S&P 500 take out its 200-day SMA, new highs expand and more stocks above their 200-day EMAs before turning bullish on stocks again. It takes a least three legs to support a chair.
Note that I covered the short-term uptrend with a commentary and charts on Wednesday.
Bear Market Environments
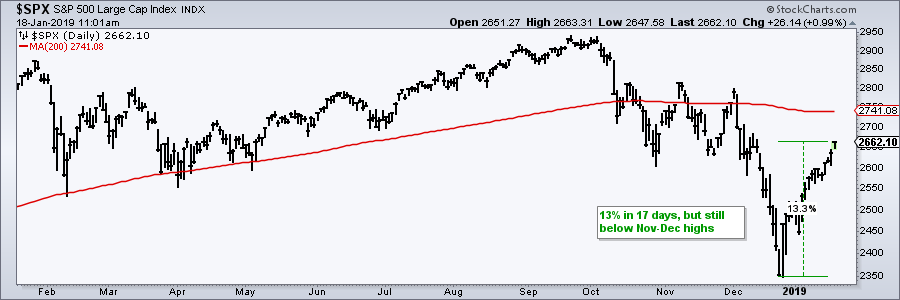
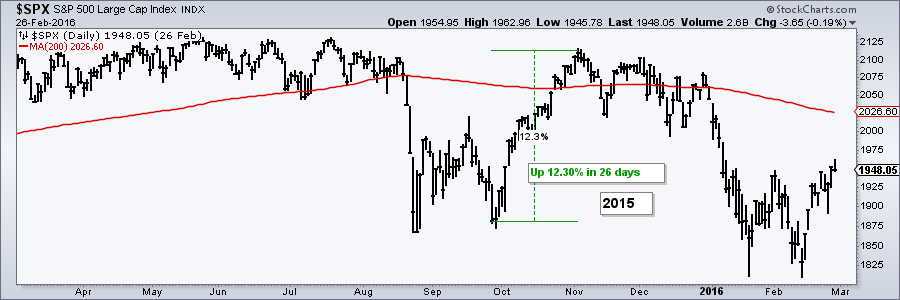
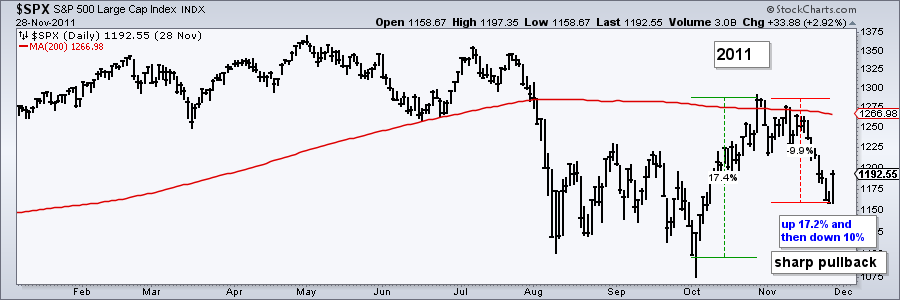
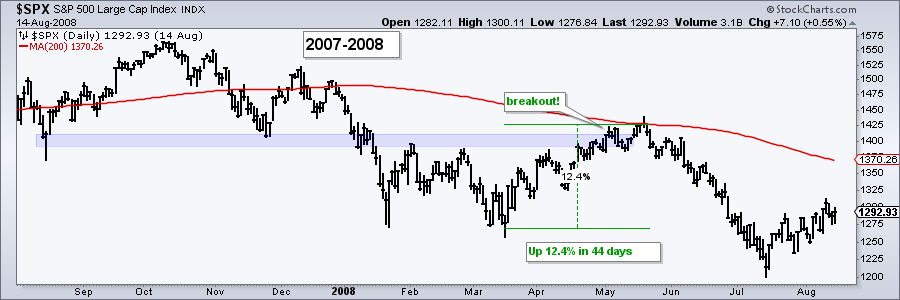
Despite a bearish stance for the major stock indexes, there are still stocks in uptrends out there. In general, I shy away from stocks when my broad market stance is bearish because risk levels are higher when the broad market is trending lower (think 200-day SMA, lower lows, lower highs). An extended bear market would take down most stocks and it would be hard to pick winners in such an environment. The charts below shows the current advance as well as some big advances in 2008, 2011 and 2015.
I am not a fan of shorting stocks or the market for a few reasons. First, the major stock indexes have an upward bias over the long-term. Second, bear market rallies can be quite sharp. Third, bear markets can involve long choppy periods with a couple of sharp declines. Timing such declines is challenging. Fourth, the Fed and the powers that be would prefer not to have a bear market.
Strength Outside of U.S. Stocks
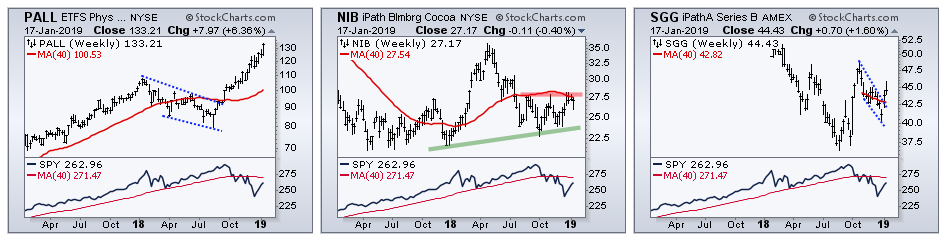
Last week I looked outside of U.S. stocks for uptrends, breakouts and promising charts. The Palladium ETF (PALL) surged 6% this week and hit another new high. The Cocao ETN (NIB) was down a bit, but remains close to resistance so I am watching for a breakout. The Sugar ETN (SGG) moved above its 40-week SMA last week and the channel breakout is holding.
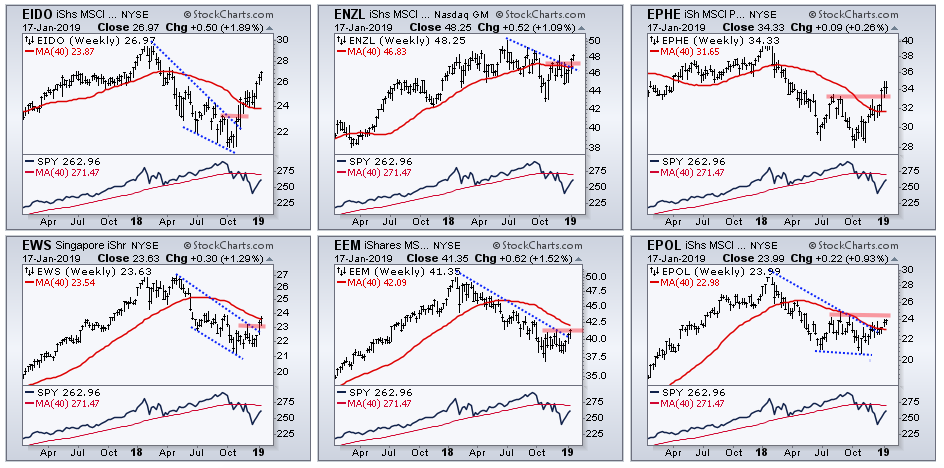
The next charts shows weekly bars for six international ETFs over the last two years: four have active breakouts and two are just shy of breakouts. The Indonesia iShares (EIDO) broke out in October, the New Zealand iShares (ENZL) broke out over the last two weeks, the Philippines iShares (EPHE) broke out three weeks ago and the Singapore iShares (EWS) broke out two weeks ago. The Emerging Markets ETF (EEM) and Poland iShares (EPOL) remain short of breakouts. Full size charts are shown in the Art’s Charts ChartList.
Separating the Contenders from the Pretenders
Chartists looking to separate the contenders from the pretenders, even in a bear market environment, should focus on three price points: the relationship between the October-December lows, the current price relative to the November-December highs and the 52-week high. For the 52-week high on a daily chart, I am using the 255-day high, which is represented by the 255-day Price Channel.
Stocks that held above their October low in December showed relative chart strength during the market meltdown. Note that SPY and QQQ exceeded their October lows in December. Stocks that subsequently broke above their November-December highs are outperforming on the upside. SPY and QQQ remain well below these highs. Stocks at or near a 52-week high are leading and most likely in uptrends.
And then there is the hat-trick. Stocks that held above their October low in December, broke their November-December highs and traded near 52-week highs recently. These stocks are clearly leading the pack.
Before analyzing some of these charts, I would like to clarify that I do not know which ones will continue to trend higher and which ones will reverse. An uptrend and strong chart tell me enough. I do not think volume, a momentum oscillator or a relative strength score will add more value. Sorry, but there is also a little bit of luck involved!
As far as I am concerned, we need a shot gun approach to picking stocks and 20 to 30 positions to spread the risk. There will be some bad picks, but hopefully the gains from the winners will outpace the losses from the losers. Considering the broader market environment, chartists can also consider putting these on a watchlist for when overall conditions improve. Let's look at some of these charts.
Each chart shows the 255-day Price Channel with the upper line (pink) marking the 255-day high. The 200-day SMA is also on the chart for reference and SPY is shown in the indicator window to compare performance.
Growth Stocks with Strong Charts
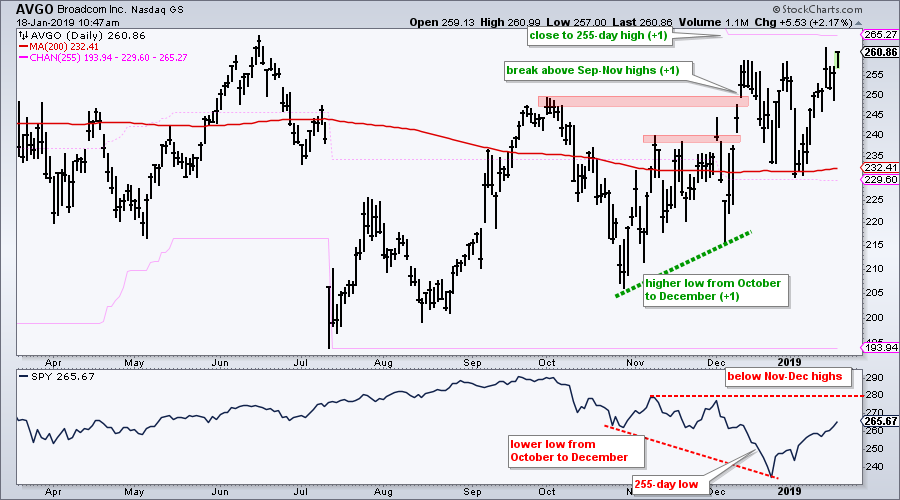
The first chart shows Avago (AVGO), which was featured as a rare bottom fishing expedition in late August. The stock formed a higher low from October to December (+1). The stock broke above the September and November highs (+1). The stock came within 1.3% of a 52-week high on Monday and is currently within 4% of a 52-week high (+1). This looks like a hat-trick.
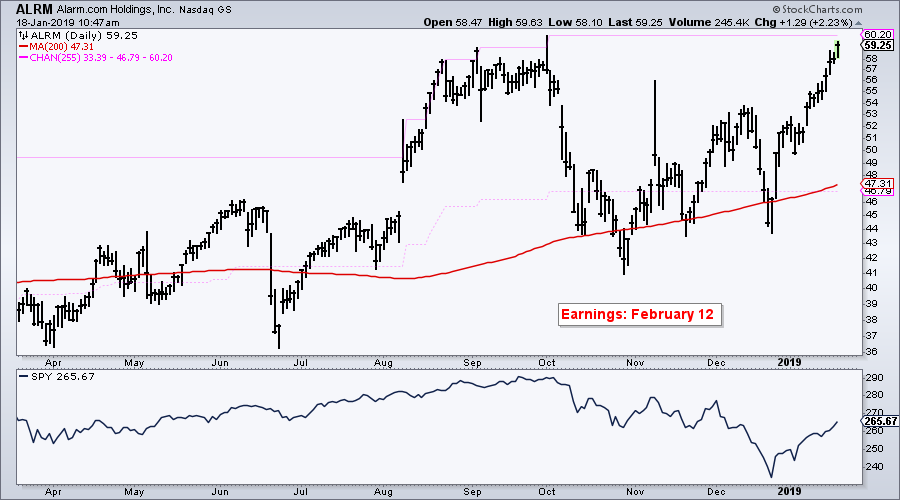
Alarm.com (ALMN) surged towards another new high with a big move over the last few weeks.
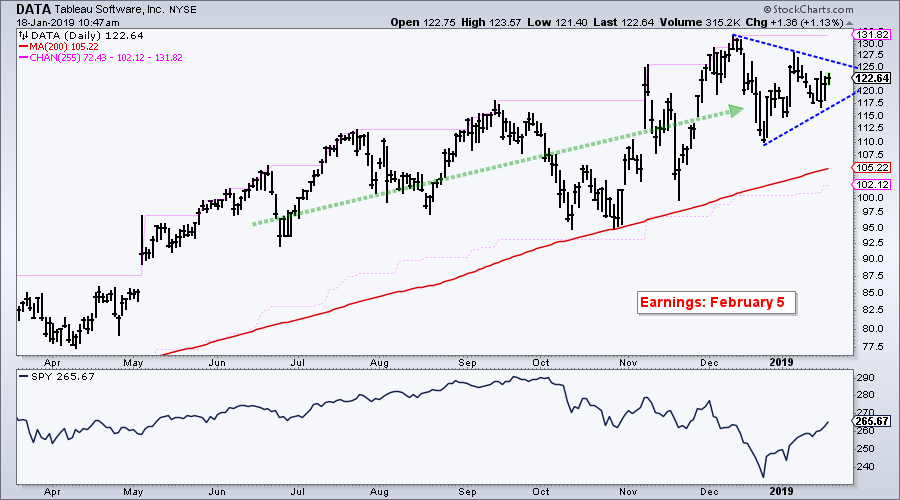
The next chart shows Tableau Software (DATA) hitting a new high in early December and then forming a triangle consolidation. This is a triangle within an uptrend and thus a bullish continuation pattern.
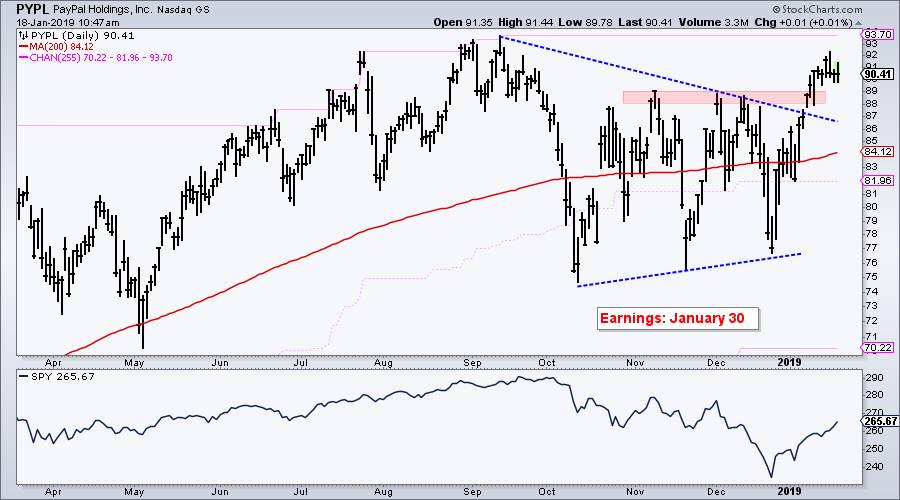
Paypal (PYPL) is breaking out of a large triangle and nearing its 52-week high.
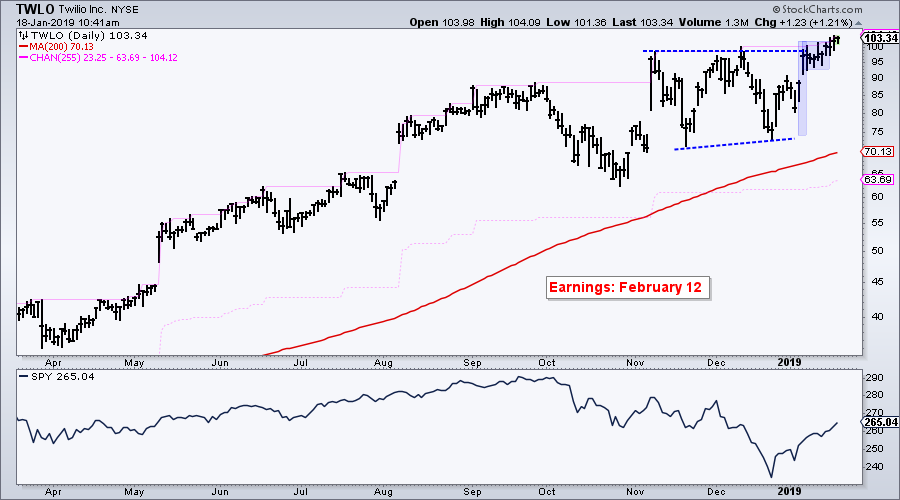
Twilio (TWLO) broke out of a consolidation and a flag pattern with a move to new highs this week.
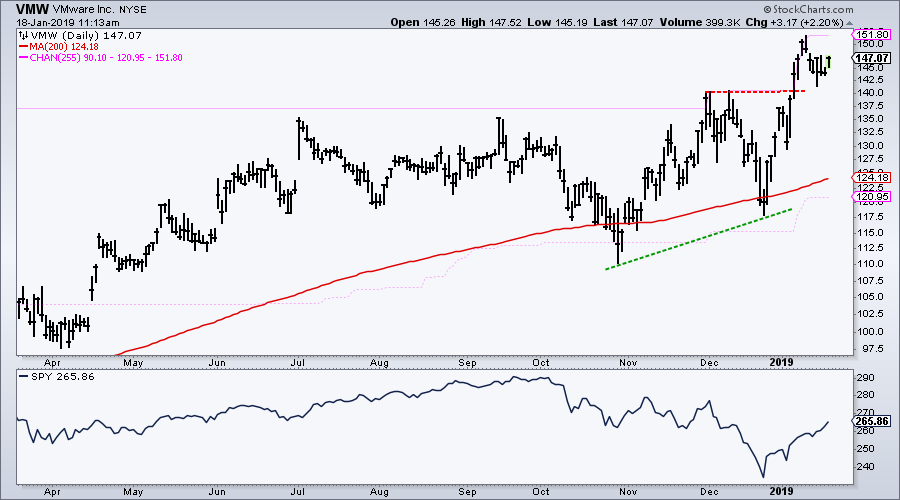
VMWare (VMW) tested the rising 200-day SMA in October and December, and then surged to a new high in January.
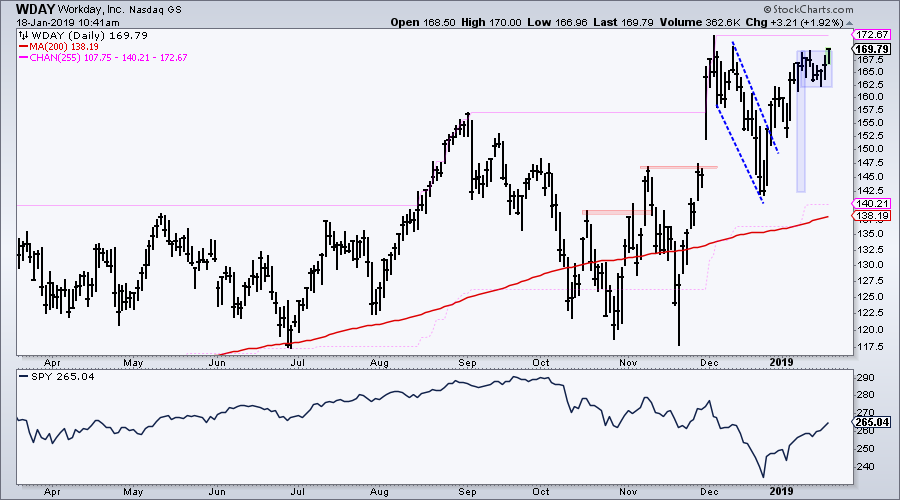
Workday (WDAY) is clearly not for the faint at heart because the stock is quite volatile. WDAY surged to a new high in early December, fell back into yearend and bounced back toward its prior high.
Cyber-Ark Software broke out of a triangle this year and is close to another 52-week high.

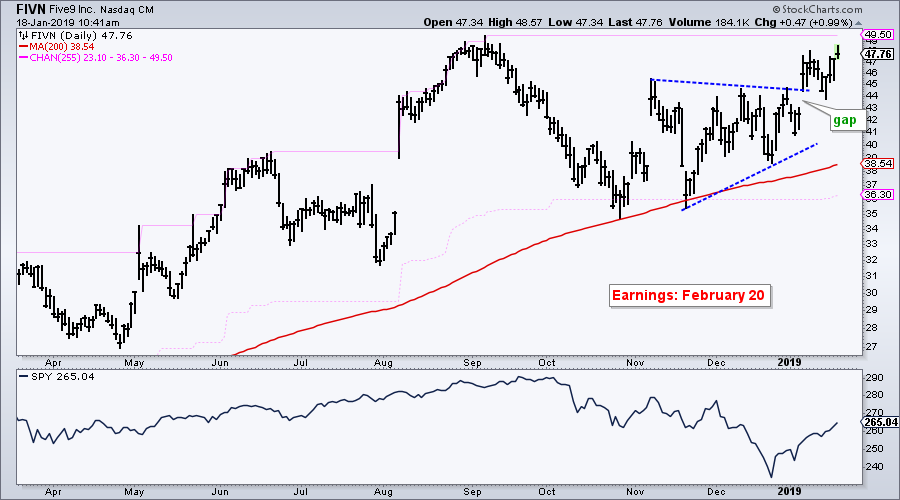
Five9 (FIVN) also broke out of a triangle and is near a new high.
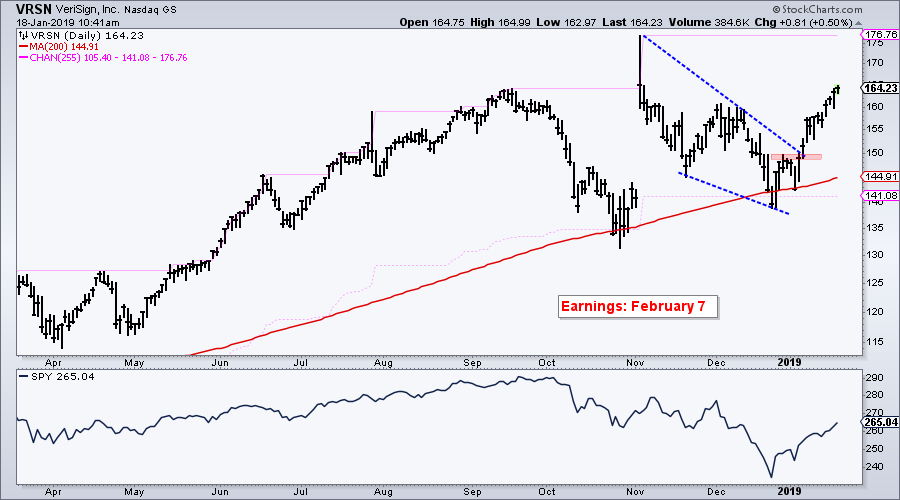
Versign (VRSN) was featured in DITC as it bounced off its 200-day SMA in early January. The stock extended its gains and is very close to a new closing high. The Price Channel marks the intraday high, which is at 176.76.
Here are some other growth stocks with strong charts:
VMW, CDNS, TEAM, HZNP, INVA, RMD, UBNT, XLNX, WING, PLNT, OKTA, FN, SPLK, CRM
Art's Charts ChartList
I updated the ChartList with a selection of key charts to watch going forward. The S&P 500 and breadth charts are at the top. Some commodity and international ETFs follow. The last ten charts are the hat-trick stocks featured above.
Questions, Comments or Feedback?
I do not take symbol request and I cannot promise to response to all correspondence, but I will read it and take into under consideration. I greatly appreciate all feedback because it helps me improve the commentary and provides ideas for the future.

Plan Your Trade and Trade Your Plan.
- Arthur Hill, CMT
Senior Technical Analyst, StockCharts.com
Book: Define the Trend and Trade the Trend
Twitter: Follow @ArthurHill


