- Stocks Bid to Extend Higher.
- SPY Enters the Prior Consolidation.
- Big Sectors Join the Breakout Parade.
 ... The S&P 500 SPDR (SPY) and several sector SPDRs broke out of short-term consolidations in a bid to extend the upswing that began on December 26th. While I remain in the bearish camp long-term (weekly S&P 500 chart), the short-term trend is clearly up. Today I will focus on the current upswings, which just entered their 15th day. Most notably, the big sectors are also breaking out and these big cogwheels are driving the market higher.
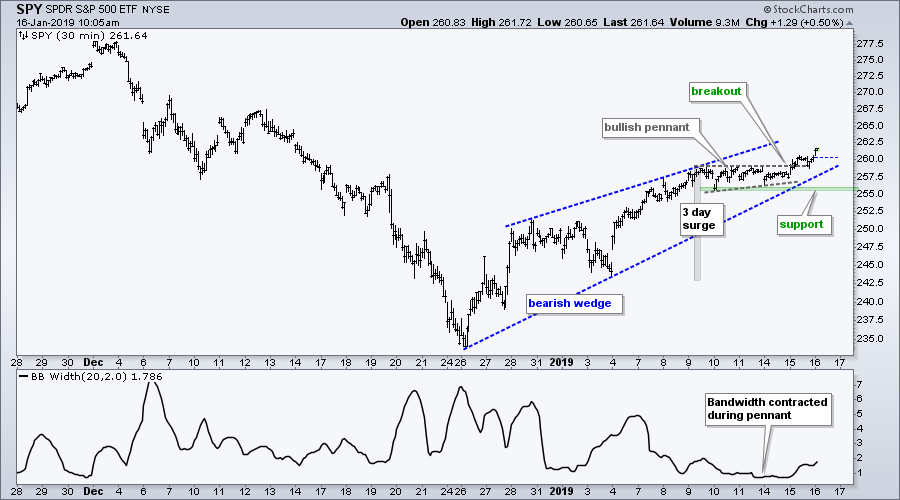
The first chart shows SPY with a rising wedge and a pennant breakout within this wedge. Even though I view this advance as a counter-trend bounce after the December decline, the wedge is rising and the pennant breakout reinforces this short-term uptrend. Basically, there is a 3-day surge, a 4-day stall (pennant) and a breakout. This breakout signals a continuation of the 3-day surge and the mid January lows now mark first support to watch going forward.
SPY Enters the Prior Consolidation
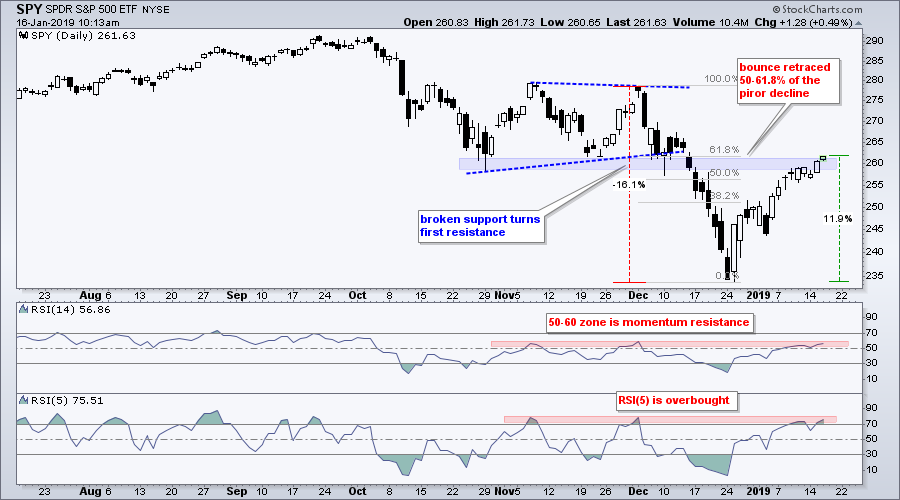
The next chart shows candlesticks over the last six months for a little perspective. SPY is up around 12% in fifteen days and entering into the November consolidation. We do not need a momentum oscillator to know that this bounce is getting extended. I would not be concerned with overbought conditions if the bigger trend were up. However, I think the bigger trend is down and current conditions do not favor further gains if this assessment is correct. The market is out to surprise us so I will monitor the short-term trend on the 30-minute chart for developments.
Big Sectors Join the Breakout Parade
The next CandleGlance charts show 30 minute closes for the 11 sector SPDRs over the last sixteen days, which captures the advance since December 26th. The percentage numbers show the sector weightings in SPY. The six biggest sectors are at the top and five broke out of consolidation patterns. XLF is leading with the first breakout. XLY is lagging somewhat with the last breakout. XLI does not have a breakout working per se, but the ETF did hit a new high for the move this week. The mid January lows (consolidation lows) mark support to watch going forward. SPY is in good shape as long as the majority of these big sectors hold support.
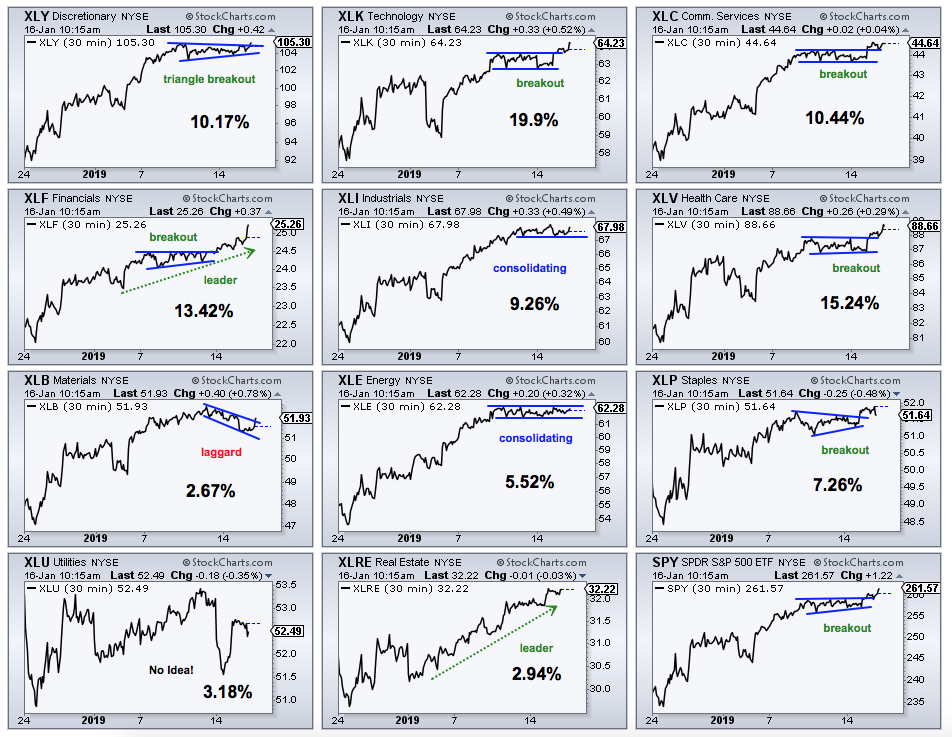
The smaller sector SPDRs and SPY are shown in the lower half. XLB and XLU are laggards because both fell over the last few days. XLB may have a falling flag breakout working. I have no idea what XLU is up to, but the chart is not bullish. XLE is still consolidating. XLP broke out, but the breakout is already looking shaky. XLRE is leading with a new high for the move, which is 16 days old.
On Trend on YouTube
Separating the Signal from the Noise
- Big Breakdown vs Zweig Thrust vs Resistance
- Overbought Indicators and Waning Breadth
- Watching the Windups (XLK, XLV, XLC, GLD)
- Pullback for Treasuries and Surge in Junk
- Comparing the Bounce using Stochastics
- Stocks to Watch (KR, RMD, SBUX, TWLO)
- Click here to Watch
- Arthur Hill, CMT
Senior Technical Analyst, StockCharts.com
Book: Define the Trend and Trade the Trend
Twitter: Follow @ArthurHill


