 I highlighted the confluence of data points that argue for resistance in the S&P 500 last week and would like to review this as we start a new week. Note that I only focus on resistance when the bigger trend is down. Why? Because resistance levels have a much better chance of holding during downtrends. Support levels, on the other hand, have a much smaller chance of holding. Think about it. Lower lows are expected in a downtrend and this means prior lows should not be considered valid support levels. Here's a ChartWatchers article from December 15th explaining my take on dubious support levels.
A resistance zone in the S&P 500 is also a potential turning point during a counter-trend bounce. This is important because the S&P 500 is the most widely followed benchmark for the U.S. stock market and some $9.9 trillion is benchmarked against the index (source: spindices.com). This suggests that most sectors, industry groups and stocks will also come under pressure if the S&P 500 turns down from resistance. Yes, the S&P 500 is the 800-pound gorilla in the stock market.
Before looking at some short-term charts, note that the bulk of the evidence remains bearish for the stock market. My long-term outlook was explained in Thursday's On Trend show and Friday's Weekly Market Review.
- The S&P 500 is well below the 200-day SMA
- The 50-day SMA of the S&P 500 is below the 200-day SMA
- Some 67% of stocks in the S&P 1500 are below their 200-day SMAs
- There were just 10 new highs (out of 1500 stocks) on Friday
- XLK, XLY, XLF, XLC and XLI are below their 200-day SMAs
A Confluence of Data Points
The chart below shows the S&P 500 SPDR (SPY) falling 16% from early December to late December and then rebounding with an 11% surge. This 11% surge looks great on its own, but it is a mere counter-trend bounce when taken in context. Moreover, there are at least four data points arguing for resistance in the 260 area. First, broken support turns resistance, which is a classic tenet of technical analysis. Second, the advance retraced 50-61.8% of the prior decline and this is normal for a counter-trend bounce.
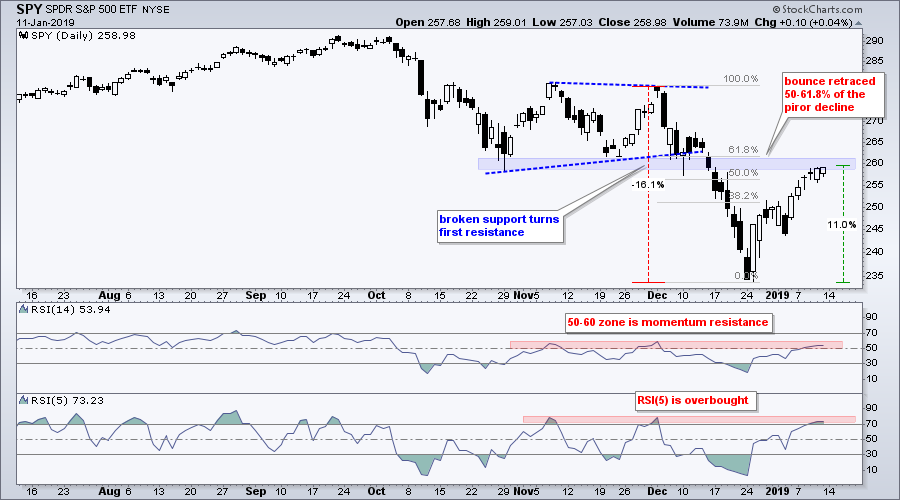
The first indicator windows shows RSI(14) moving into the 50-60 zone, which typically acts as momentum resistance during a bigger downtrend. RSI(14) often ranges between 20 and 60 during a downtrend. The lowest window shows RSI(5) moving above 70 and becoming short-term overbought for the third time since November. A move back below 70 would provide a bearish mean-reversion signal.
A Bearish Wedge Takes Shape
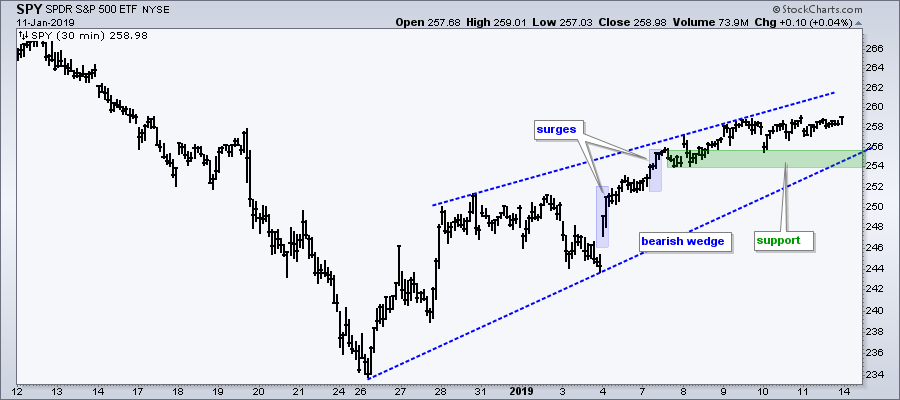
I do not use intraday charts very much, but they can be useful for focusing on a particular move, such as the advance since December 26th. The chart below shows 30-minute bars with a rising wedge taking shape. I consider this a bearish wedge because it is retracing a portion of the prior decline. SPY surged on January 4th and 7th for a few bars, and then struggled over the last five days. The wedge line and recent lows combine to mark support in the 254-256 area. A break here would reverse the upswing and argue for reversal of the short-term uptrend.
On Trend on YouTube
Big Picture Dictates Trading Bias
- Review of the Long-term Picture ($SPX weekly)
- SPY and QQQ Become Short-term Overbought
- Where are the New Highs and Uptrends!?
- Sorting Sectors Using CandleGlance
- XLC and XLY Lead Bounce as XLU Looks Vulnerable
- Click here to Watch
- Arthur Hill, CMT
Senior Technical Analyst, StockCharts.com
Book: Define the Trend and Trade the Trend
Twitter: Follow @ArthurHill


