- Big Four Retake 50-day SMAs.
- %Above 200-day Lags for XLP.
- 52-week Highs for 22 REITs.
- Jobless Claims Hit 40+ Year Low.
- TLT Stalls between Key Levels.
- Dollar Fails to Hold Breakout.
- Gold Breaks out of Small Consolidation.
- Shanghai Composite Forms Potential Double Bottom.
- Delta Turns Indecisive.
- Tesla Goes from Leader to Laggard.
- Procter & Gamble Leads Colgate.
- Paypal and Square lead Visa and Mastercard.
- Six Semi's Break December Highs.
 ... Big Four Retake 50-day SMAs
... The S&P 500, S&P Mid-Cap 400, S&P Small-Cap 600 and Nasdaq 100 moved above their falling 50-day SMAs and held above these moving averages last week. All four are below their 200-day SMAs and trading within the boundaries of the prior consolidation (blue outline).
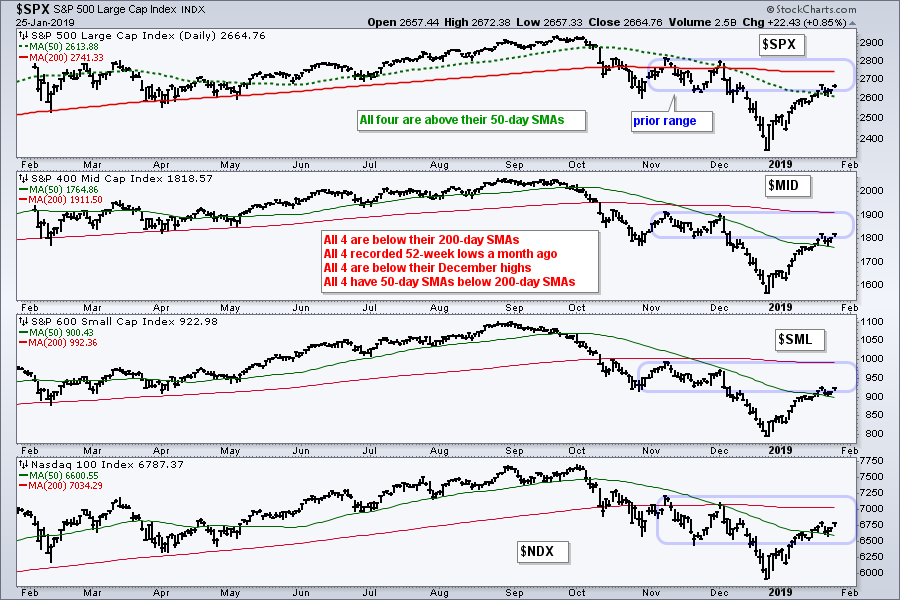
The short-term trends are clearly up and chartists can watch the 50-day SMAs for the first signs of a downturn. The November-December highs and 200-day SMAs combine to mark possible resistance just ahead. Also keep in mind that these indexes are up 13-16% over the last 21 trading days and thus quite extended.
%Above 200-day Lags for XLP
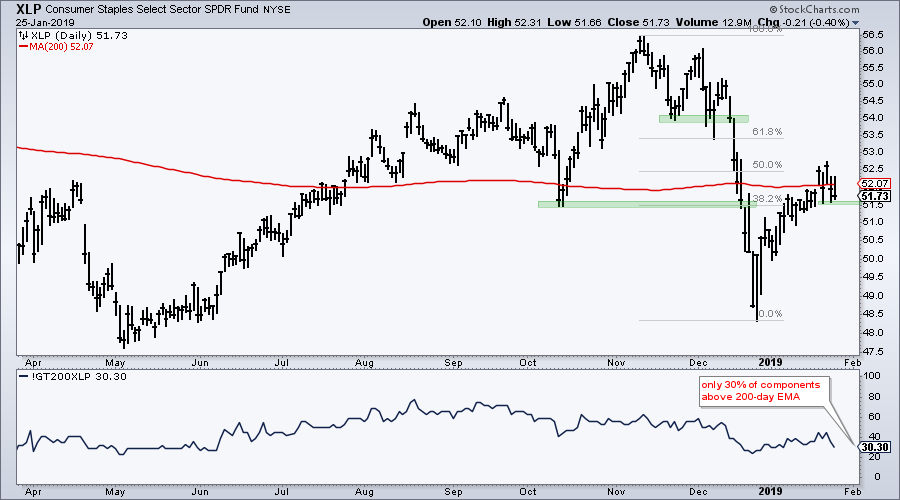
The Consumer Staples SPDR (XLP) did not partake in Friday's advance and edged lower. On the price chart, the ETF broke supports with a sharp decline in December and retraced around 50% of this decline with a bounce back to the 200-day SMA. The indicator window shows that only 30% of XLP stocks are above their 200-day EMA. This is the third lowest of the sectors. XLB (24%) and XLE (16.7%) are lower.
52-week Highs for 22 REITs
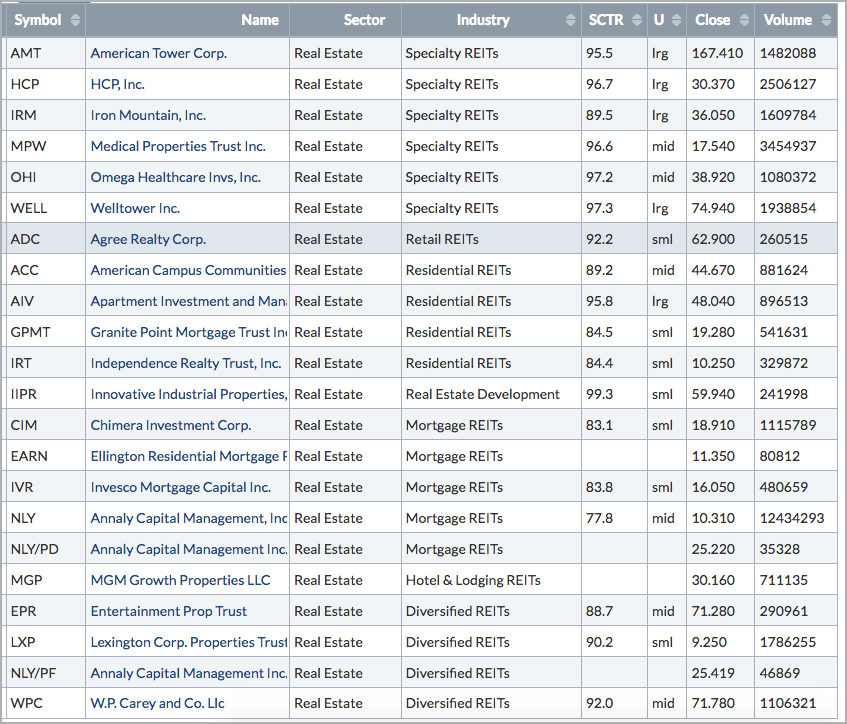
REITs are showing upside leadership with 22 hitting 52-week highs on Friday. The table below comes from the Pre-defined scans page and shows REITs from the NYSE with 52-week highs.
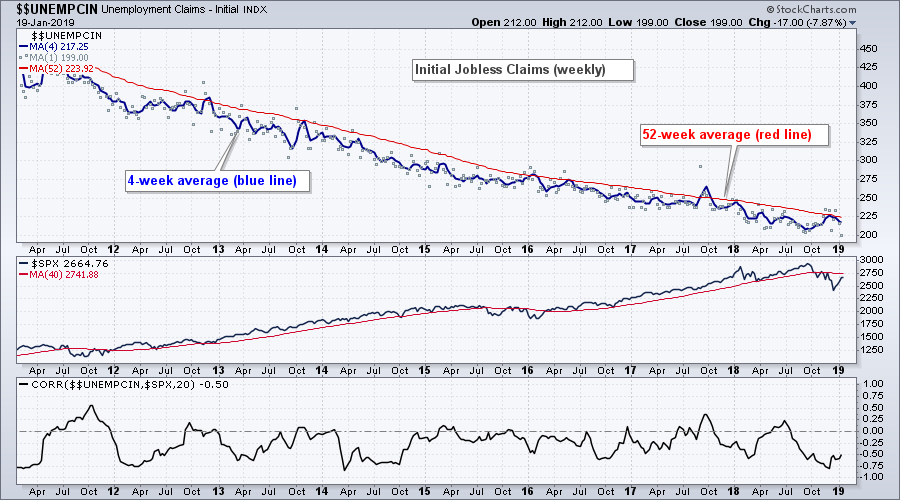
Jobless Claims Hit 40+ Year Low
It is a big week for the intermarket arena with a Fed meeting on Tuesday-Wednesday and the employment report on Friday morning. Also note that we have the ADP Employment report on Wednesday morning and initial jobless claims on Thursday morning. We can also throw in the Fed balance sheet on Thursday afternoon and ISM Manufacturing on Friday morning.
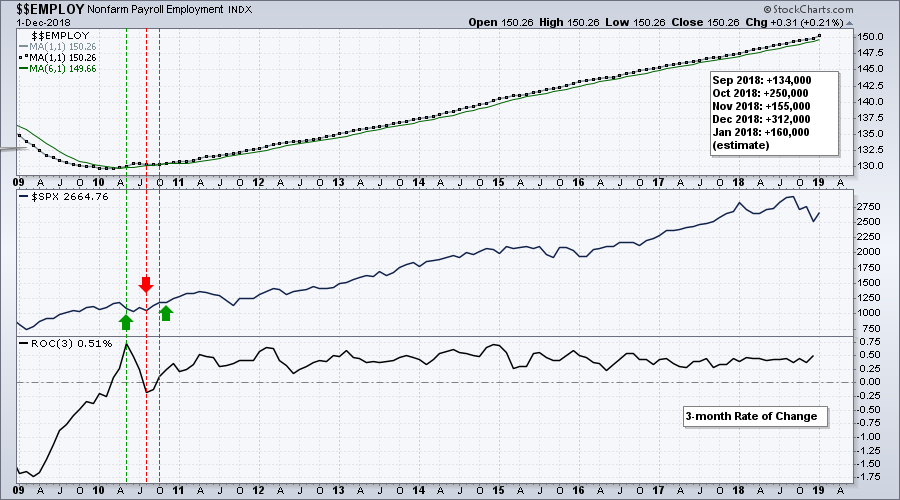
The chart below shows Non-farm Payrolls in the top window, the S&P 500 in the middle window and the 3-month Rate-of-Change in Non-farm payrolls in the lower window. Notice that the Rate-of-Change has been positive since October 2010.
The chart shows Initial Jobless Claims falling below 200,000 for the first time in over 40 years. The middle window shows the S&P 500 and the lower window shows the Correlation Coefficient. Jobless Claims and the S&P 500 are mostly negatively correlated, which means they tend to move in opposite directions.
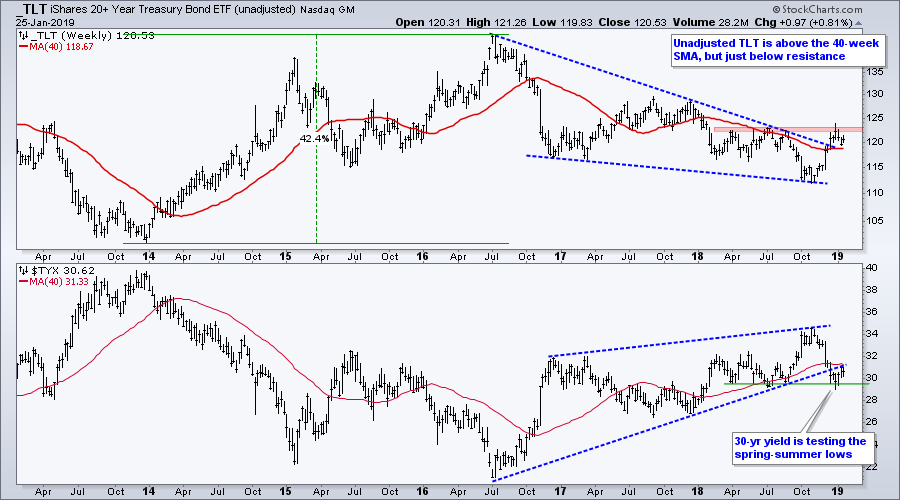
TLT Stalls between Key Levels
The weekly chart below shows unadjusted TLT breaking above the wedge line and 40-week SMA in December. TLT then hit resistance from the spring-summer highs and stalled the last five weeks. This is clearly a make-or-break zone for TLT. Further strength above the resistance zone would be bullish and reverse the two-year downtrend. A failure at resistance and move back below the 40-week SMA would reverse the short-term upswing and signal a continuation of the bigger downtrend.
Dollar Fails to Hold Breakout
A big move in Treasury yields could also affect the Dollar. The next chart shows the US Dollar ETF (UUP) breaking out of a falling flag mid week, but falling back into the flag pattern by the close on Friday. The bigger trend appears to be up and this falling flag is a bullish continuation pattern, which would be confirmed with a convincing breakout.
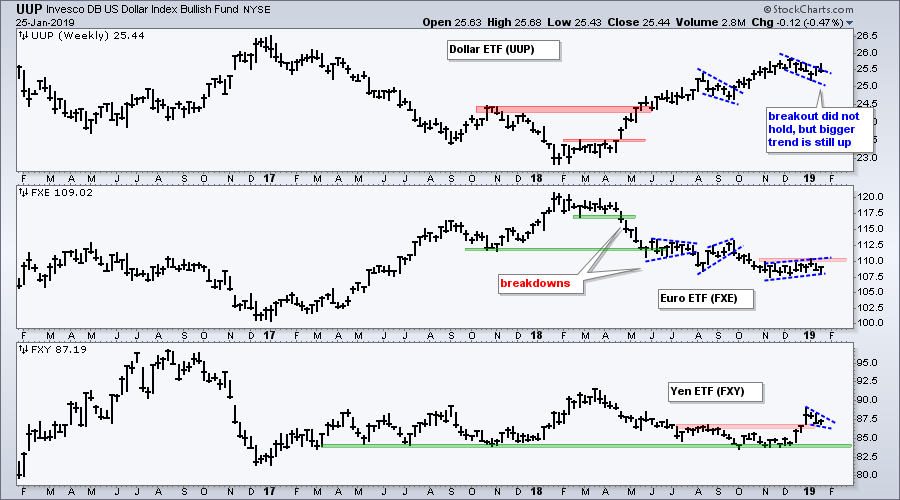
Chartists should watch the Euro ETF (FXE) for clues because the Euro accounts for 57% of the Dollar Index. FXE is in a long-term downtrend and forming a bear flag, a break of which would signal a continuation lower. The highs from November to January mark a clear resistance zone to watch for an upside breakout, which would be negative for the Dollar.
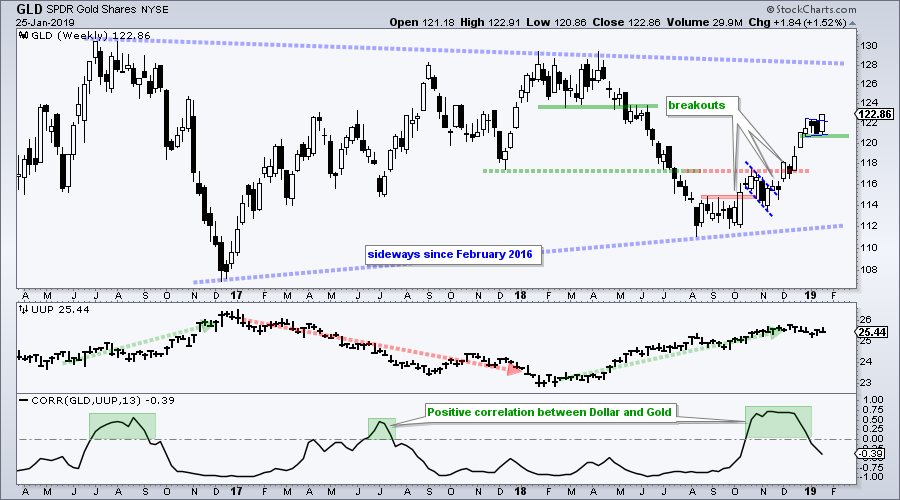
Gold Breaks out of Small Consolidation
And, of course, a move in the greenback could affect gold. The next chart shows the Gold SPDR (GLD) with three breakouts (October, November, December). Note that this upswing is within a bigger trading range and GLD is now in the upper half of this range. GLD surged 1.5% last week and broke out of a three week range, which could be considered the fourth breakout. Chartists can now mark support using the January lows. A close below 120.6 would be bearish for bullion.
Shanghai Composite Forms Potential Double Bottom
Chinese Vice Premier Liu will be in Washington on Wednesday, January 30th, for trade talks. Note that Washington is poised to increase tariffs on Chinese goods from 10% to 25% on March 1st. Thus, the outcome of these talks could affect both US and Chinese stocks. The chart below shows the Shanghai Composite ($SSEC) still in a downtrend with a fresh 52-week low in late December. The index surged over the last three weeks and a double bottom is possible. A move above the intermittent high is needed for confirmation and this would project further strength towards the 2950 area (2700 - 2450 = 250, 2700 + 250 = 2950).
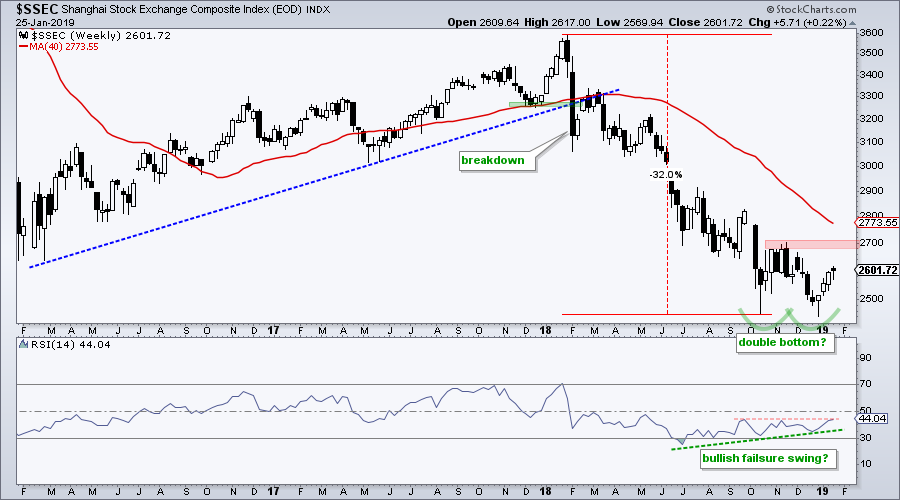
Also note that a bullish failure swing is setting up in RSI because it held above 30 in October and December. A weekly close above the September high (44.18) would complete this bullish reversal pattern, which comes from Welles Wilder himself.
Greg Schnell featured the New Oriental Education & Technology Group in DITC this weekend and he will feature other bullish setups on MarketWatchers Live (12PM ET on StockChartsTV).
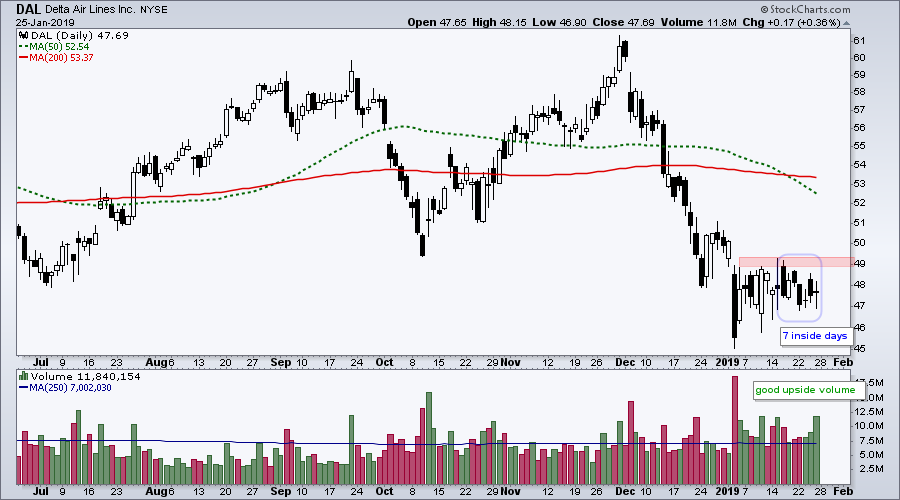
Delta Turns Indecisive
Delta (DAL) plunged in December and then firmed in January with seven inside days forming in a row. This means the high-low range over the last seven days is within the high-low range eight days ago. This shows some serious indecision and consolidation. Watch for the break.
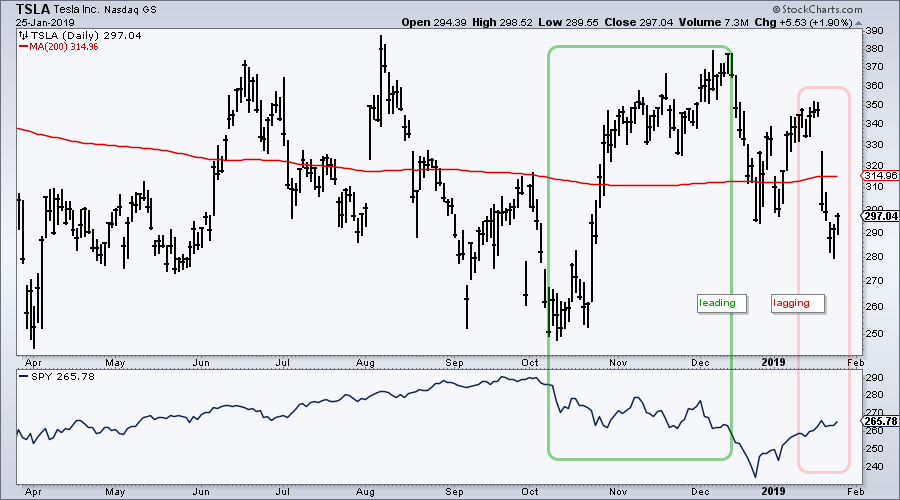
Tesla Goes from Leader to Laggard
Tesla (TSLA), which reports earnings on Wednesday, went from short-term leader to short-term laggard on its way to nowhere. The chart below shows TSLA in a trading range the past year and the stock is just below the mid point of this range. TLSA was leading from October to December with a move towards the summer highs. The stock turned laggard last week as it gapped down and broke below the late December low.
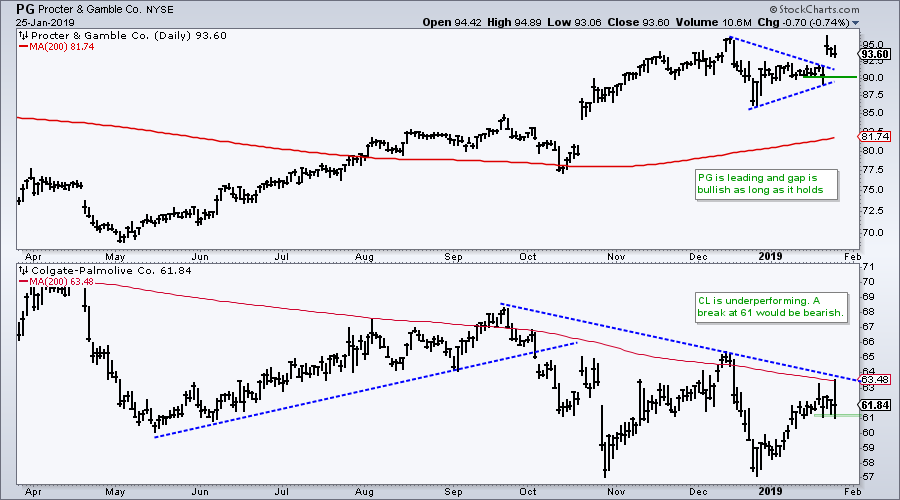
Procter&Gamble Leads Colgate
Procter&Gamble (PG) is the biggest component (14.66%) in the Consumer Staples SPDR and Colgate Palmolive (CL) is the tenth largest (3.88%). Despite similar businesses, PG is in an uptrend and CL is in a downtrend.
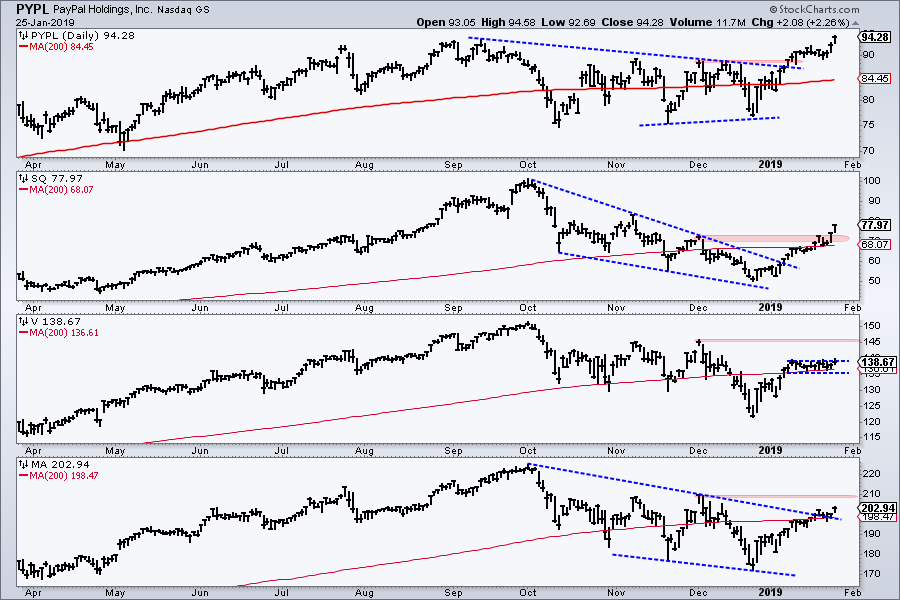
Paypal and Square lead Visa and Mastercard
Payment providers Paypal (PYPL) are Square (SQ) are leading their older counterparts, Visa (V) and Mastercard (MA). The red areas mark the early December high. Notice that Paypal was the first to break this high and Square the second. V and MA have yet to break these corresponding highs and are lagging. PYPL is the clear leader with a 52-week high last week. SQ broke above its December high last week and is playing catchup.
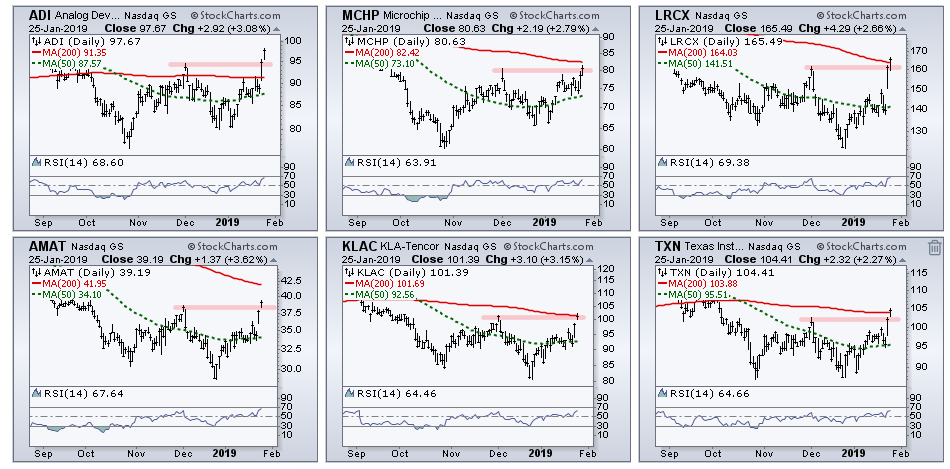
Six Semi's Break December Highs
Semiconductors stole the show last week with the Semiconductor iShares (SOXX) over 4%. The six semiconductor stocks below are showing upside leadership because they broke their December highs. Note that SPY remains below its December high.
Questions, Comments or Feedback?
I do not take symbol request and I cannot promise to response to all correspondence, but I will read it and take into under consideration. I greatly appreciate all feedback because it helps me improve the commentary and provides ideas for the future.

- Arthur Hill, CMT
Senior Technical Analyst, StockCharts.com
Book: Define the Trend and Trade the Trend
Twitter: Follow @ArthurHill


