- Big Move within Bigger Downtrend.
- The Bullish Turn of the Month.
- S&P 500 Could Challenge 200-day.
- Junk Bonds Surge to Breakdown Zone.
- Key Supports for Big Six Sectors.
- Bull Flags in ITB and XHB.
- Bonds Turning Up ahead of Fed.
- International ETFs Outperforming S&P.
 ... Big Move within Bigger Downtrend
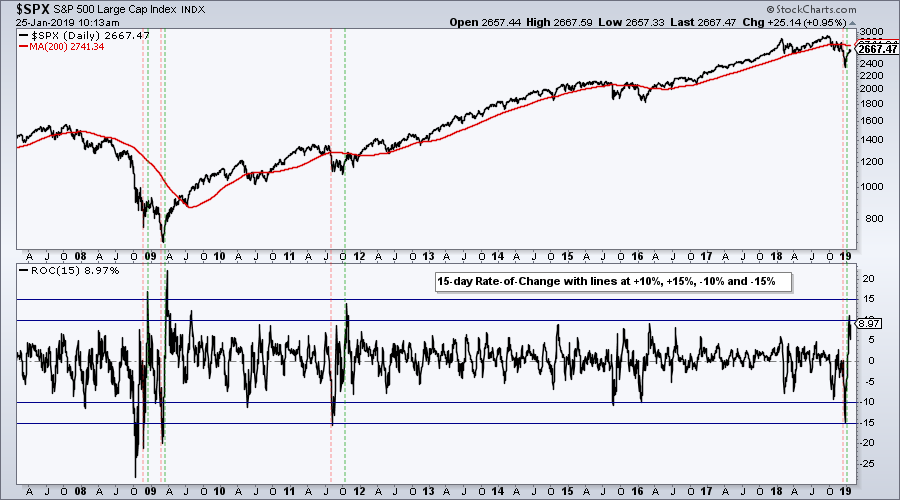
... The S&P 500 is currently in the midst of its best monthly advance since January 2018. Of course, this follows the worst monthly decline since February 2009. Perhaps the most telling sign is that the current advance has yet to fully recapture the losses from December 4th to 24th. Even though there is a good chance this advance continues another week or so, I am still not chasing it.
As far as I am concerned, chasing the U.S. market now would be like forcing a 3-point shot when you are not Steph Curry or trying to thread the needle on a touchdown pass when you are not Tom Brady. Sure, there are some individual stocks and international ETFs with strong charts, but the S&P 500, S&P Mid-Cap 400 and S&P Small-Cap 600 are still in long-term downtrends.
I am not afraid of missing out because chasing a bear market rally is not part of my overall strategy. According to the indicators I follow, the bulk of the long-term evidence remains bearish. Thus, any advance within a bearish environment is deemed a counter-trend advance, albeit one heck of an advance.
What if this rally is more than a bear market rally? If this rally turns out to be the start of a bull market, my indicators will likely turn bullish. I am not going to speculate on what-ifs and will cross that bridge when and if it gets here. At the very least, I am not chasing right now and would wait for a playable pullback. Note that I focused on playable pullbacks in Tuesday's On Trend video (click here).
The Bullish Turn of the Month
The current bounce in the stock market could extend because of a bullish short-term anomaly, the turn of the month. The turn of the month is the 8-day Rate-of-Change from the last four trading days of the month to the first four trading days of the next month. The chart below shows the last three: two were up and one was down.
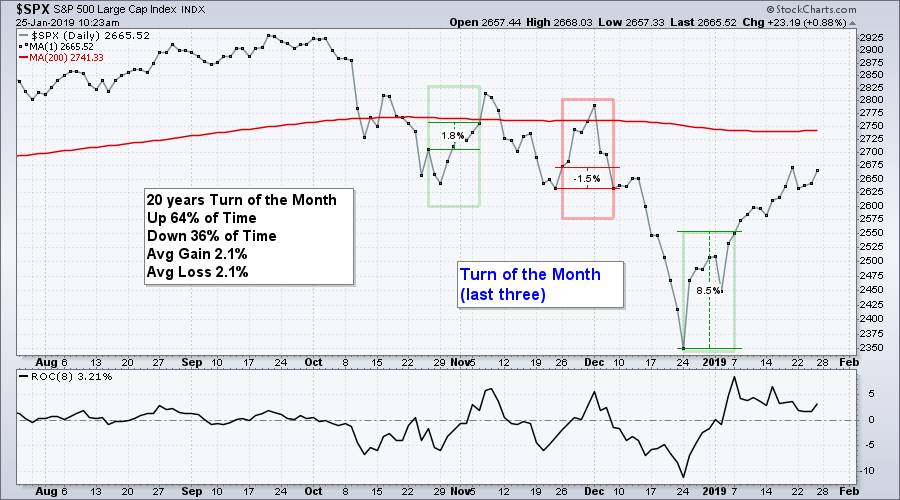
Over the last twenty years, the S&P 500 has closed higher 64% of the time during this 8-day period. As the table below shows, the average gain was pretty much the same as the average loss, but the high Win Percent resulted in a profitable system. Chartists trading this system would have a Compound Annual Return of 6.49% (sans dividends) and be invested just 38% of the time.
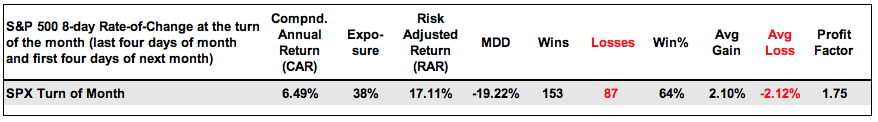
Those looking for fundamental reasons for this phenomenon can consider end of month window dressing for portfolio managers and inflows, which are often put to work at the beginning of the month. There could also be algo traders front-running the beginning of the month by buying at the end of the prior month.
S&P 500 Could Challenge 200-day
The S&P 500 surged above its 50-day SMA last week and then fell back on Tuesday. Instead of continuing lower after Tuesday's setback, the index firmed the last two days and moved higher on Thursday. The bulls are not backing down and this means we could see a challenge to the 200-day SMA, especially with the turn of the month at hand.
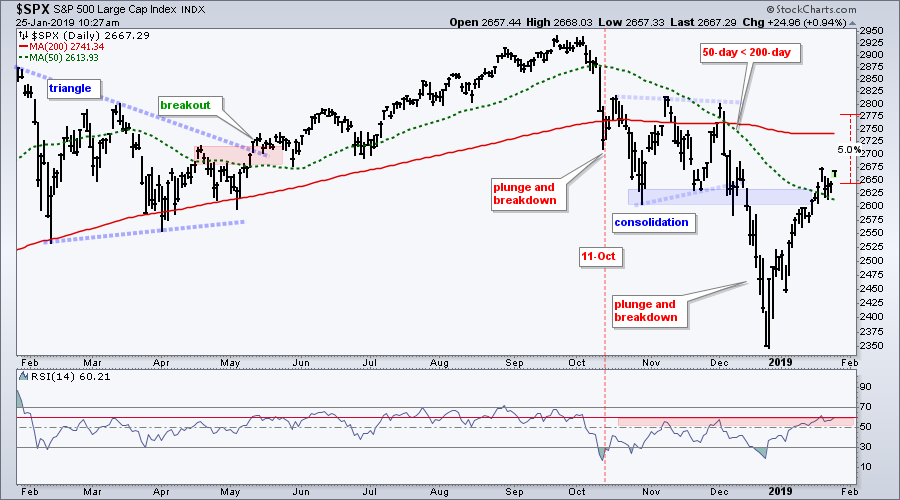
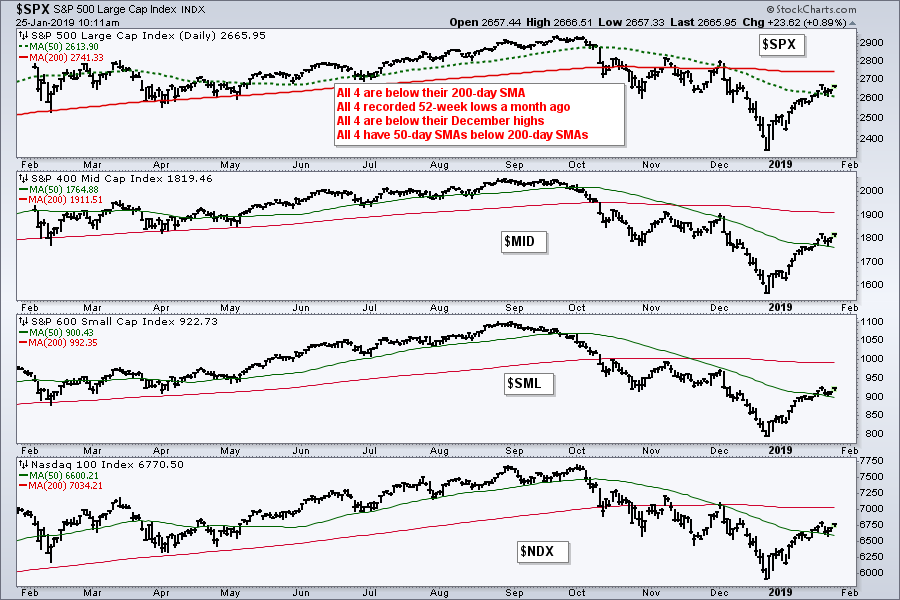
While a challenge to the 200-day is possible, it is still hypothetical and my current market stance has not changed. The S&P 500 is below the 200-day SMA, the 50-day SMA is below the 200-day SMA, the index recorded a 52-week low a month ago and the current advance is still smaller than the prior decline (early December to late December).
Furthermore, less than 40% of stocks in the S&P 1500 are above their 200-day EMAs and there were just 24 new highs on Thursday (out of 1500 stocks). Even though these breadth indicators have improved, they are quite far from bullish signals. I would like to see 60% of stocks above their 200-day EMAs and 10% of stocks hitting new highs to turn bullish. Thus, my broad market stance remains bearish and the current advance is considered a counter-trend bounce until further notice.
Junk Bonds Surge to Breakdown Zone
The unadjusted High-Yield Bond ETF (_HYG) broke down in October and plunged in December, along with the stock market. HYG rebounded over the last five weeks with a surge back to its support break and 40-week SMA. This surge in junk bonds provided a risk-on component to the stock market rebound over the last few weeks. Strength in junk bonds means credit spreads are narrowing between junk bond yields and treasury yields. This also means credit conditions are loosening and this is positive for risk assets.
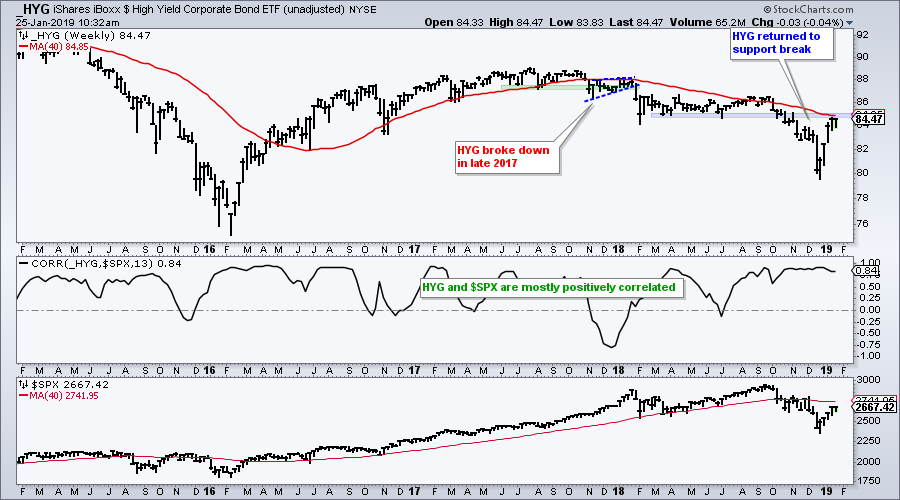
The middle window shows the Correlation Coefficient between the Junk Bond ETF and the S&P 500. Notice that it is mostly positive, which means these two tend to move in the same direction. As with $SPX, I am not turning bullish on junk bonds just yet. The current bounce, while impressive, simply returned to the last support break. The bigger trend here is still down.
Key Supports for Big Six Sectors
The next chart shows the six biggest sectors with the 200-day SMA. These six account for 78% of the S&P 500 and five are below their 200-day SMAs (~63% of SPX). The red zones mark the December highs (resistance) and the green zones mark the mid January lows (support). The Health Care SPDR (XLV) is the only sector above its 200-day SMA.
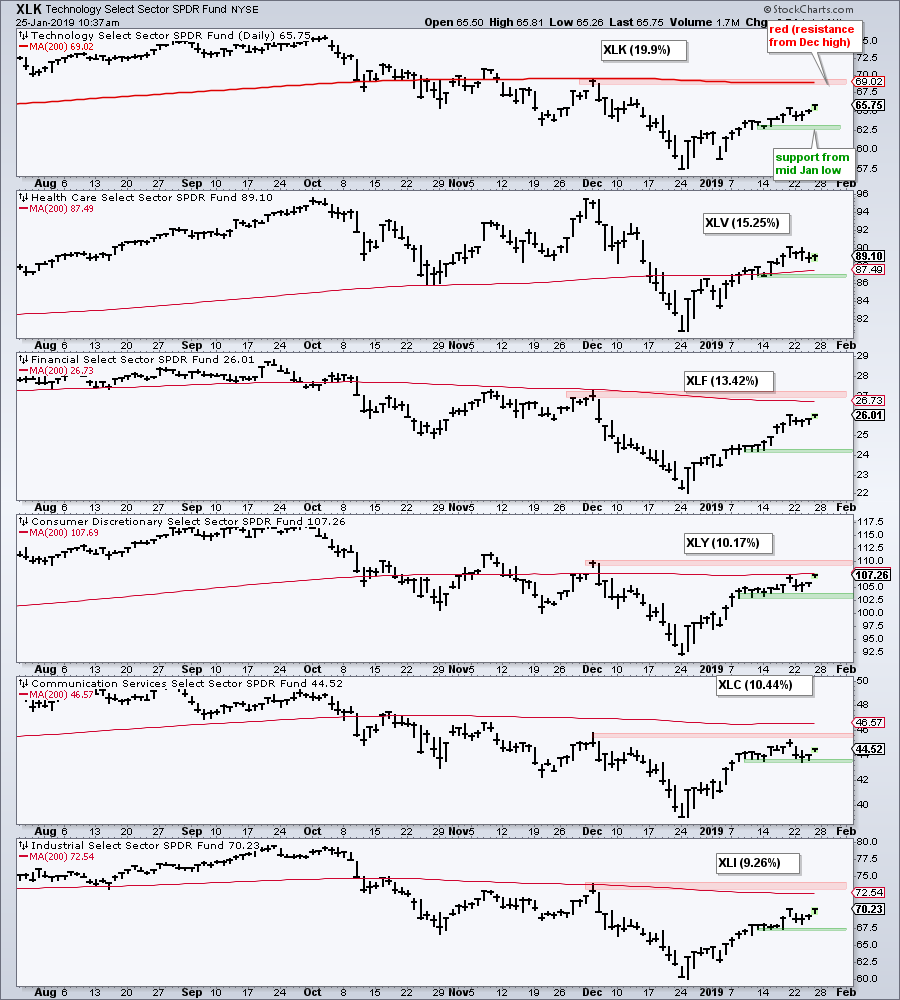
I am particularly watching short-term support levels for the Technology SPDR (XLK), Consumer Discretionary SPDR (XLY), Communication Services SPDR (XLC), Health Care SPDR (XLV) and Industrials SPDR (XLI). The short-term uptrend in SPY can continue as long as these five hold support. The broad market uptrend would become vulnerable to a reversal if these sectors start breaking support.
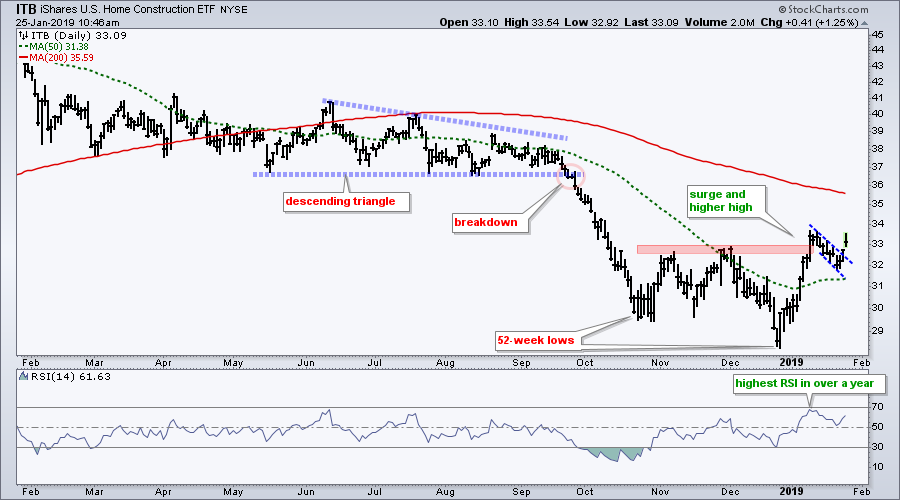
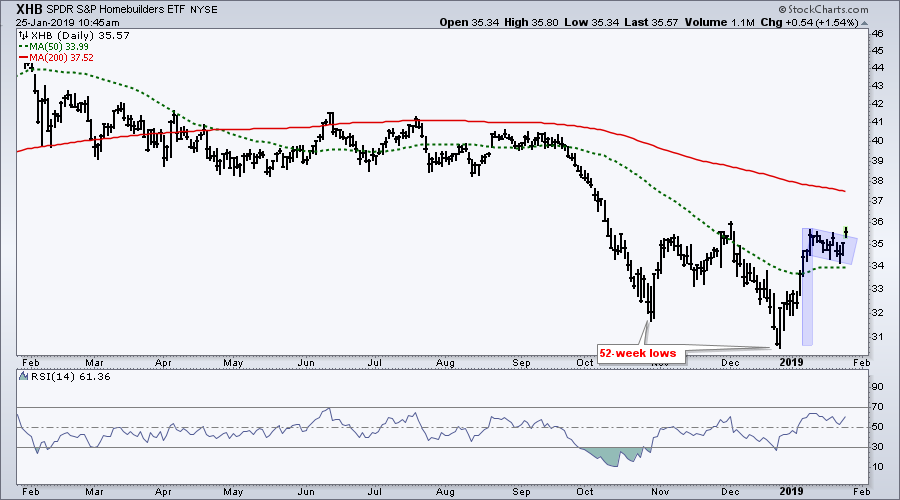
Bull Flags in ITB and XHB
The next two charts highlight bull flags in the Home Construction iShares (ITB) and the Home Builders SPDR (XHB). These are short-term bullish setups, but keep in mind that the long-term trends are still down and the market environment is still dicey. ITB surged above its early December high and showed leadership in early January. The pullback over the last two weeks looks like a bull flag and ITB broke out with a surge on Thursday. XHB is not quite as strong as ITB, but also has a bull flag working.
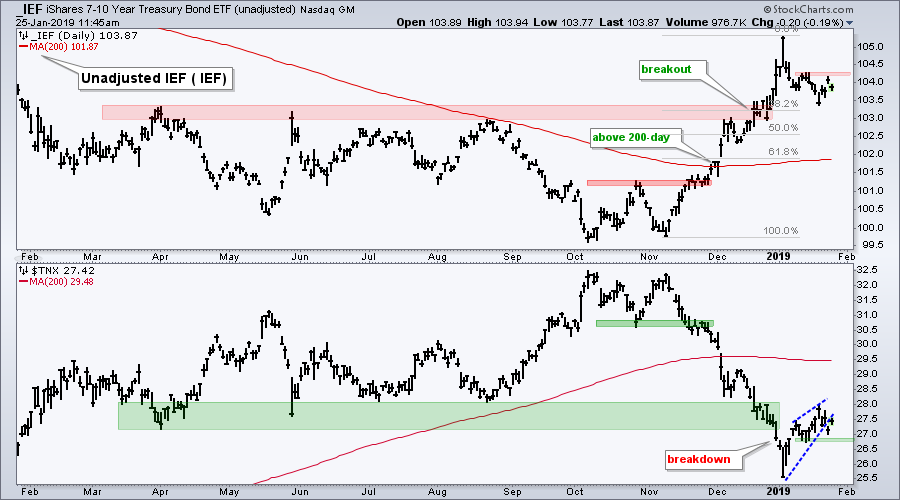
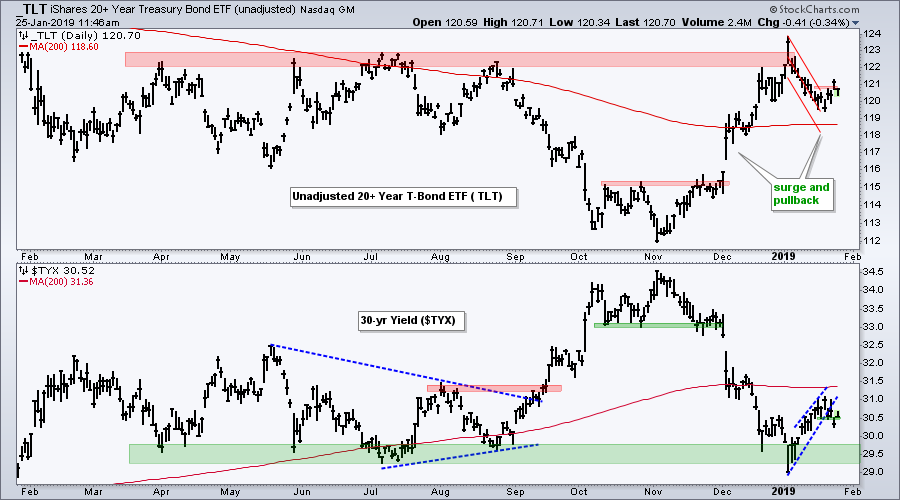
Bonds Turning Up ahead of Fed
Next week will be big for the bond market with a Fed meeting and the employment report. I have no clue what the Fed will say/do or the market's reaction (ditto for employment report). Bonds turned up on Wednesday with small breakouts in the 7-10 YR T-Bond ETF (IEF) and 20+ YR T-Bond ETF (TLT). The first chart shows IEF with a three upside breakouts from early November to early January and a pullback that retraced 38% into January. I think this is a pullback within a bigger uptrend and expect an upside breakout. IEF turned up this week and a break above the mid January high would be bullish.
The second chart shows TLT surging from 112 to 124 and then pulling back to the 119.50 area last week. The ETF bounced this week and is attempting to break out of a small Raff Regression Channel (red lines).
International ETFs Outperforming S&P
The next charts show some international ETFs that I have been following. Their charts are stronger than the S&P 500 SPDR (SPY) because they held above their October lows in December and broke above resistance levels. SPY, in contrast, formed a lower low in December and remains below its December high (and below its 40-week SMA).
Before reviewing these charts, keep in mind that the country ETF is powered by its currency and the local stock index. Strength in the currency relative to the Dollar is positive for the ETF. Strength in the local stock index also positively affect the ETF. Weakness in the currency and/or index adversely affects the ETF.
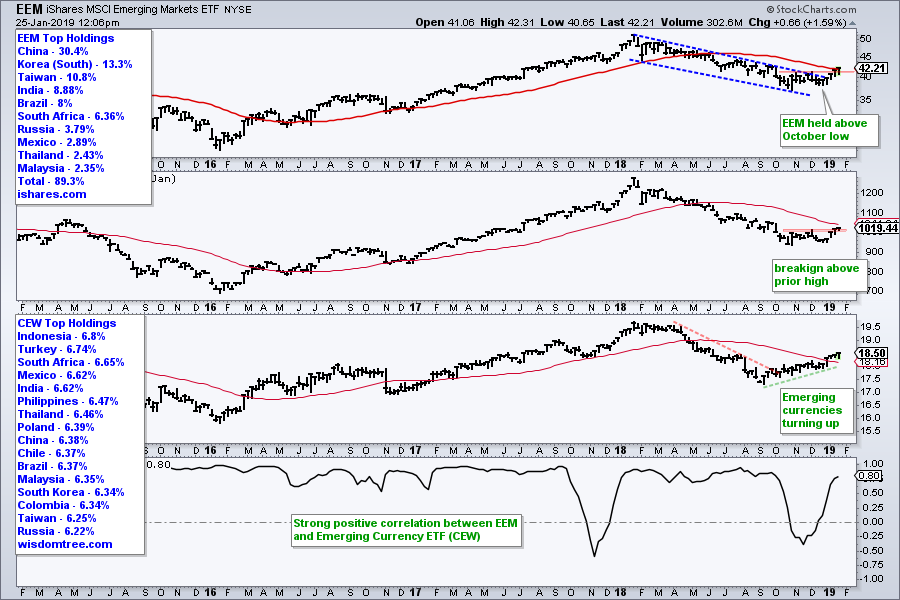
The Emerging Markets ETF (EEM) broke out of a falling channel and edged above its prior peak last week (red line). The ETF is also right at its 40-week SMA. The second window shows the underlying index and the third window shows the Emerging Currency ETF (CEW), which has been moving higher since September. Notice the strong positive correlation between EEM and CEW. Strength in emerging currencies is more important to EEM than a weak Dollar (UUP). Note Dollar/Euro accounts for 57% of UUP.
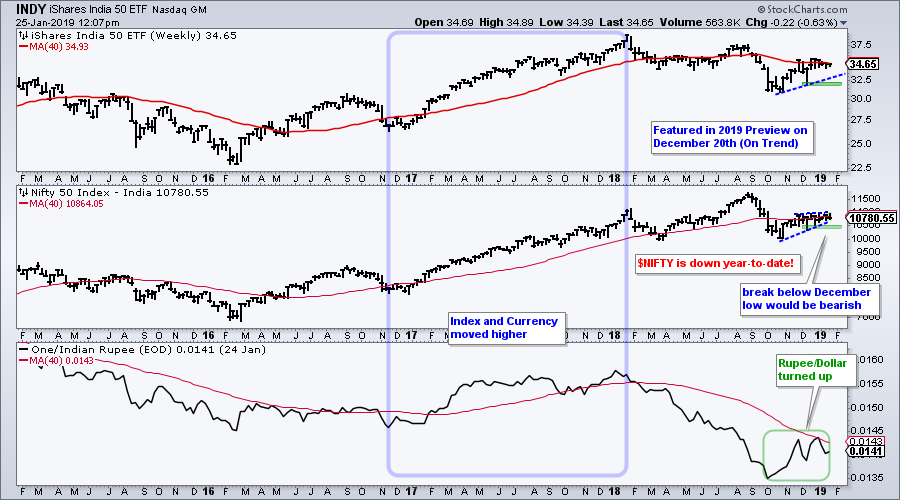
The iShares S&P Nifty 50 ETF (INDY) has yet to break down, but recent performance for the India Nifty 50 Index ($NIFTY) is underwhelming. $NIFTY (middle window) continues to hover around its 40-week SMA with a rising wedge. The index is down .75% month-to-date and lagging much of the world. A break below the December low would reverse this fragile upswing and signal a continuation of the Sep-Oct decline. Such a move would be negative for the ETF.
The New Zealand iShares (ENZL) continues to act well with a break out of a consolidation pattern. The ETF broke out three weeks ago and continues to hold this breakout. The New Zealand 50 Index ($NZ50) is above its 40-week SMA and above its November high.
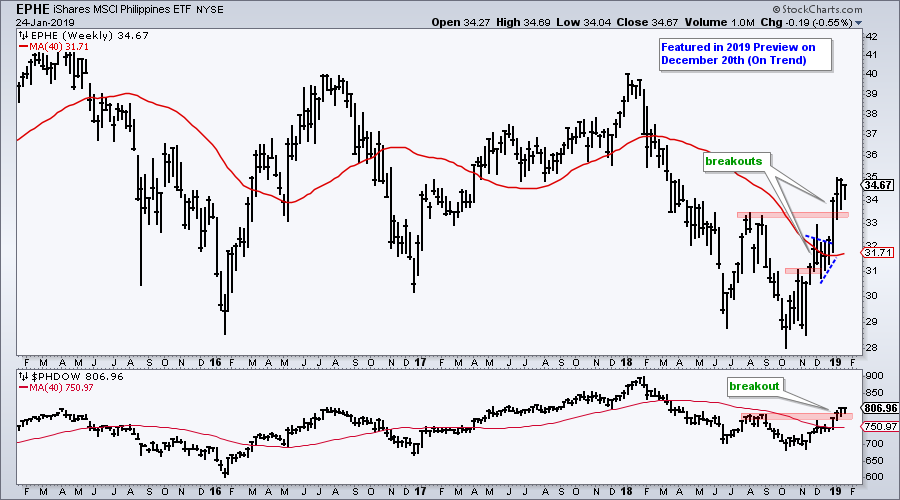
 The Philippines iShares (EPHE) hit a new low in October, but started outperforming with breakouts in November and December. This continued into January as the ETF moved above its summer highs. This is clearly one of the stronger international ETFs over the last three months. The lower window shows the DJ Philippines Index ($PHDOW) with a break above its summer highs this month.
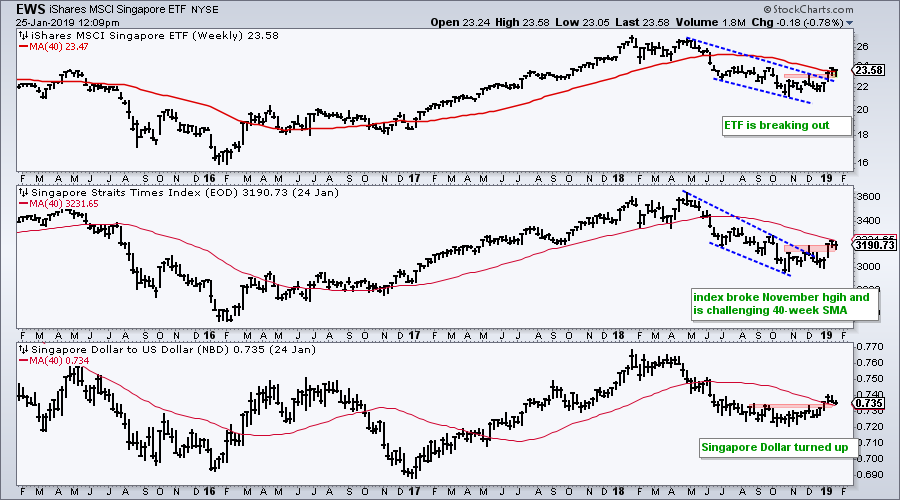
The Singapore iShares (EWS) broke out of a channel and exceeded its November high this month. The ETF fell back a little this week, but the breakout is still there. I am also seeing breakouts in the Singapore Strait Times ($STI) and the Singapore Dollar ($SGDUSD).
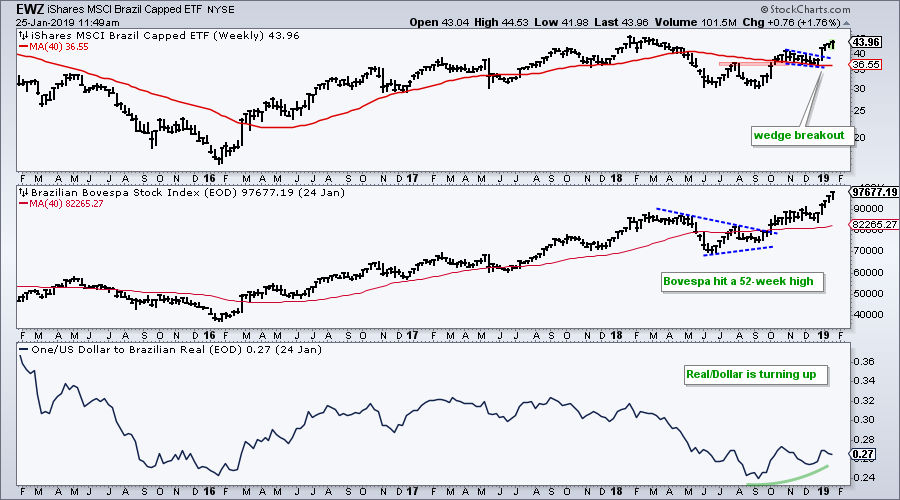
The Brazil iShares (EWZ) broke out of a falling wedge four weeks ago and remains strong. The Bovespa ($BVSP) is even stronger with another 52-week high this week. The Real/Dollar, which is shown by inverting Dollar/Real ($ONE:$USDBRL) has been largely flat since June. Thus, the strong stock market is bullish for the ETF and the flat currency is neutral.
Art's Charts ChartList
This week's ChartList contains the key breadth charts with the nine indicators, the commodity ETFs I am following, the international ETFs and the growth stocks.
Questions, Comments or Feedback?
I do not take symbol request and I cannot promise to response to all correspondence, but I will read it and take into under consideration. I greatly appreciate all feedback because it helps me improve the commentary and provides ideas for the future.

Plan Your Trade and Trade Your Plan.
- Arthur Hill, CMT
Senior Technical Analyst, StockCharts.com
Book: Define the Trend and Trade the Trend
Twitter: Follow @ArthurHill


