- Moving into the Prior Battle Zone.
- Pennant versus Gap for SPY.
- Lowest Close in two Weeks for QQQ.
- IWM Holds Up the Best.
- Divide and Conquer with Sector Analysis.
 ... Moving into the Prior Battle Zone
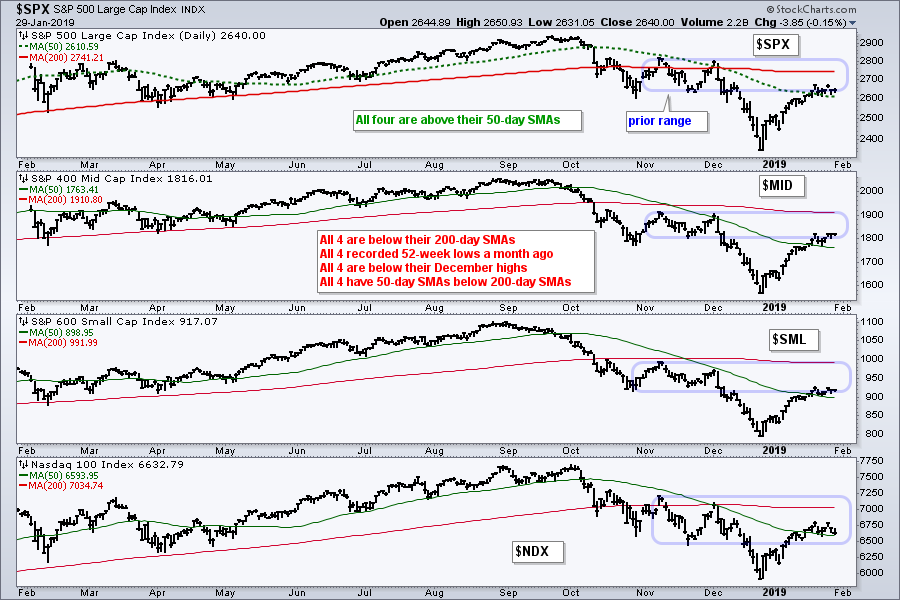
... It's a mixed-up world out there as two trends compete and the major index ETFs trade sideways. First and foremost, the long-term trend is down because the major stock indexes hit 52-week lows in late December and remain below their prior peaks (early December). All four indexes shown below are also below their 200-day SMAs and their 50-day SMAs are below their 200-day SMAs. Thus, the long-term evidence favors the bears. The blue zones on each chart mark the prior consolidations for reference. This is the scene of the last battle zone and it is shaping up as the current battle zone. On guard!
Pennant versus Gap for SPY
Short-term, all four indexes are in uptrends and above their 50-day lines. I will now turn to the S&P 500 SPDR (SPY), Nasdaq 100 ETF (QQQ) and Russell 2000 iShares (IWM) for short-term analysis. And it is also mixed. SPY and QQQ gapped down on Monday and these gaps are holding. It is possible that SPY is forming a pennant and a breakout would argue for an extension of the short-term uptrend. Note that this would still not be enough to turn long-term bullish.
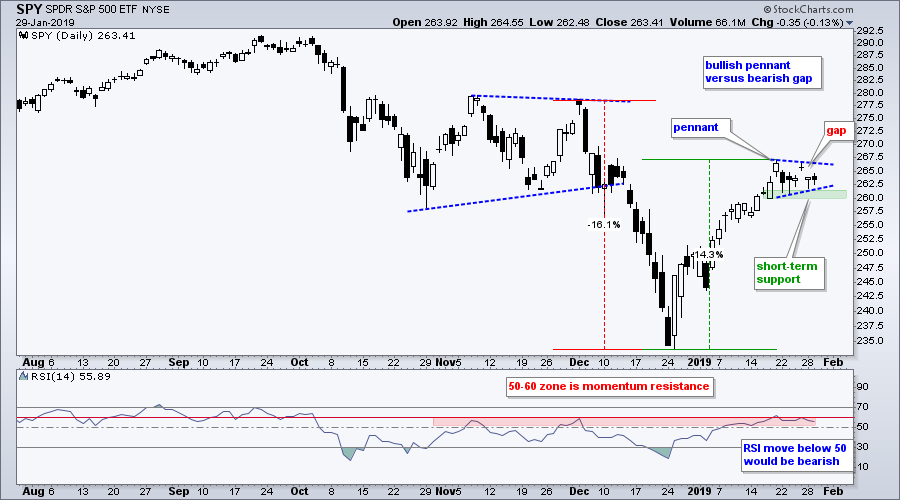
With the short-term trend up and support holding, I still have a short-term bullish bias on SPY. A break below support and RSI move below 50 would negate the pennant and reverse the short-term uptrend. At the very least, such a move would call for a 50% retracement of the prior advance. With the long-term trend still down, this could also pave the way to a test of the December lows or worse. One bridge at a time.....
Lowest Close in two Weeks for QQQ
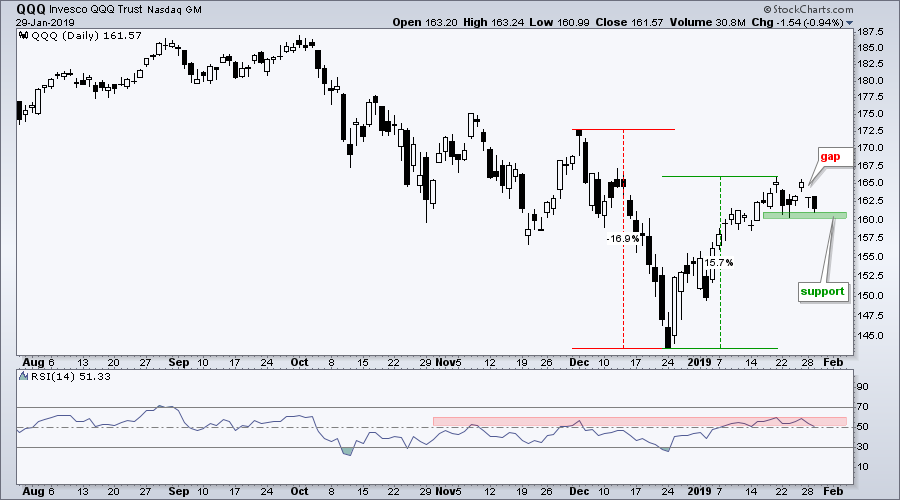
QQQ is weaker than SPY because it closed at its lowest level since January 15th. Also notice there are two gap-up/gap-down reversals in the last two weeks. Despite this short-term noise, support in the 160-161 area is still holding. Watch for a break below support and an RSI move below 50 to reverse the short-term upswing.
IWM Holds Up the Best
The Russell 2000 iShares (IWM) is holding up the best of the three. First, IWM surged 17.8% and this is the biggest advance of the three. Second, notice that IWM edged lower for two days last week and then broke out of a small flag with a gap up on Friday. Third, notice that this gap is holding. Thus, IWM has a short-term bullish breakout in play.
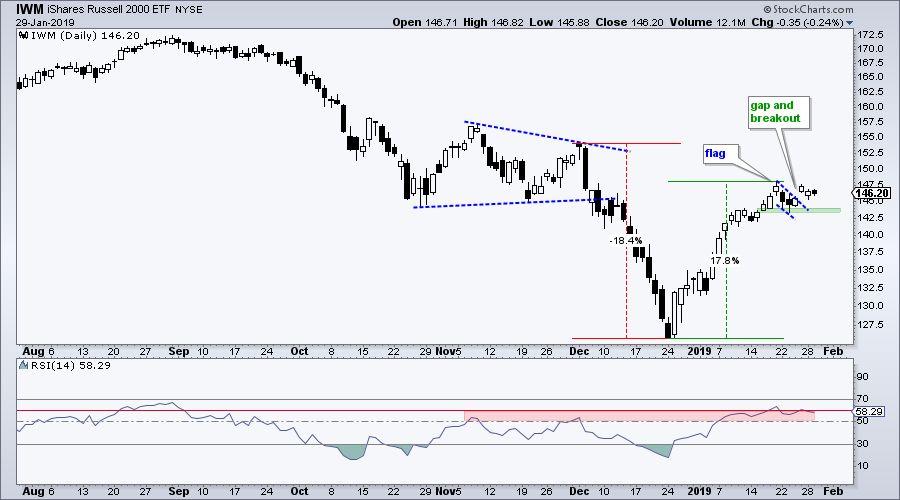
Chartists can watch these three ETFs for clues on the short-term. An upside breakout in SPY would be bullish for the market and IWM could lead another swing higher. The green zones mark short-term support for all three. Support breaks by two of the three would be short-term bearish for the broader market. And finally, RSI is above 50 for all three ETFs. This means the momentum cup is half full. A move below 50 would signal a downturn in momentum.
As noted in Friday's commentary, we are also in the "turn of the month" phase for the stock market. Historical tendencies show a bullish bias over the eight day period at the turn of the month, which is the last four days of the month and the first four days of the prior month. Window dressing and fresh in-flows could keep markets buoyant for a few days and we might not see a bearish reversal until early February.
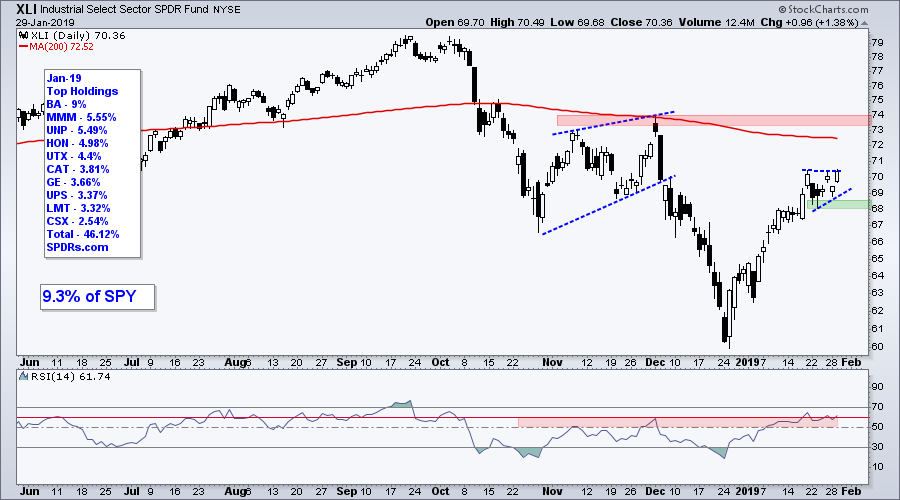
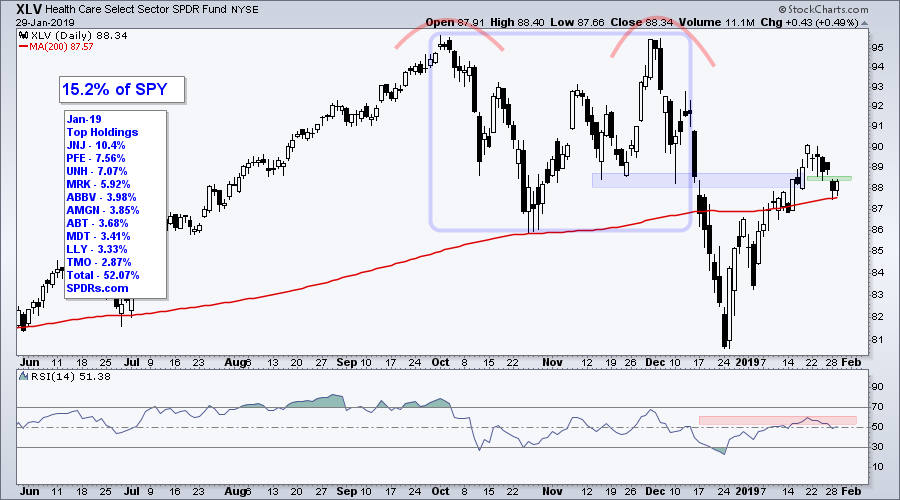
Divide and Conquer with Sector Analysis
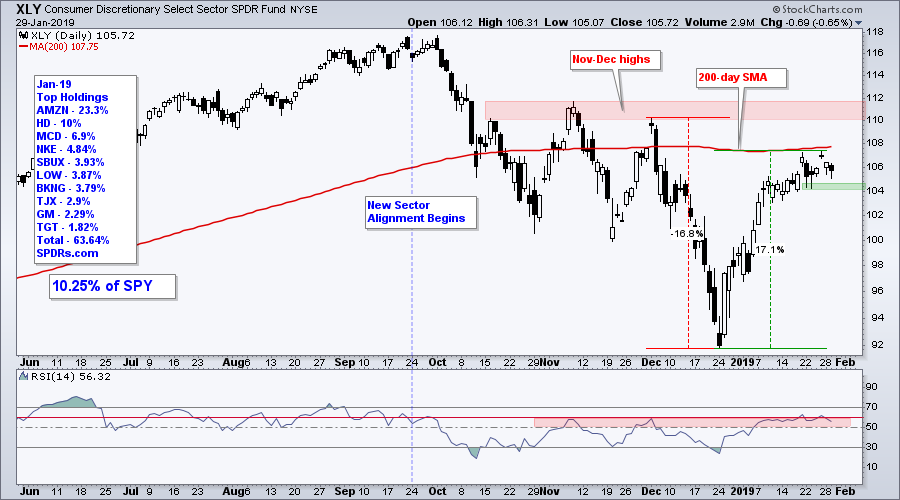
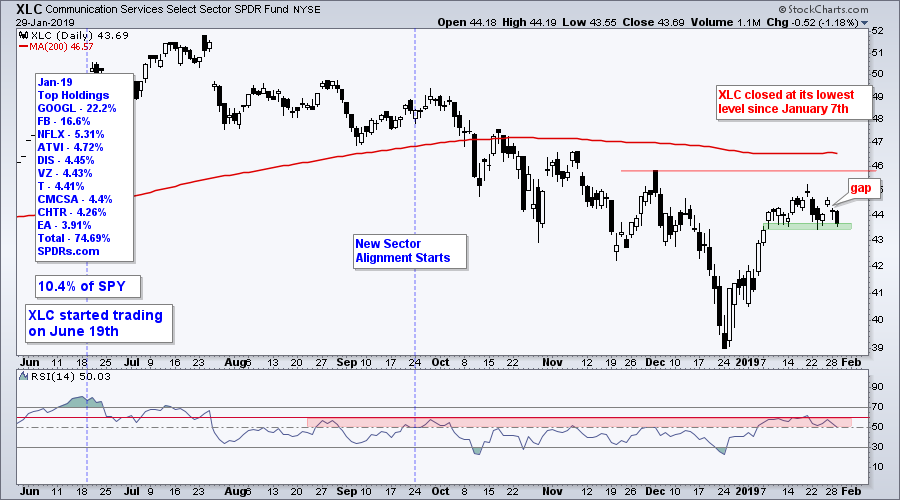
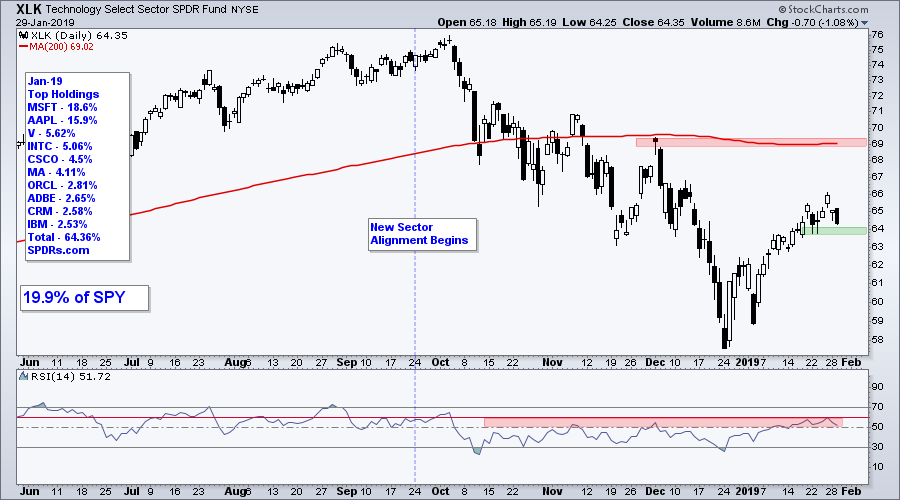
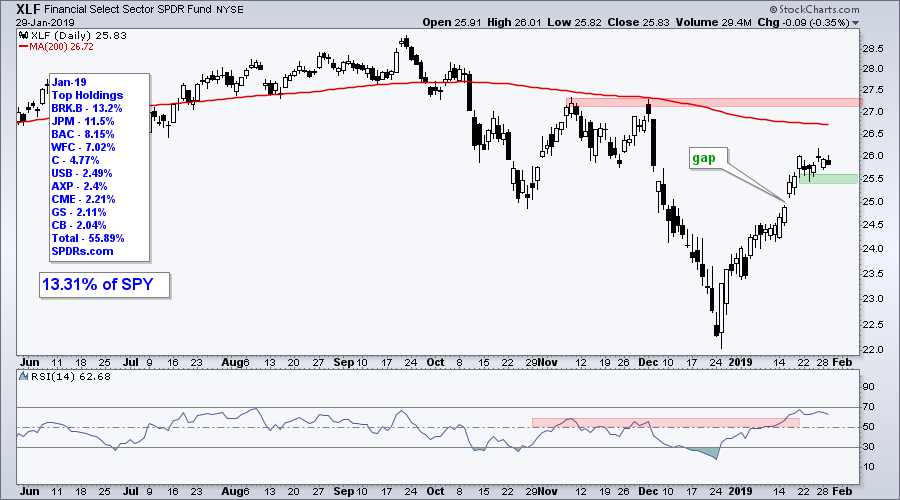
SPY can be divided into 11 sectors and the top six sectors account for around 78% of SPY (XLK, XLV, XLF, XLY, XLC, XLI). This leaves the remaining 22% to be divvied up among the other five (XLP, XLE, XLB, XLRE, XLU). As far as broad market influence is concerned, we only need to watch the top six sectors. Thus, the next six charts show short-term support levels to watch going forward for these six. Five of the six are in short-term uptrends and supportive of the short-term uptrend in SPY. XLV is the only one with a support break. XLC is the second weakest because it closed at its lowest closing level since January 7th. The trouble starts when/if we see short-term support breaks in three of the six.
On Trend on YouTube
Monitoring Precarious Cross Currents
- Short-term Breadth Indicators Holding Up
- A Battle Royal Between Two SMAs
- Going Nowhere with 4 Gaps in 6 Days
- Key Supports for Sector and Industry ETFs
- Bonds, Dollar, Gold and Oil
- Click here to Watch
Questions, Comments or Feedback?
I do not take symbol request and I cannot promise to response to all correspondence, but I will read it and take into under consideration. I greatly appreciate all feedback because it helps me improve the commentary and provides ideas for the future.

- Arthur Hill, CMT
Senior Technical Analyst, StockCharts.com
Book: Define the Trend and Trade the Trend
Twitter: Follow @ArthurHill


