- Putting the Bounce into Perspective.
- 23-day Performance Overshadows 9-day Surge.
- 40 Years of the Zweig Breadth Thrust.
- AD Percent for $SPX, $MID and $SML.
- A Weight of the Evidence Approach.
 ... Putting the Bounce into Perspective
... As of Tuesday's close, the S&P 500 is up a whopping 9.5% in the last nine trading days. It is an extraordinary run on its own, but still lacking when taken in context. Don't forget that the index was down 15.7% over the fourteen day period prior to this advance. In addition, the index is still some 7.6% below its early December close and down 7.74% over the last 23 days. This 23 day period includes both the 14-day December decline and the 9-day surge.
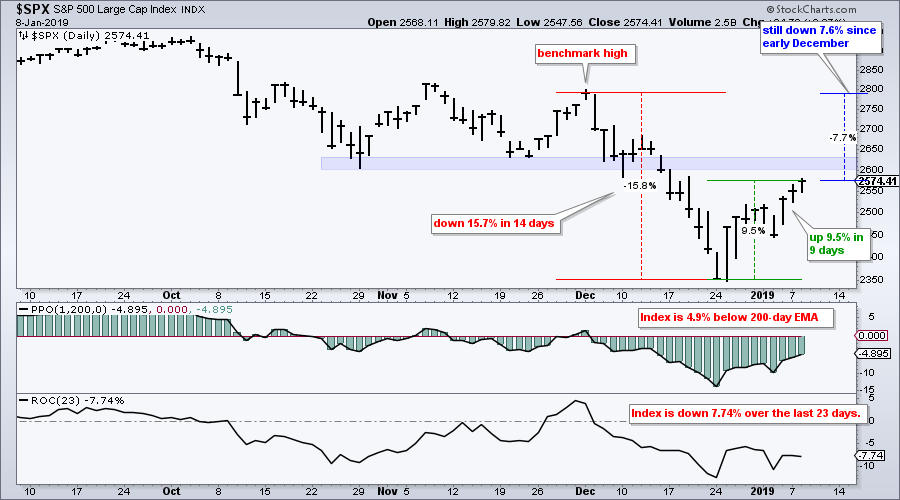
The broken support zone in the 2600-2630 area turns into first resistance. This area also marks a 50-61.8% retracement of the December decline. Thus, the current bounce is nearing its first test. The indicator window shows that the index is still around 5% below the 200-day EMA (PPO(1,200,0) is negative).
23-day Performance Overshadows 9-day Surge
The December high is a benchmark high that we can use to compare chart performance. Stocks and ETFs trading above this high are clearly outperforming, on both a relative and absolute basis. In addition, chartists can use the 23-day Rate-of-Change to see which stocks are holding up during this period. I ran a couple scans to see how stocks overall were performing. As of Tuesday’s close, 492 stocks in the S&P 500 are up over the last nine days and 414 are up more than 5%. However, note that 468 stocks are down over the last 23 days and 356 stocks are still down more than 5%. The scan screen shot shows results for stocks that are up over the last 23 days. These are the true leaders.
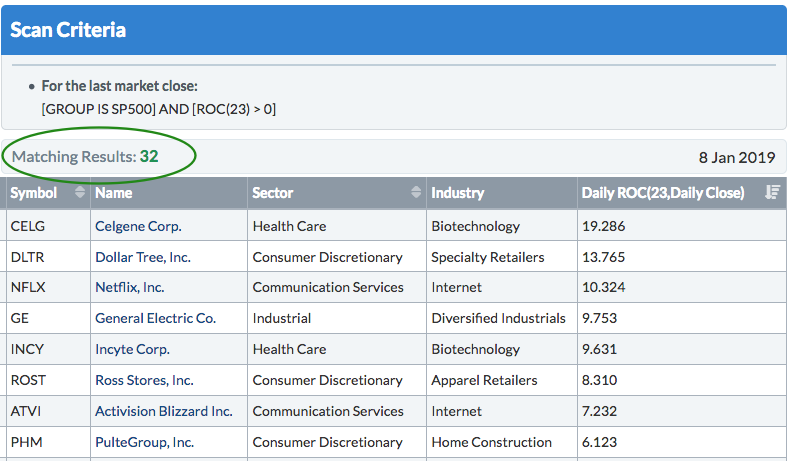
Scan Code:
[group is SP500]
and [ROC(23) > 0]
Rank by ROC(23)
You can change SP500 for SP400, SP600 or NASDAQ100. Chartists can also change the greater-than symbol to the less-than symbol to scan for losers. The "0" can be adjusted to set a higher or lower threshold (ROC(23) < -5 or ROC(23) > 5). And finally, the last line uses "Rank by" and an indicator to sort the results based on this indicator value.
40 Years of the Zweig Breadth Thrust
I covered the Zweig Breadth Thrust (ZBT) in Tuesday's On Trend show. The ZBT values were still based on the 4-Jan close so the bullish signal did not appear during the show. These indicators updated just after I made the video and a bullish signal triggered with the move above .615 on Monday.
Based on the 10-day EMA of NYSE Advances/(Advances+Declines), a bullish signal occurs when ZBT moves from below .40 to above .615 in 10 days or less. Note that this is the fifth bullish signal since early 2009 and three of these five occurred in October.
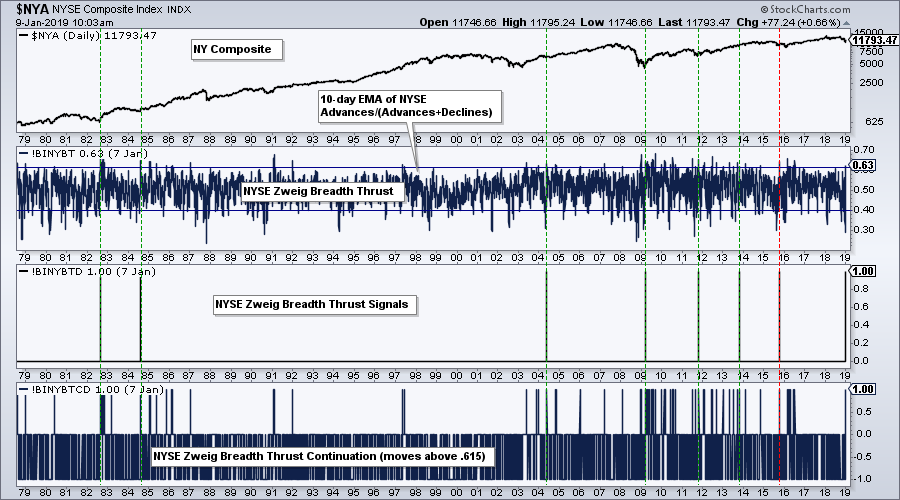
Couple of items to note. First, there have been just 8 signals in the last forty years. Second, the NY Composite moved to a new low after the signal in October 2015 (red line). Third, this indicator is just based on stocks in the NYSE. The S&P 500 has 132 Nasdaq stocks (26.4%), the S&P Mid-Cap 400 has 127 Nasdaq stocks (31.75%) and the S&P Small-Cap 600 has 317 Nasdaq stocks (52.8%). More than half the stocks in $SML are from the Nasdaq.
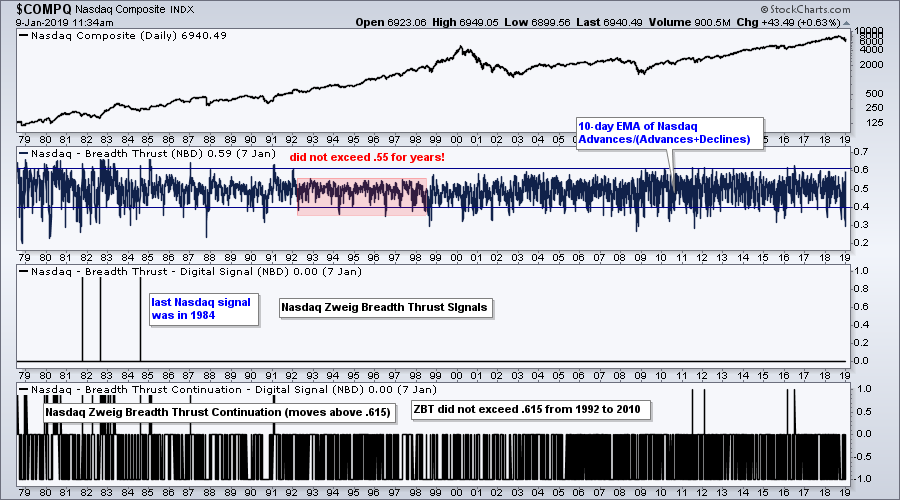
StockCharts calculates and publishes this same indicator for the Nasdaq, but it has not triggered a signal since 1984 and there have only been three signals in the last forty years. Notice that the 10-day EMA of Advances/(Advances+Declines) did not exceed .55 for over six years (1992 to 1997) and did not exceed .615 for 18 years (1992 to 2010). Moves above .615 are signaled when the ZBT Continuation indicator moves to 1 (bottom window). Clearly, some tweaking is needed for these signals.
AD Percent for $SPX, $MID and $SML
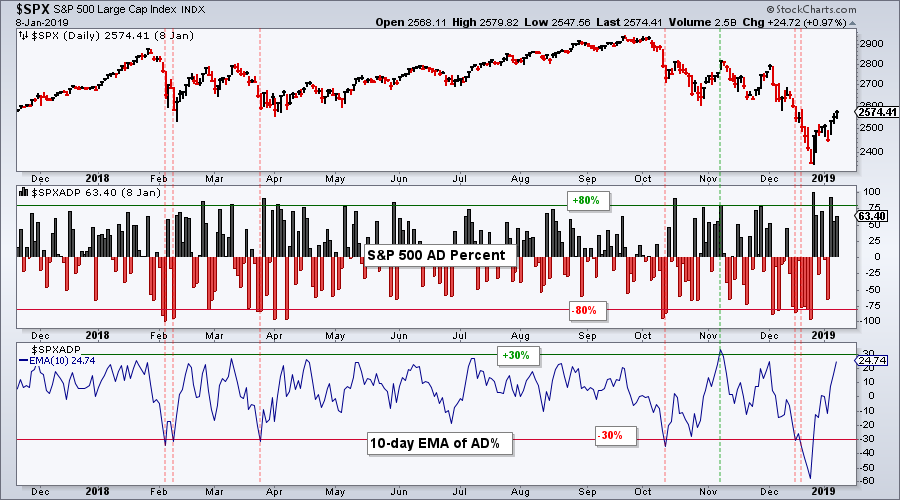
AD Percent for the S&P 500, S&P Mid-Cap 400 and S&P Small-Cap 600 is still my preferred indicator for a breadth thrust, both up and down. These indicators are based on stocks in their respective indexes and we can compare signals against price action. A bullish breadth thrust occurs when the 10-day EMA of AD Percent exceeds +30% and a bearish thrust occurs with a move below -30%.
The chart below shows an example with the S&P 500. Daily S&P 500 AD Percent ($SPXADP) values are shown in the middle window (histogram) and the 10-day EMA is shown in the lower window. In the past year, there have been six moves below -30% and just one above +30% (7-Nov). The indicator surged to 24.74% this week, but has yet to trigger a bullish breadth thrust with a move above +30%.
The next chart shows the S&P Mid-Cap 400 with S&P MidCap AD Percent ($MIDADP) and the 10-day EMA of AD Percent. AD Percent equals: (advances - declines)/(total issues). A move to 80% means 90% of the stocks in the index advanced, while a move to -80% means 90% of the stocks in the index declined. For example: 360/400 = 90%. 360 advances - 40 declines = +320 and 320/400 = 80%.
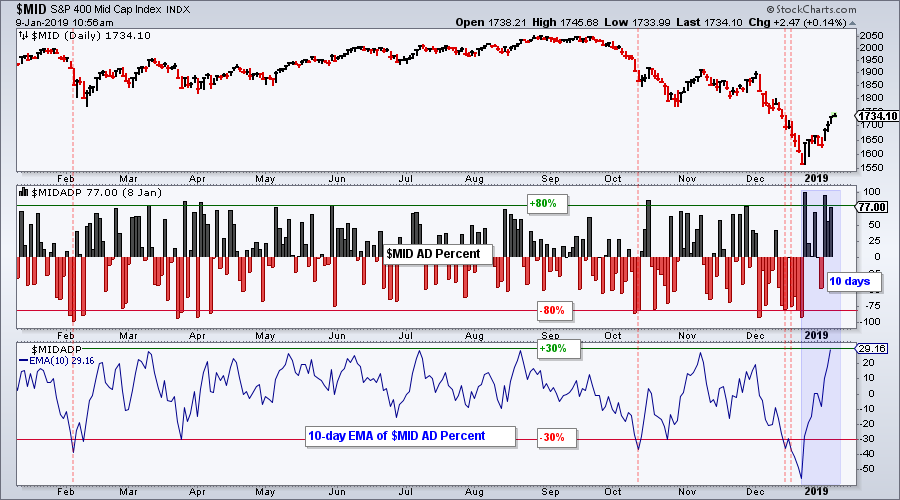
The blue shading highlights the last ten days. Note that the big negative AD Percent value on December 24th will drop off when today’s value is added to the EMA. With the 10-day EMA currently at 29.16%, this means the indicator will likely move above +30% after the close today (barring a big decline today).
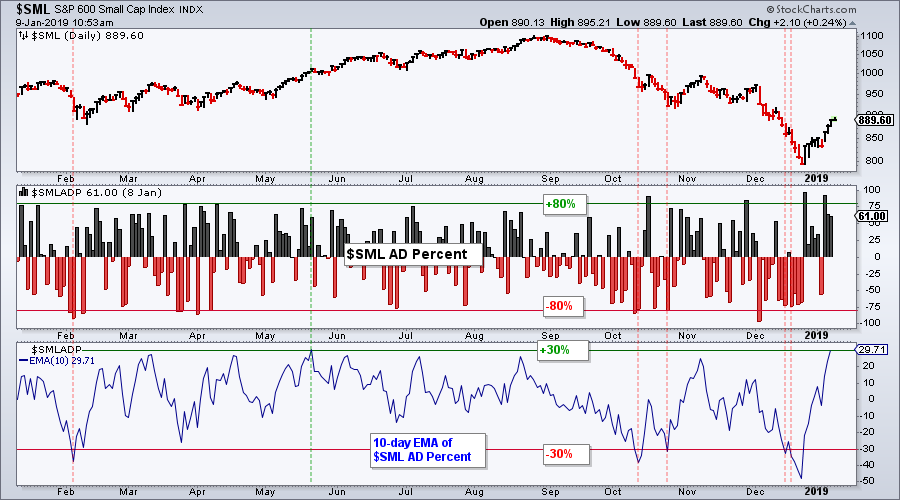
The next chart shows the S&P Small-Cap 600 with S&P SmallCap AD Percent ($SMLADP) and the 10-day EMA of AD Percent. The 10-day EMA finished at 29.71% on Tuesday and could move also above +30% by the close today.
As a group, these three breadth indicators would turn bullish if two of the three 10-day EMAs move above +30%. Would this be enough to turn bullish on stocks again? Not for me. As noted above, the current advance, while impressive from a 10-day standpoint, is still in overshadowed by the prior 14-day decline in December. This is just a sharp counter trend bounce after an even sharper decline.
Furthermore, these breadth indicators are part of a bigger group and we need to take a weight of the evidence approach to broad market analysis. This includes basic trend identification for the major stock indexes and key sectors as well as longer-term breadth indicators, such as High-Low Percent and %Above 200-day EMA. Using three indexes and three breadth indicators, there are nine breadth indicators that I watch. Five of the nine need to trigger bullish before I would consider turning bullish on the broader market again.
As a group, these indicators are not perfect, but I think they capture the broad market environment quite well. There were NO new highs in the S&P 500 on Tuesday and just 30% of stocks in the index are above their 200-day EMA. That does not sound like a bullish environment to me.
On Trend on YouTube
Methods to Measure a Breadth Thrust
- Zweig, Appel and Hill Breadth Thrusts
- Marking First Resistance for SPY and QQQ
- Watch %above 20-day EMA for Overbought
- 8 Bearish Setups and 8 Bullish Setups
- 8 IBD-50 Stocks with Bullish Setups
- Click here to Watch
- Arthur Hill, CMT
Senior Technical Analyst, StockCharts.com
Book: Define the Trend and Trade the Trend
Twitter: Follow @ArthurHill


