- Big Markets in Big Downtrends.
- Bullish Breadth Surge.
- Counting New Highs on One Hand.
- Vast Majority of Stocks in Downtrends.
- A Return to the Breakdown.
- A Potential Reversal Area.
- Finding Pockets of Strength.
- India Starts to Drag.
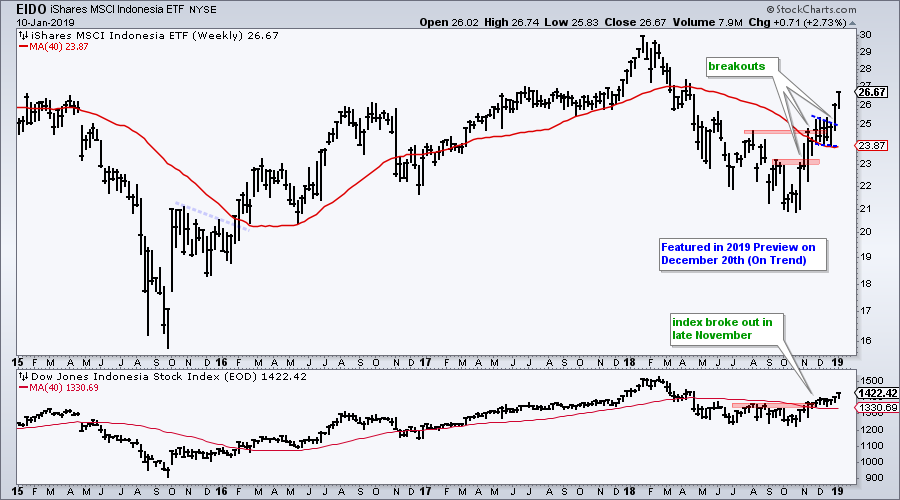
- Indonesia Extends on Breakout.
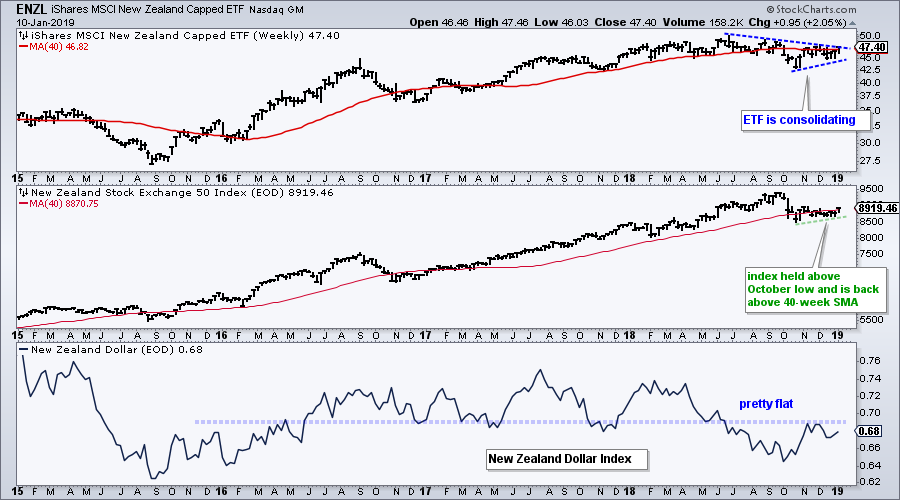
- New Zealand Holds above October Lows.
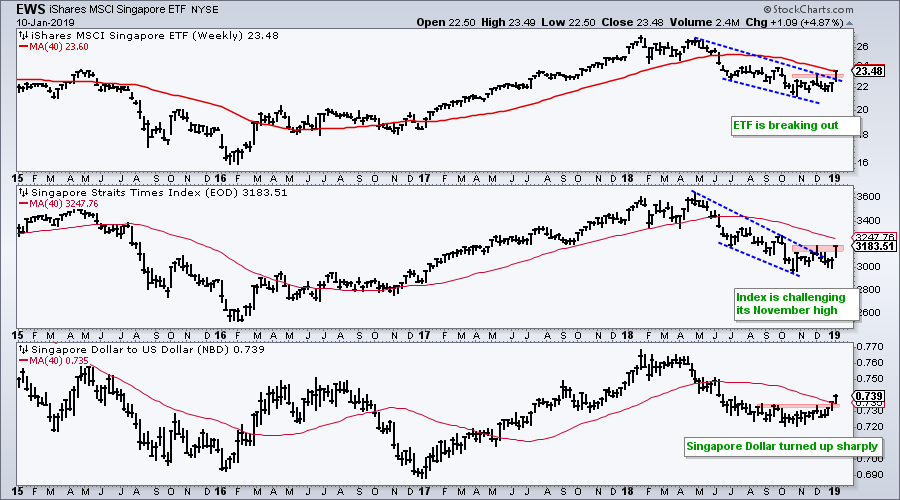
- Singapore Dollar Surges.
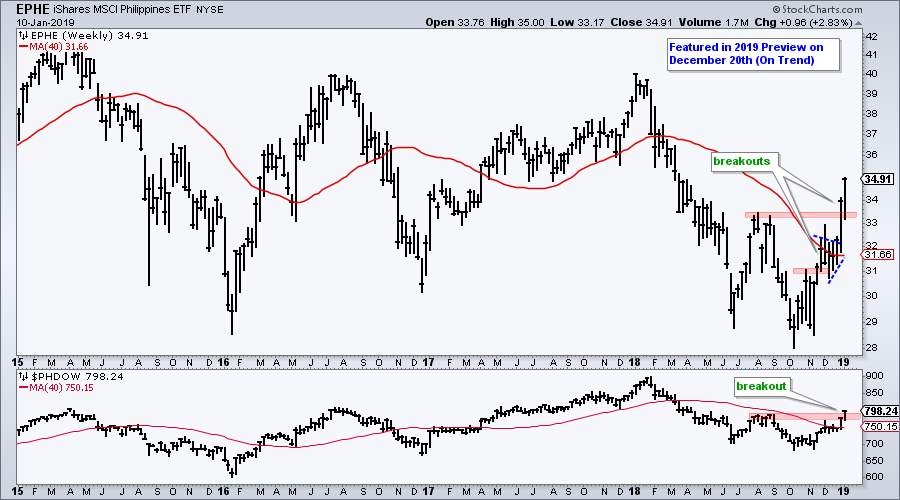
- Philippines ETF Hits 8-month Highs.
- Bovespa Hits New High.
- EEM Firms as EM Currencies Turn Up.
- Art's Charts ChartList.
 ... Big Markets in Big Downtrends
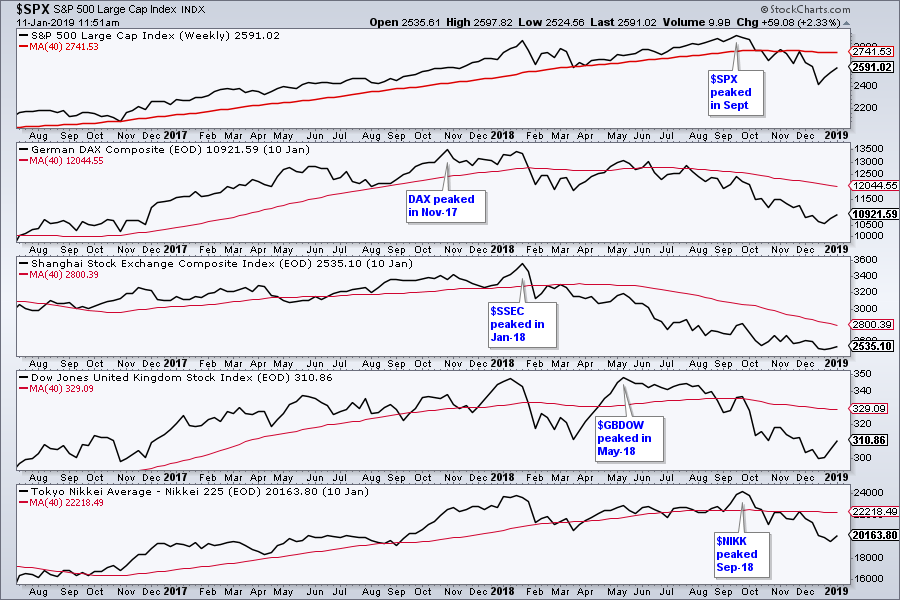
... The S&P 500 went from a fifteen percent loss in fourteen days to a ten percent gain in eleven days. While the surge over the last eleven days is impressive by itself, it is still less than the prior decline and still just a bounce within a bigger downtrend.
Yes, we saw the Zweig Breadth Thrust trigger for the NYSE and the Nasdaq. Yes, the 10-day EMAs of AD Percent surged above 30% to confirm the bullish breadth thrust. Yes, strong upside momentum and broad upside participation are bullish. However, and you just knew a "however" was coming, it is not enough to reverse the bearish signals seen in mid October. More on that later.
The S&P 500 and the Nikkei 225 ($NIKK) were holding up find with fresh 52-week highs in September. With breakdowns in October and 52-week lows in December, they join the German DAX Index ($DAX), the Dow Jones UK Index ($GBDOW) and the Shanghai Composite ($SSEC) with new lows. These indexes represent five of the largest economies in the world. They all hit new lows in December and all are below their 40-week SMAs. It is not a pretty picture.
A Breadth Surge, but How Bullish?
There was a breadth thrust this week as the 10-day EMAs for S&P 500 AD Percent ($SPXADP), S&P MidCap AD Percent ($MIDADP) and S&P SmallCap AD Percent ($SMLADP) surged above +30%. This is the first time all three triggered bullish signals since March 2016. These signals also jibe with the Zweig Breadth Thrust signals seen earlier this week.
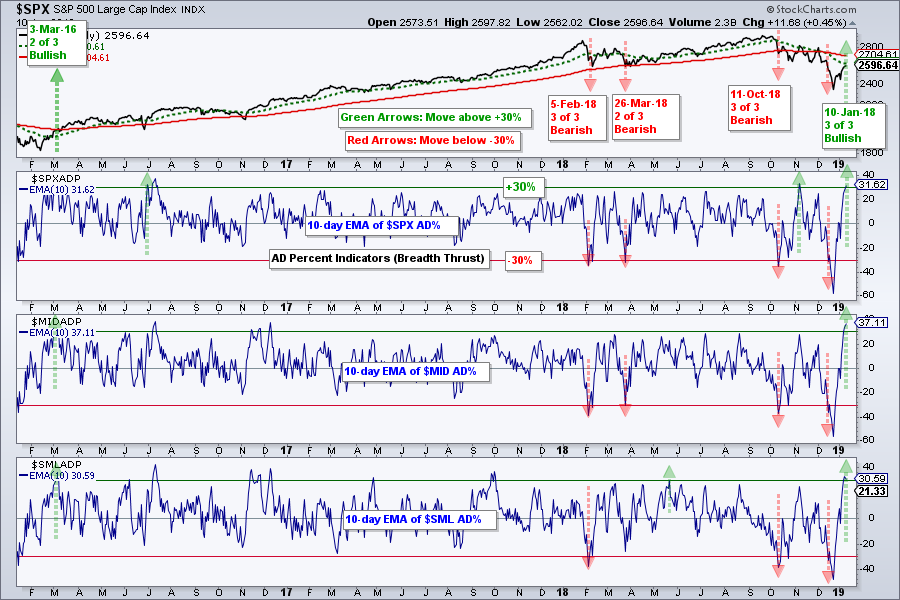 What exactly is a breadth thrust anyway? The surge above 30% in all three reflects broad participation in the market advance over a 10 day period. While this is clearly a positive for the market, keep in mind that we witnessed even broader downside participation in December when all three exceeded -40%.
Counting New Highs on One Hand
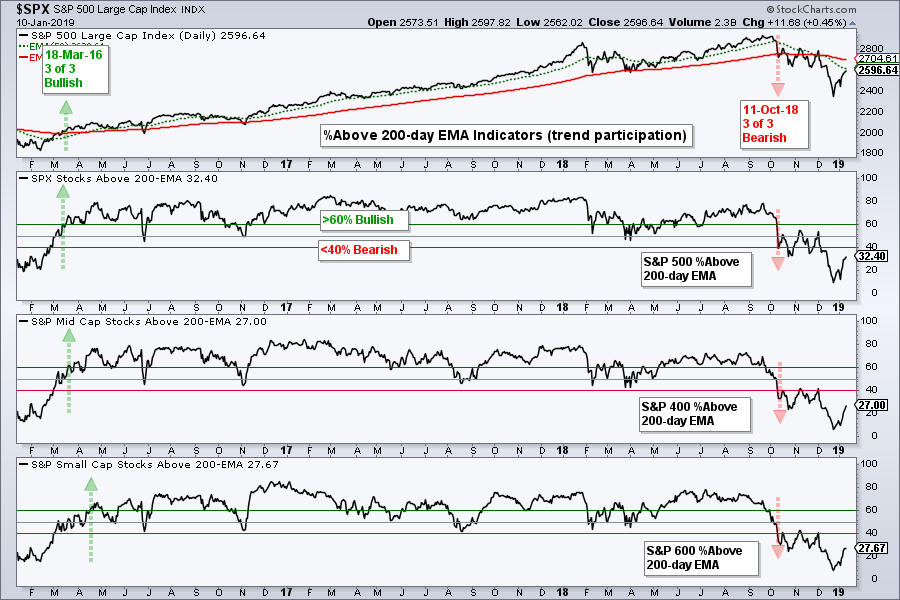
Despite an 11% move in the Equal-weight S&P 500 and another higher close on Thursday, there were hardly any new highs in the market. The chart below shows zero new highs in the S&P 500, two new highs in the S&P Mid-Cap 400 and two new highs in the S&P Small-Cap 600. That makes for a whopping four new highs out of 1500 stocks. The number of new highs needs to exceed the +10% level for at least two of the three indexes for this indicator group to turn bullish. Thus, more work is needed to reverse the bearish signals seen in mid October.
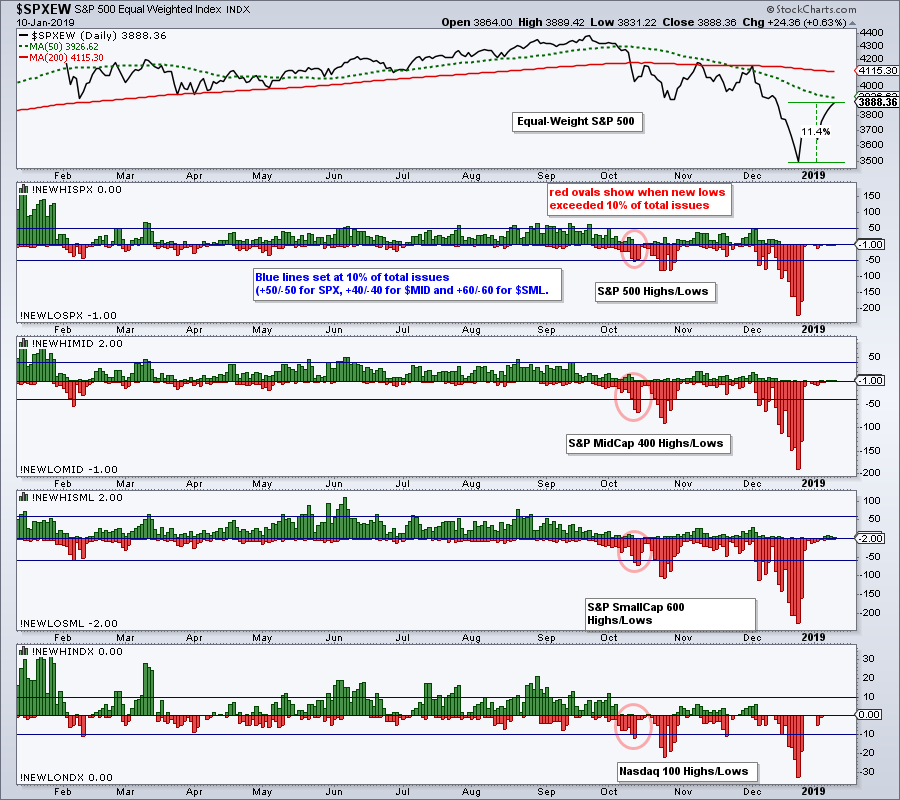
The High-Low indicators show the number of stocks in strong uptrends (new highs) and downtrends (new lows). Even though the number of new lows shrunk, we have yet to see an expansion in new highs. Stocks with strong uptrends are needed to power a bull market environment and I have yet to see this.
Vast Majority of Stocks in Downtrends
The third indicator shows the number of stocks in uptrends, based on price and the 200-day EMA. The S&P 500 is leading with 32.40%, while the S&P Small-Cap 600 and S&P Mid-Cap 400 are lagging with around 27%. These indicators are not even close to 50% and not even close to turning bullish. Thus, more work is needed to turn this counter-trend bounce into something more.
A Return to the Breakdown
The next chart shows weekly bars for the S&P 500 over the last five years. First and foremost, the evidence points to a downtrend. Price broke down in mid October, price remains below the falling 40-week SMA and the index recorded a new 52-week low in December. After stalling in November, the index broke down again in early December with a move below the consolidation boundary. Stocks became extremely oversold on December 24th and then roared back over next the 11 days with a 10.44% surge. This bounce is still smaller than the December decline and the index is back near the break zone, which turns first resistance.
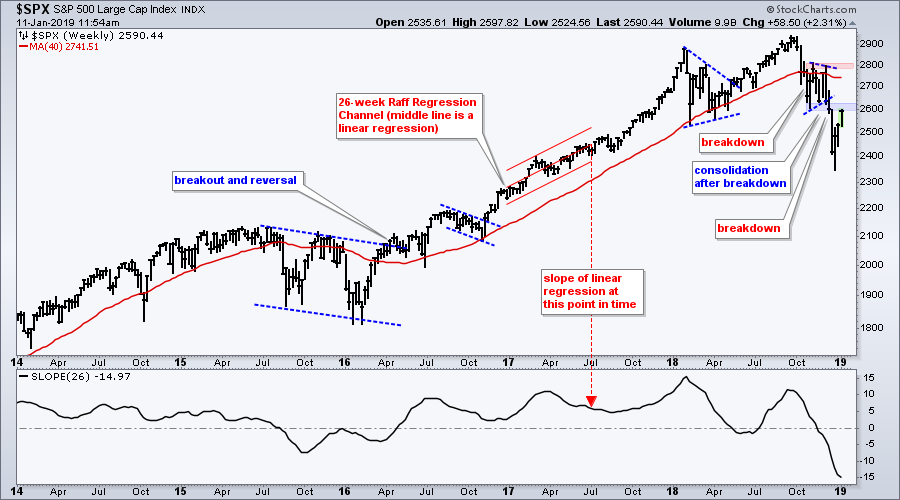
The indicator window shows the 26-week slope, which measures the slope of the 26-week linear regression. This is the middle line of a Raff Regression Channel and an example is shown in 2017 on the price chart. The slope value reflects the steepness of the current move and it has become quite steep. This indicator would need to turn positive and price would need to move above the 40-week SMA before considering a return to the long-term uptrend.
When it comes to broad market direction, we pretty much just need to focus on the S&P 500. The S&P Mid-Cap 400, S&P Small-Cap 600, Nasdaq 100 and the big offensive sectors are highly correlated to the index and the S&P 500 is the most widely followed benchmark. Get the S&P 500 correct and the rest will follow. Usually, small-caps and the Nasdaq 100 will make bigger moves and these can be used to capture a little beta.
An Obvious Reversal Area
The next chart shows SPY at a potential reversal zone (blue shading) as we head into first quarter earnings. This is a classic setup. First, broken support turns into resistance. Second, the bounce retraced 50-61.8% of the prior decline, which is typical for a counter-trend bounce. Third, RSI(14) moved into the 50-60 zone, which acts as momentum resistance in a downtrend. Third, RSI(5) moved above 70, which is short-term oversold. There are similar setups at work in QQQ and MDY.
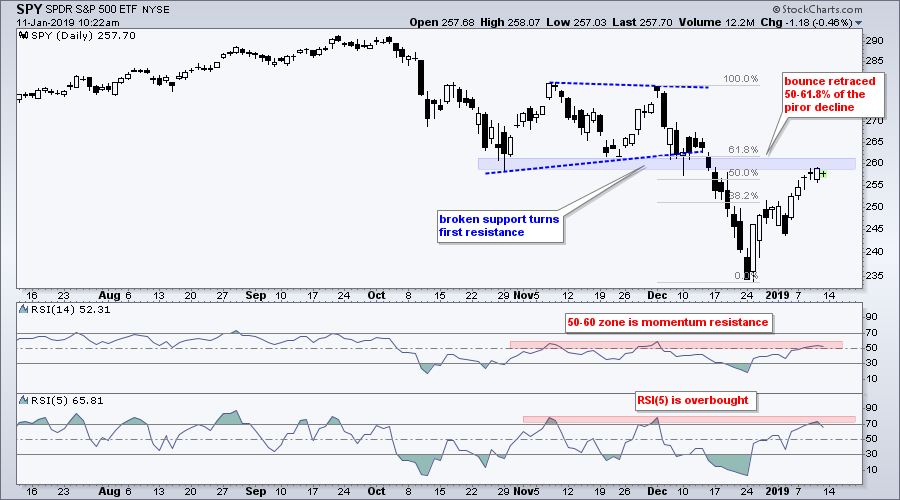
The setup mentioned above is so classic that everybody and their dog is watching it - including me. Unfortunately, the market rarely accommodates the crowd. The cynic in me is asking and answering three questions. What is the last thing you expect? A move above the December high. What is the consensus opinion? A retest of the December low? What is likely? A choppy range.
Finding Pockets of Strength
Note that I cover the 20+ YR T-Bond ETF (TLT), the 7-10 YR T-Bond ETF (IEF), the Gold SPDR (GLD), the Palladium ETF (PALL), the Cocoa ETF (NIB) and the Sugar ETN (SGG) in today's video. I also cover ETFs for Russia, Poland and South Africa. See link above.
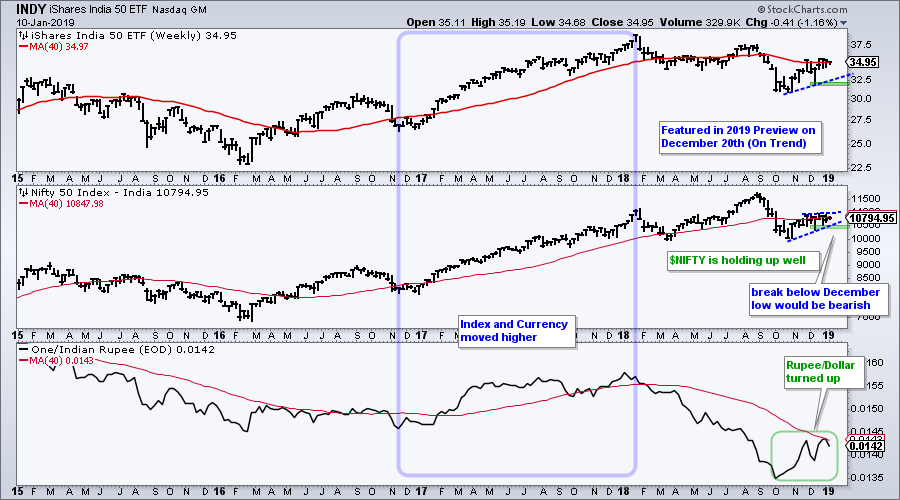
While it is hard to imagine any equity market performing well when the S&P 500 and other large indexes are in downtrends, this next section will highlight some international ETFs that are performing well over the last few months. When available, the chart will show the ETF in the top window, the country index in the middle window and the currency in the lower window. The ETF, which is priced in Dollars, is a combination of the local currency index and the currency (i.e. Rupee/Dollar). The ideal situation for the Dollar-priced ETF is when the index and the base currency move higher. For example, the Nifty 50 India Index ($NIFTY) and the Rupee/Dollar cross. This, of course, is not always the case. Most of the time it is best to focus on the index because stock prices are usually more volatilie than the currency cross, unless there is an event.
Note that the iShares S&P Nifty 50 ETF (INDY), Indonesia iShares (EIDO), Philippines iShares (EPHE) and Brazil iShares (EWZ) were featured in the 2019 Preview on December 20th. You can see this on Youtube.
India Starts to Drag
The first chart shows the iShares S&P Nifty 50 ETF (INDY), the India Nifty 50 Index ($NIFTY) and the Rupee/Dollar cross, which is shown by charting $ONE/$RUP. $NIFTY held up well when the markets swooned in December, but did not move higher the last two weeks. The bias remains bullish, but I will be watching wedge support. A break below the December low would be bearish.
Indonesia Extends on Breakout
The Indonesia iShares (EIDO) started outperforming in November when it broke above its September high. After stalling for four weeks in December, the ETF broke out again over the last two weeks and is one of the global leaders. The DJ Indonesia ($IDDOW) Index also broke above its 40-week SMA in November and hit an eight month high.
New Zealand Holds October Lows
The New Zealand iShares (ENZL) remains stuck in a consolidation and has been pretty flat the last twelve months. The New Zealand 50 Index ($NZ50) fell sharply in October, but firmed in November and December. The index edged above the 40-week SMA this week and is stronger than the S&P 500. The lower window shows the currency trading in a range the last few years.
Singapore Dollar Surges
The Singapore iShares (EWS) broke out as both the Singapore Strait Times ($STI) and the Singapore Dollar surged over the past week. Notice that the index surged this week and the Singapore Dollar surged over the last three weeks. Thus, the currency is helping the ETF and the index is lagging the ETF.
Philippines ETF Hits 8-month High
The Philippines iShares (EPHE) and the DJ Philippines Index ($PHDOW) both hit 52-week lows in October and bounced sharply in November. While the S&P 500 was moving below its October lows in December, the ETF was consolidating in the 31-32 area. EPHE broke out with a surge over the last three weeks. Note that the ETF and the index hit eight month highs this week.
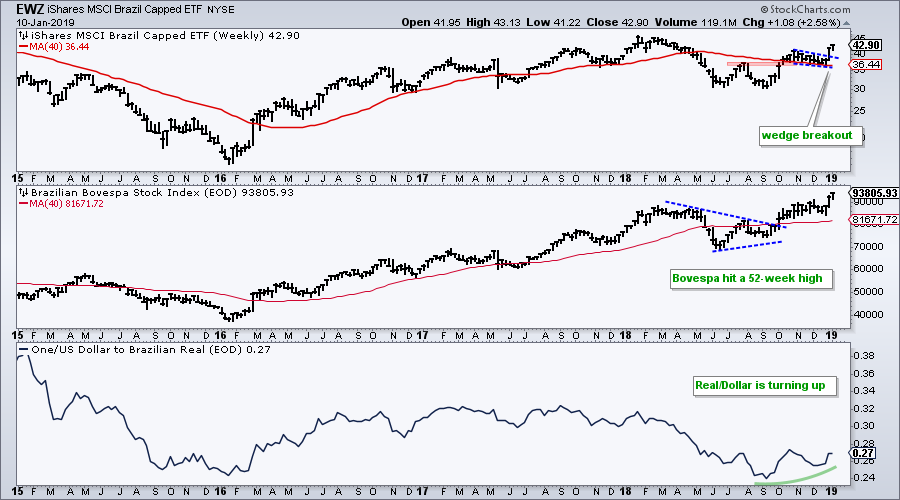
Bovespa Hits New High
The Brazil iShares (EWZ) broke out over the last two weeks, but is lagging the Bovespa ($BVSP), which hit a new high this week. The Brazilian Real took a hit from January to August, but firmed the last few months and even turned up. A stable currency and rising Bovespa would be enough to maintain the uptrend in the ETF.
EEM Firms as EM Currencies Firm
You may have noticed that most of these international ETFs are from emerging market countries. While I am not ready to turn bullish on the Emerging Markets ETF (EEM) right now, it is a good time to check the chart. EEM held up better than SPY over the last few months and is close to a breakout after a nice move this week. The second window shows the MSCI Emerging Markets Index for reference.
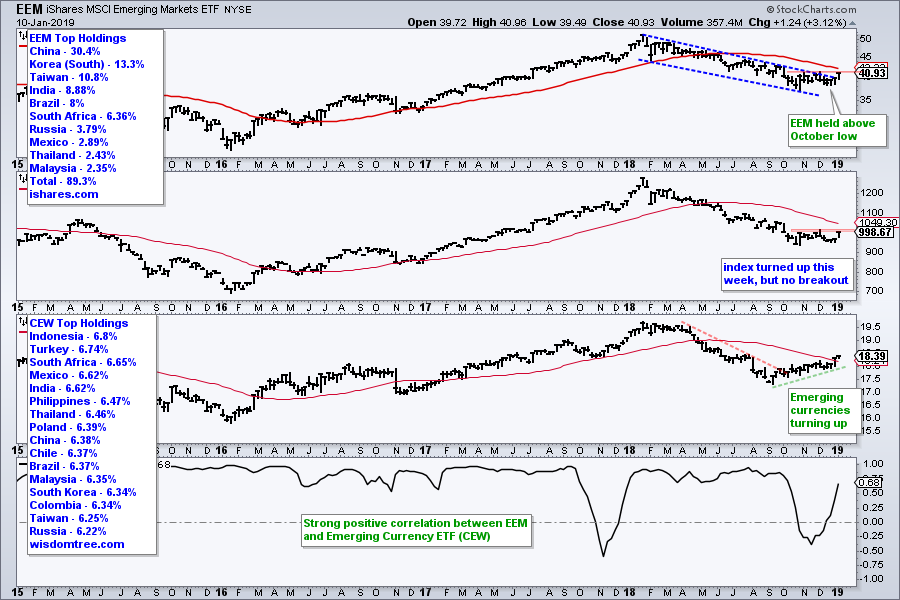 The third window shows the Emerging Currency ETF (CEW) moving higher since September and breaking above its 40-week EMA last week. This is positive for EEM because there is a strong positive correlation between the two. In fact, strength in the EEM currencies could foreshadow a return to confidence in emerging market equities.
Personally, I am not a fan of broad indexes or ETFs that cover more than one country. Instead, I prefer to look at the individual country indexes and ETFs. Brazil, Russia, India and China are emerging markets, but they are each different in their own way. We can also see that Brazil is outperforming the other three and China is the big laggard. Why own the BRIC ETF (EEB) when you can choose the strongest and avoid the weakest.
Art's Charts ChartList
I updated the ChartList with a selection of key charts to watch going forward. The S&P 500 and breadth charts are at the top. Bond and commodity ETFs follow. Gold, Palladium, Cocoa and Sugar look promising. The list ends with ten international ETFs. Click here for the ChartList.
Questions, Comments or Feedback?
I do not take symbol request and I cannot promise to response to all correspondence, but I will read it and take into under consideration. I greatly appreciate all feedback because it helps me improve the commentary and provides ideas for the future.

Plan Your Trade and Trade Your Plan.
- Arthur Hill, CMT
Senior Technical Analyst, StockCharts.com
Book: Define the Trend and Trade the Trend
Twitter: Follow @ArthurHill
